Sentry — трекинг java exception в Java
Стандартно Java разработчики мониторят ошибки, exception через логи. Но есть и другой способ, а именно отправка exception в Sentry.
Sentry — инструмент мониторинга исключений (exception), ошибок в ваших приложениях.
Преимущества использования Sentry:
- не нервничать при размещении приложений на боевом сервере,
- быстро находить причины возникших проблем,
- устранять баги раньше, чем о них вам сообщат тестировщики, коллеги из саппорта, пользователи, ПМ или директор,
- выявлять незаметные остальной команде проблемы, которые портят жизнь пользователям и снижают эффективность вашего продукта,
- бесплатен,
- легко интегрируется в проект,
- ловит ошибки и в браузере пользователя, и на вашем сервере.
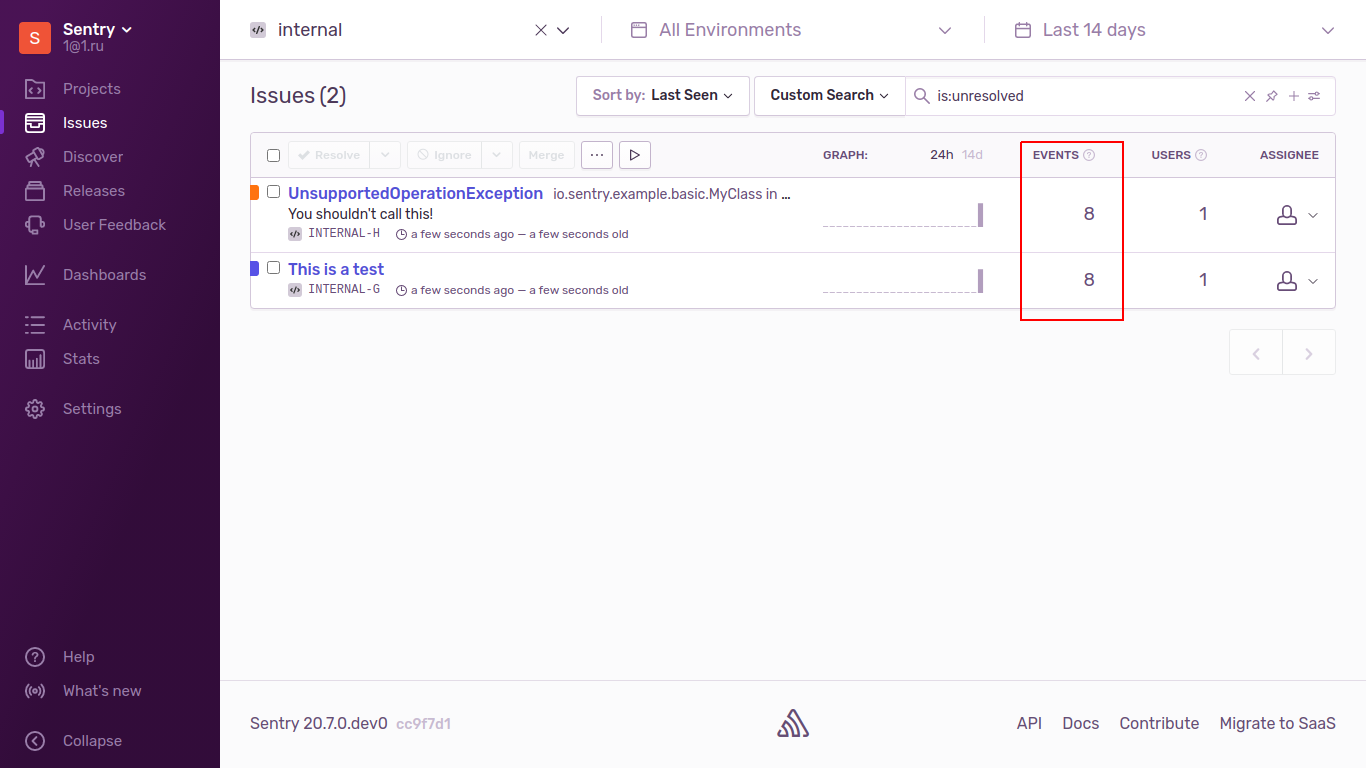
- Если в ELK один и тот же exception происходит несколько раз, то они идут как отдельные записи, занимают место на диске и в ОЗУ. Если в Sentry один и тот же exception происходит несколько раз, то поле EVENTS увеличивается, тем самым экономя место на диске и в ОЗУ.
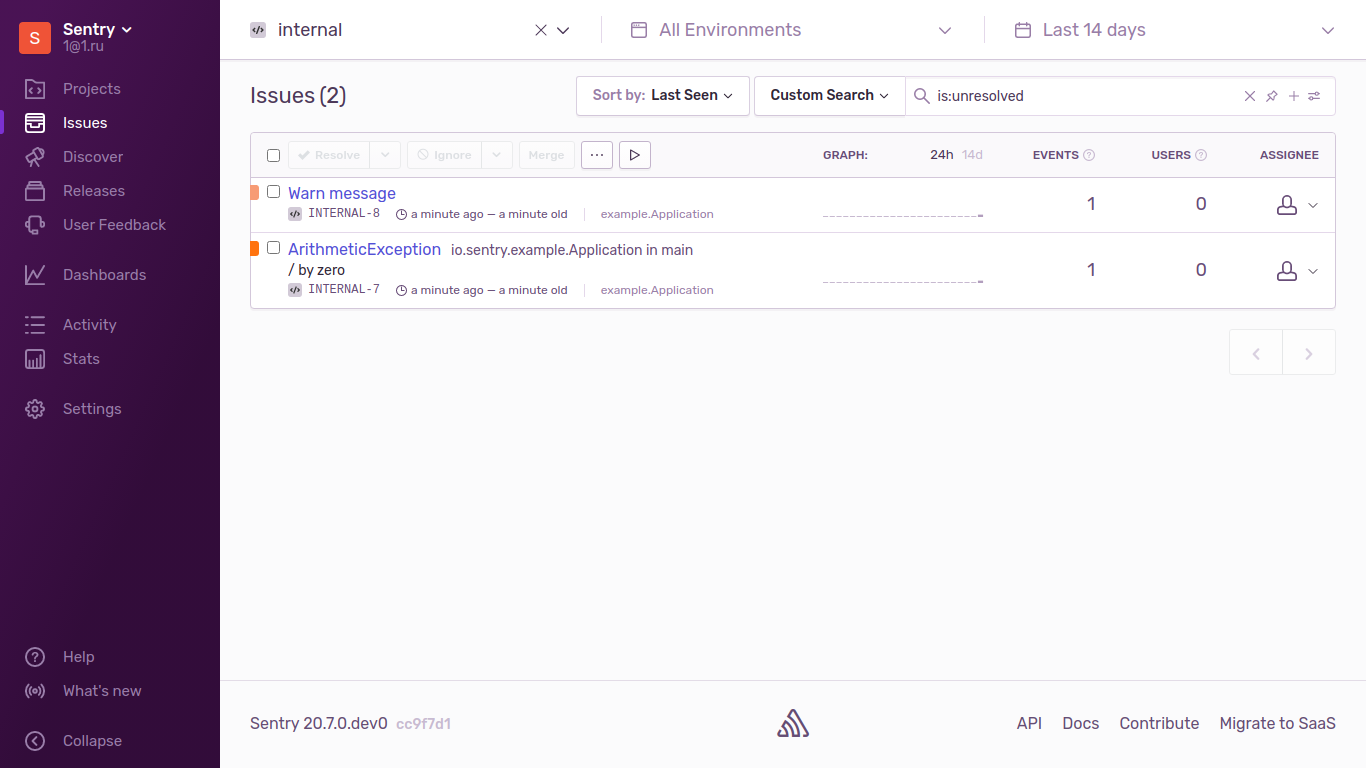
Пример

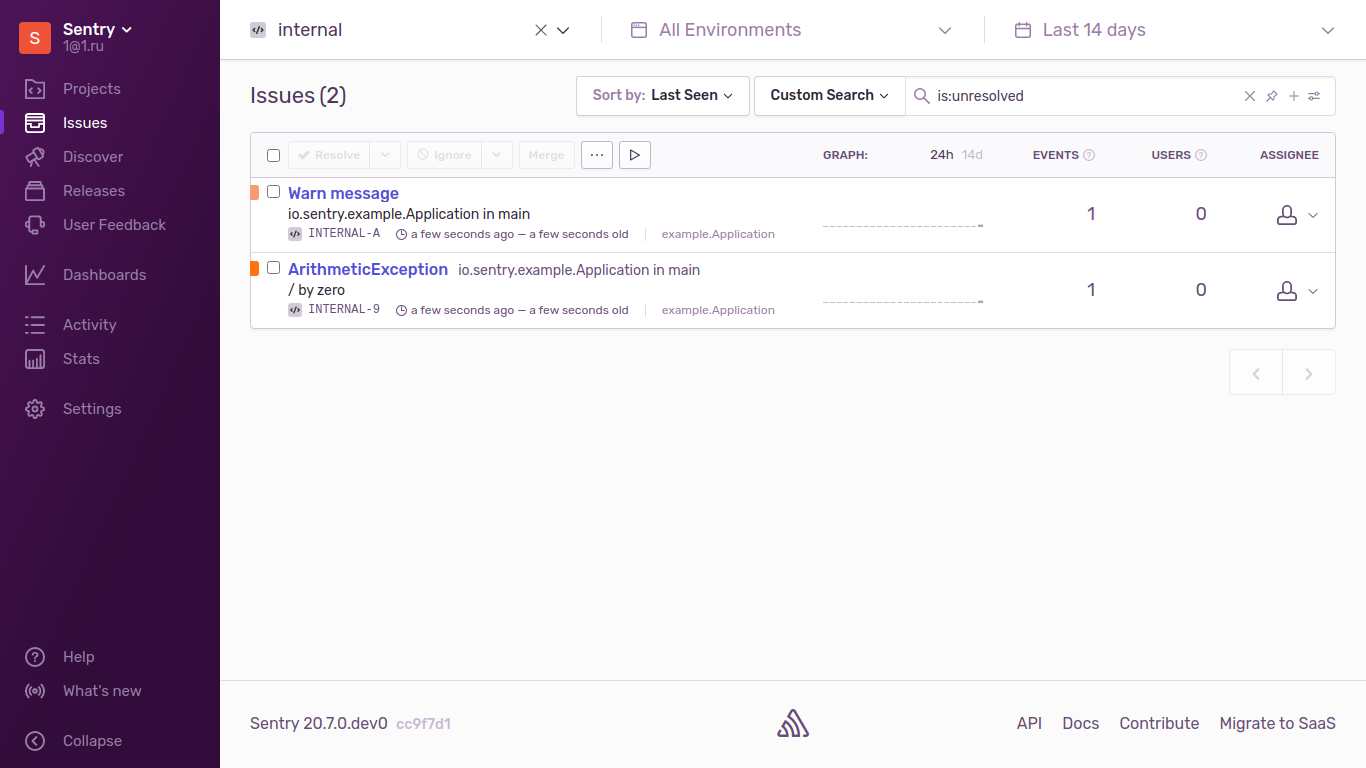
Основные возможности:
- Список ошибок обновляется в режиме реального времени,
- Если ошибка была помечена как решенная и появилась снова, то она снова создается и учитывается в отдельном потоке,
- Ошибки группируются и отображаются в порядке частоты появления,
- Ошибки можно фильтровать по статусам, источнику логгирования, уровню логгирования, имени сервера и т.д.
Sentry поддерживает большую часть языков программирования. Подробнее здесь.
Устанавливаем Sentry
- через скрипт, который в docker-compose поднимет все компоненты (скрипт и репо находятся здесь https://github.com/getsentry/onpremise/)
- собираем RPM пакеты все зависимостей Sentry и устанавливаем через RPM пакеты https://habr.com/ru/post/500632/
После установки Sentry у вас должен быть DSN

Здесь будет обзор основных примеров отправки java exception в Sentry. Примеры будем брать из официального репозитория https://github.com/getsentry/examples/tree/master/java.
Зависимости
На машине где будете запускать эти примеры необходимо иметь установленными JDK и Maven.
# Пример для CentOS
wget http://repos.fedorapeople.org/repos/dchen/apache-maven/epel-apache-maven.repo -O /etc/yum.repos.d/epel-apache-maven.repo
yum install -y apache-maven java-1.8.0-openjdk-devel git
Скачиваем репозиторий
git clone https://github.com/getsentry/examples.git
cd examples/java/
Sentry Basic Example
Переходим к https://github.com/getsentry/examples/tree/master/java/basic
cd basicЗапускаем компилирование проекта
mvn compile exec:javaЗапускаем Java приложение и передаем ему SENTRY_DSN
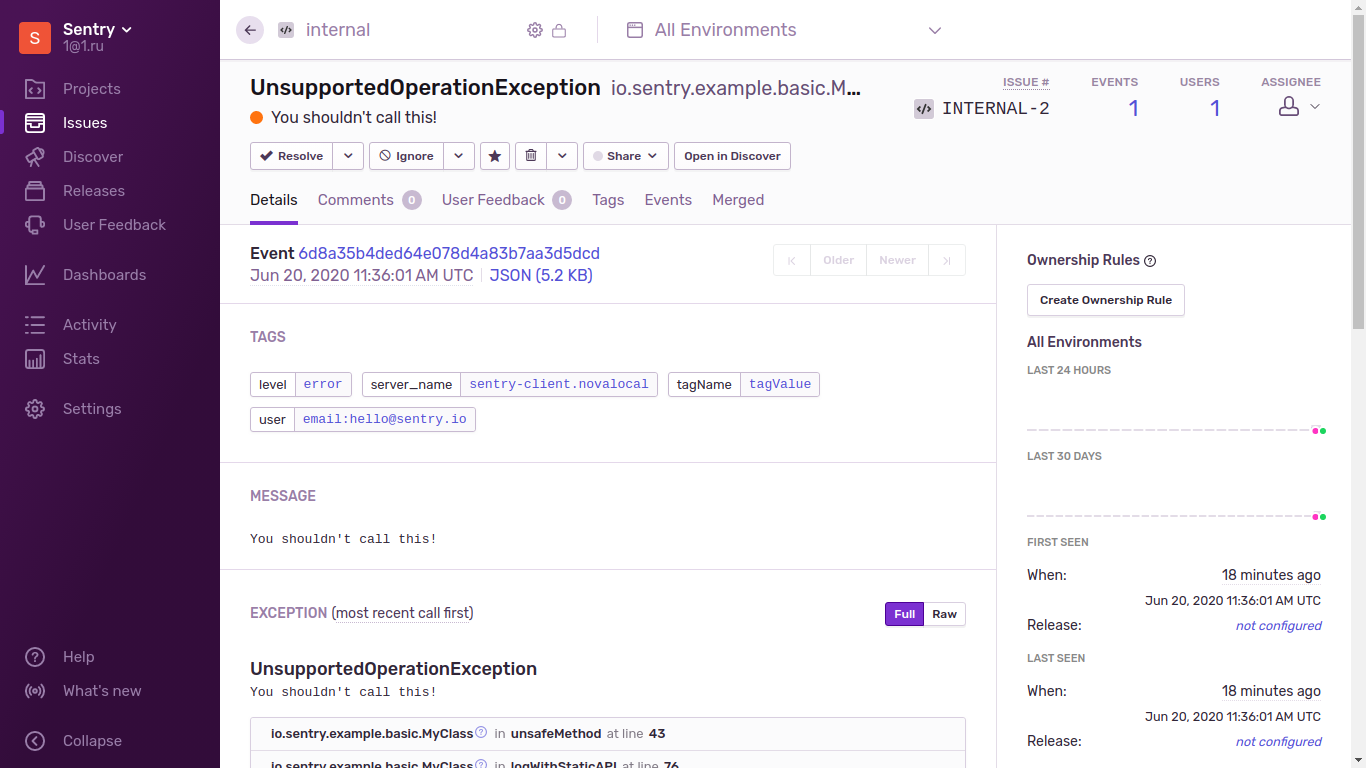
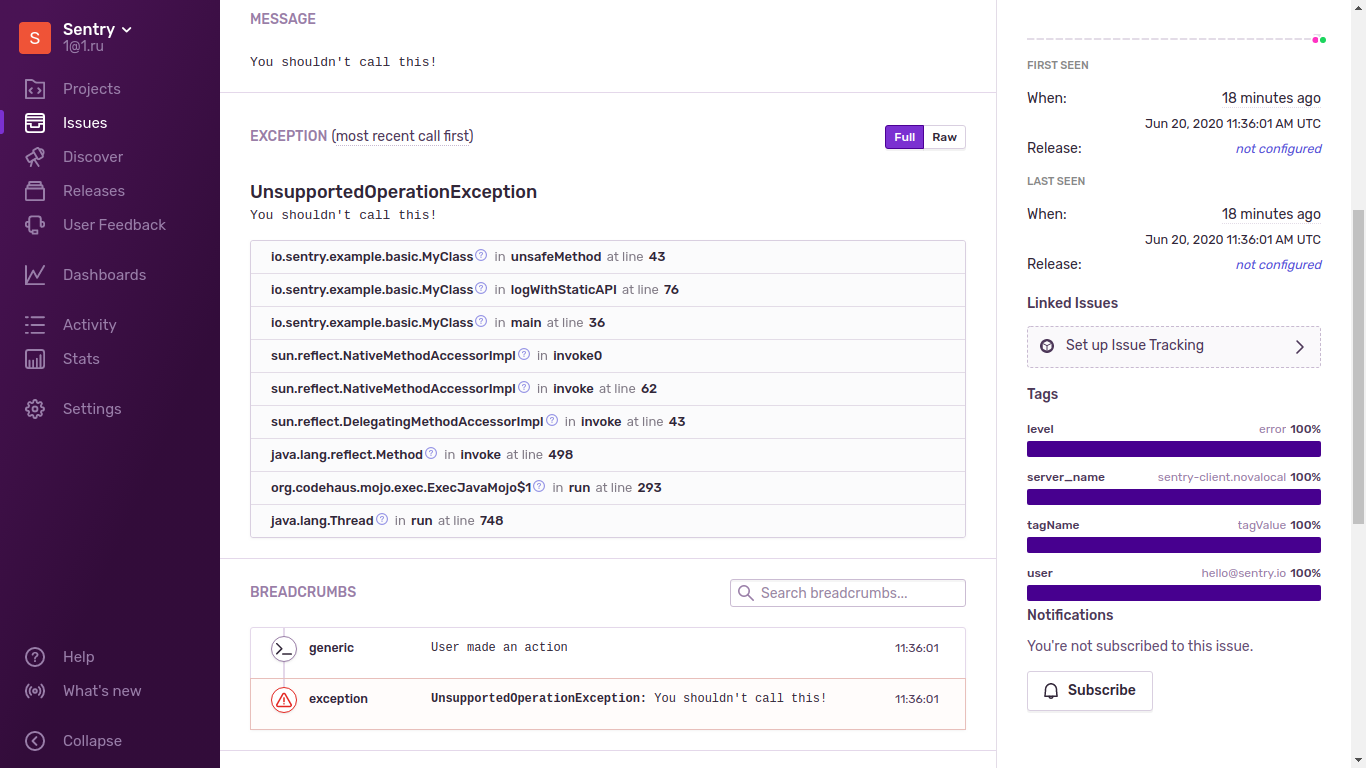
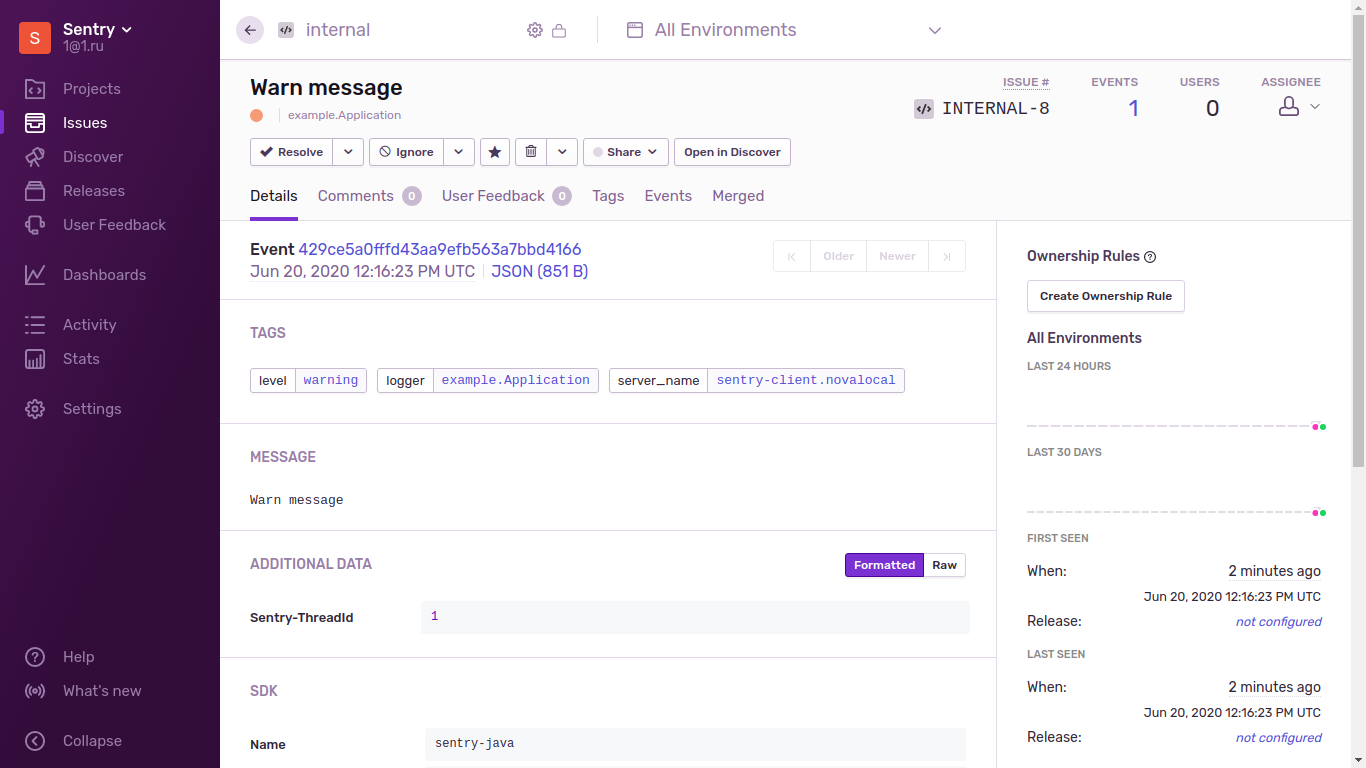
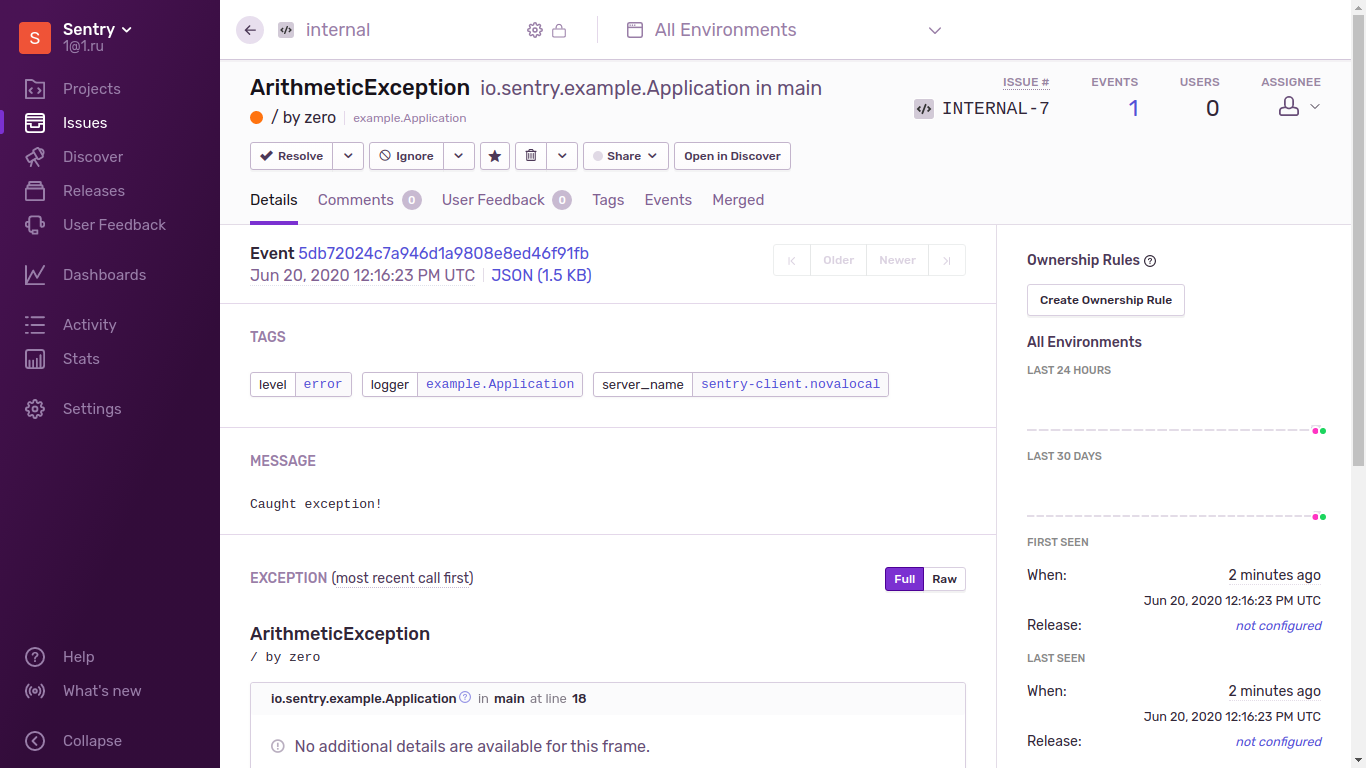
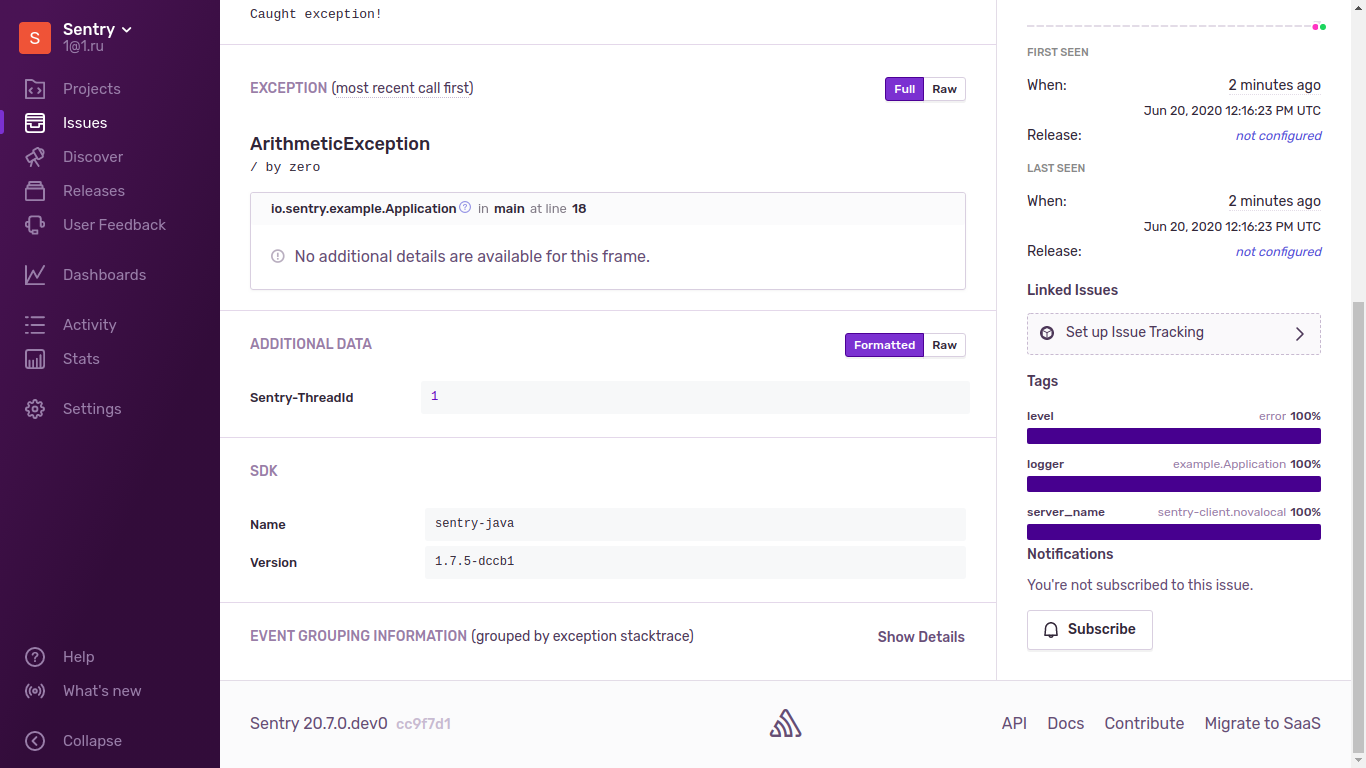
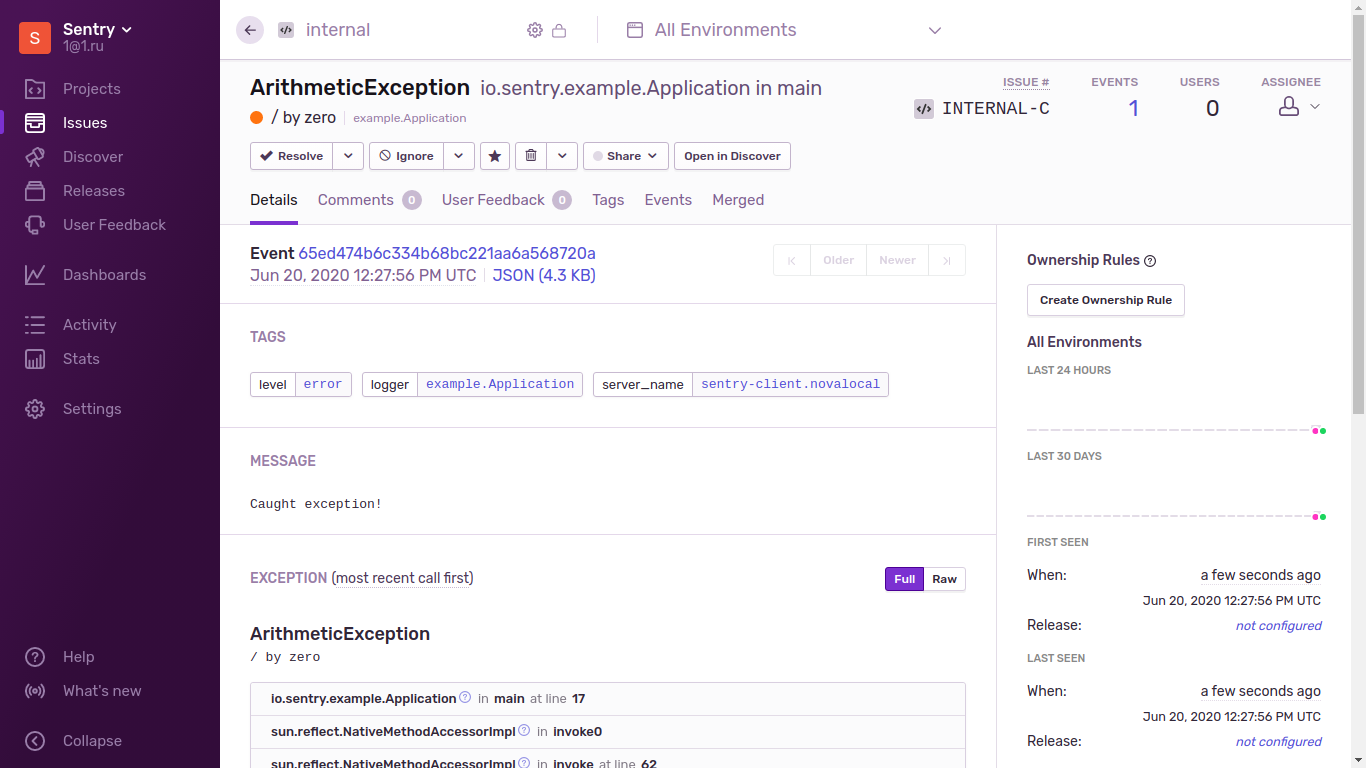
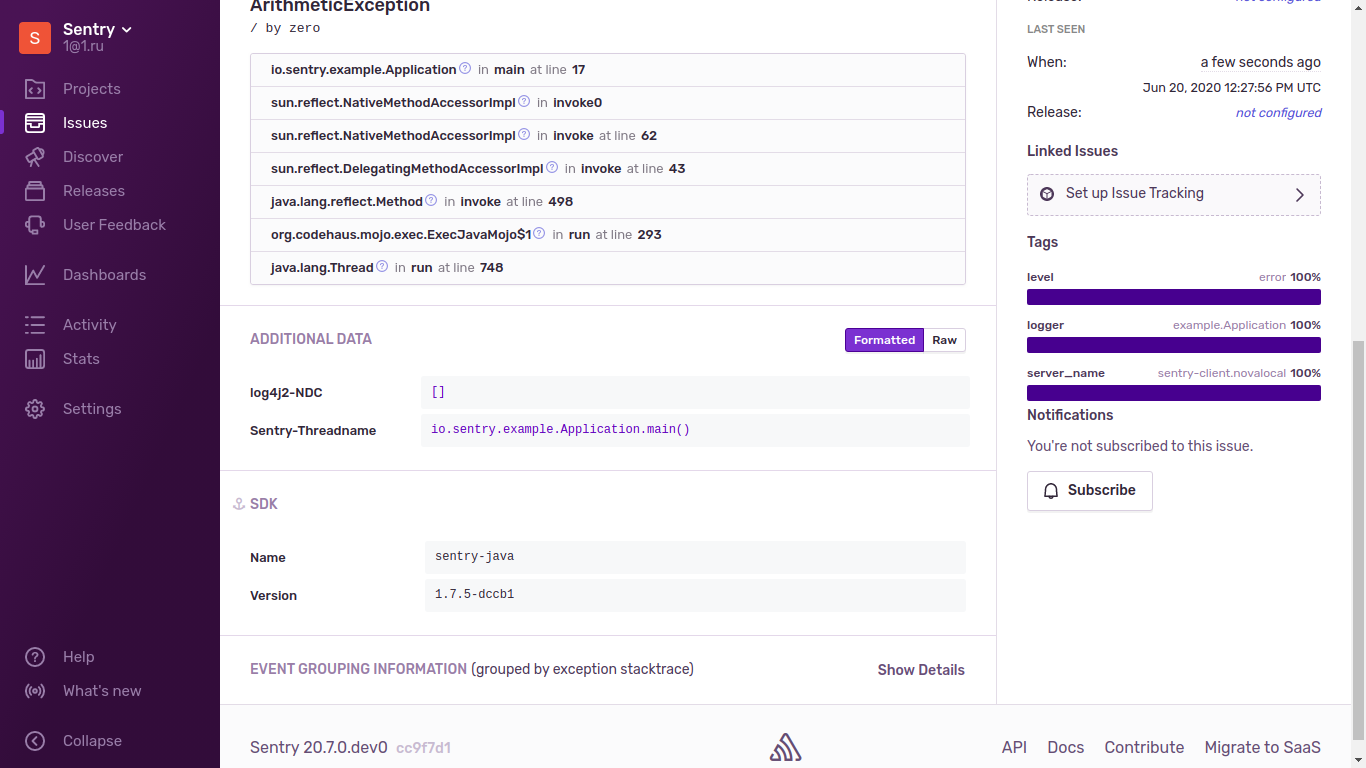
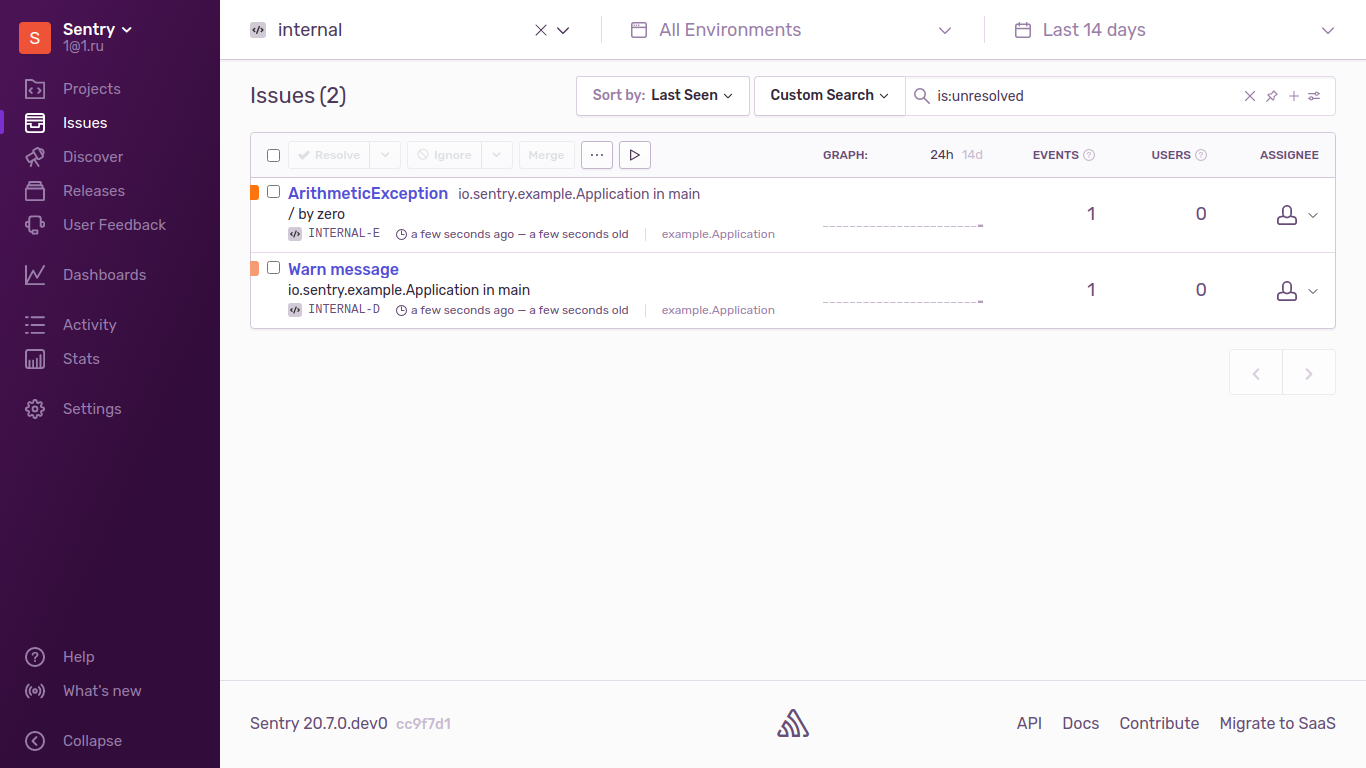
SENTRY_DSN=http://31bc93d7d64e4fd6b2e77d6d7780be6c@172.26.10.64:9000/1 mvn exec:javaКак выглядят exception в Sentry
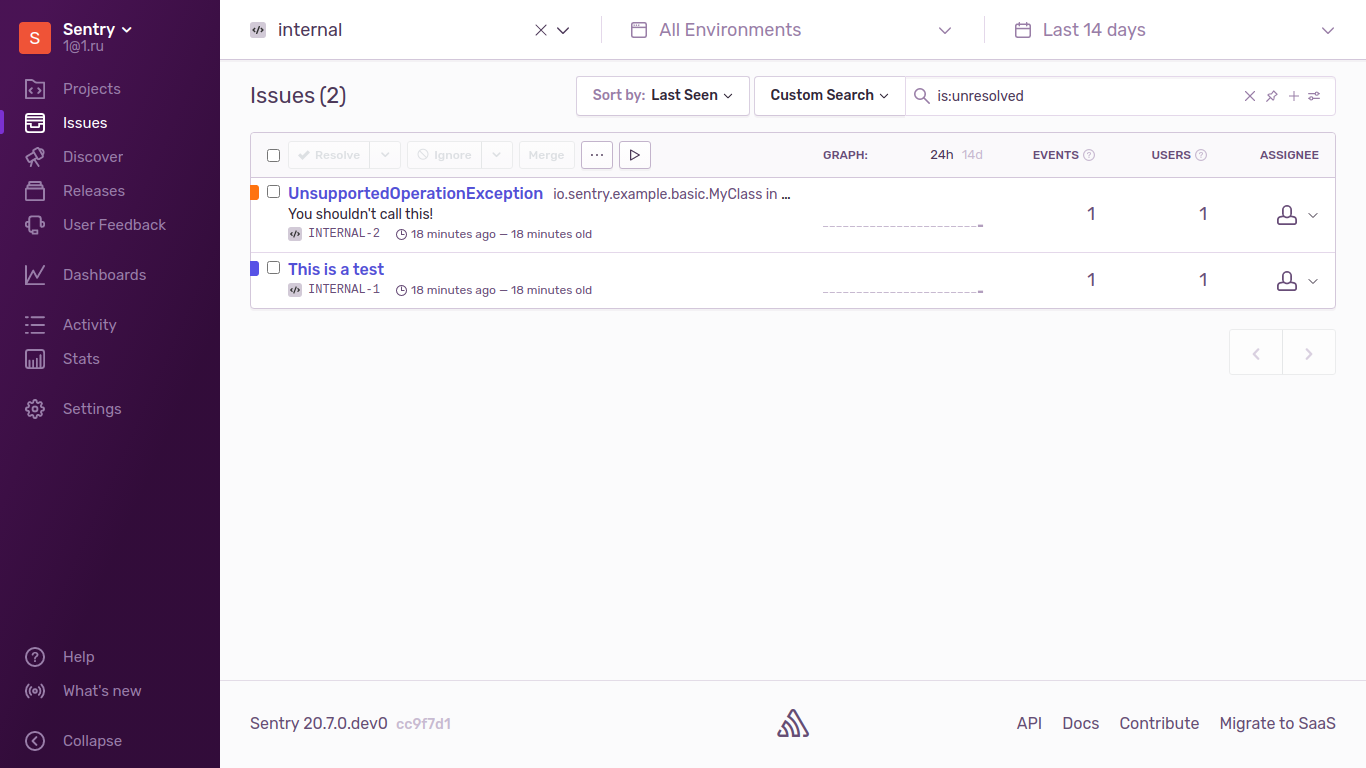
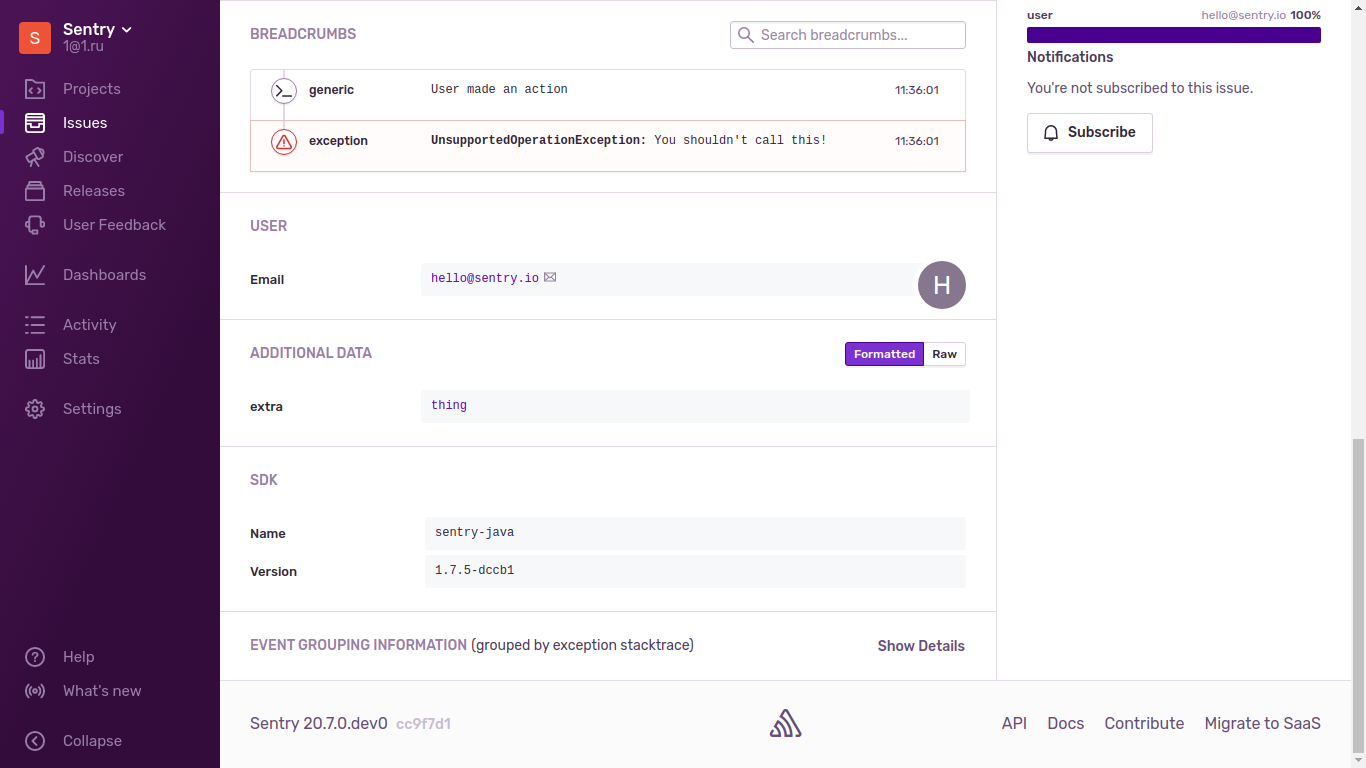
Запустим приложение несколько раз:
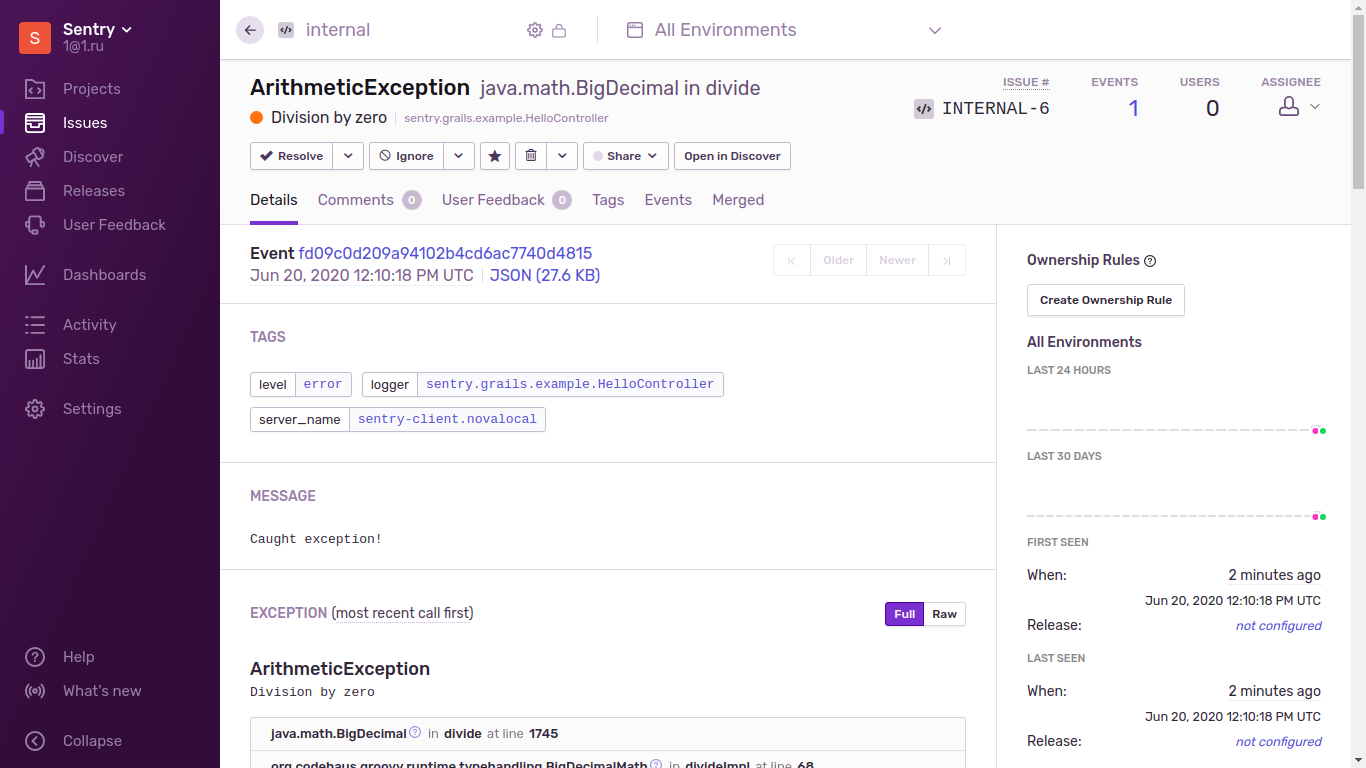
SENTRY_DSN=http://31bc93d7d64e4fd6b2e77d6d7780be6c@172.26.10.64:9000/1 mvn exec:javaВидно что счетчик EVENTS для этого конкретного exception увеличился. Скриншот в начале поста.
Sentry Grails Example
Переходим к https://github.com/getsentry/examples/tree/master/java/grails-3.x
Устанавливаем зависимости для SDK
yum install -y unzip zipУстанавливаем grails используя SDK https://grails.org/download.html
curl -s https://get.sdkman.io | bash
source "$HOME/.sdkman/bin/sdkman-init.sh"
sdk install grails
Запускаем grails c SENTRY_DSN
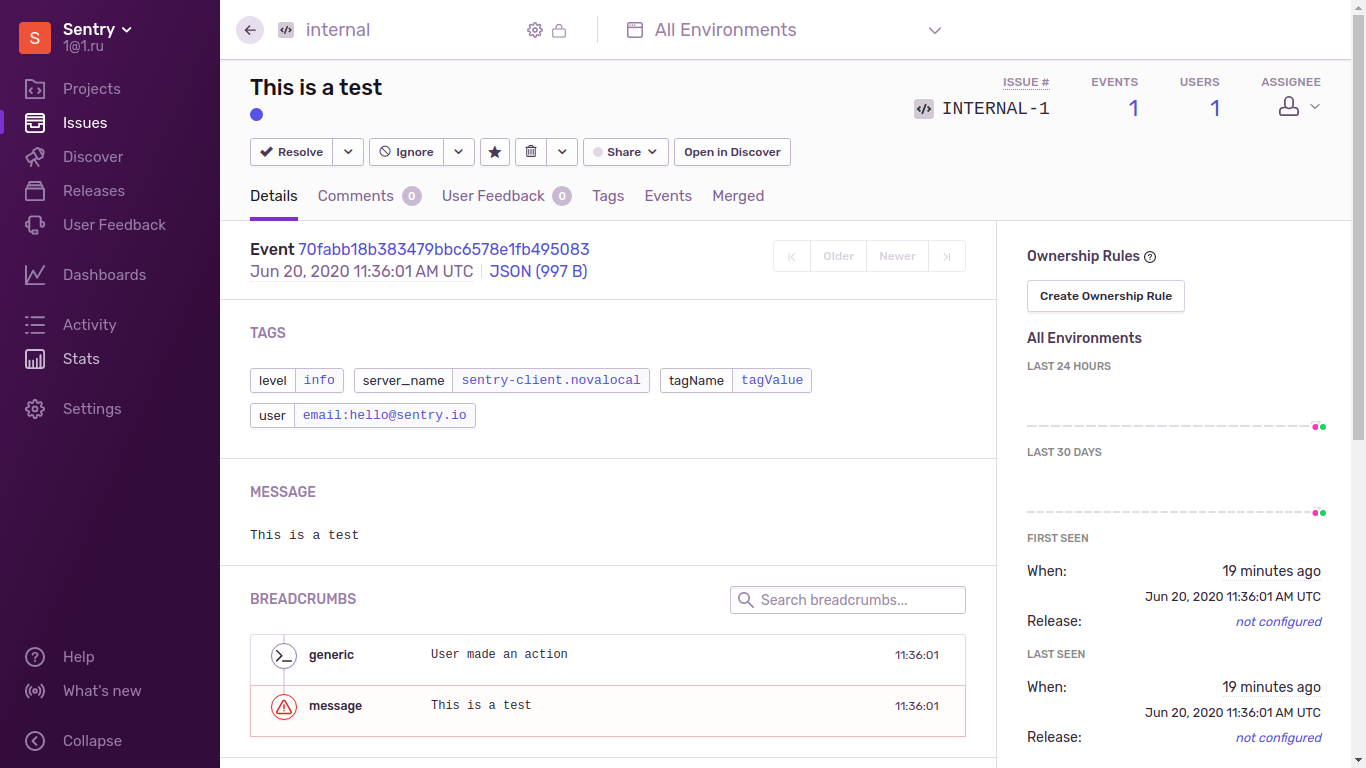
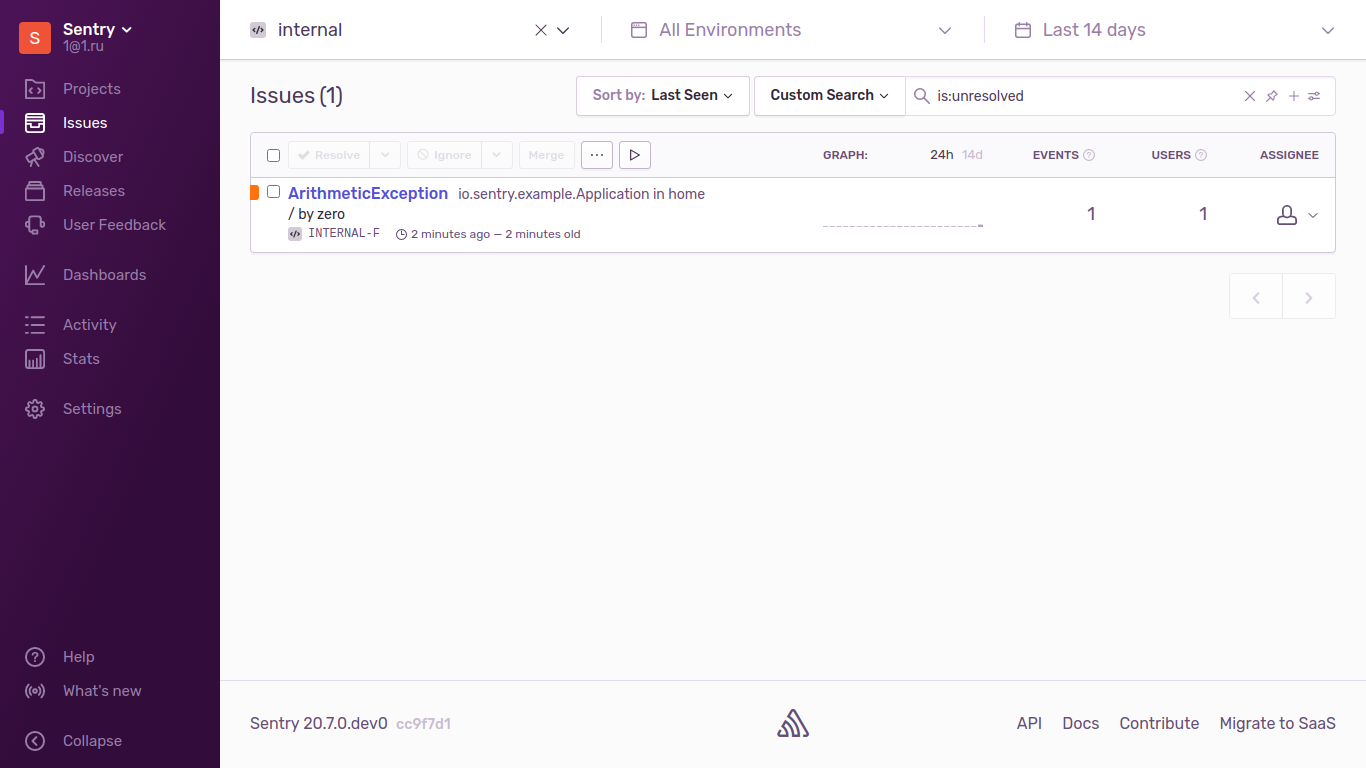
SENTRY_DSN=http://31bc93d7d64e4fd6b2e77d6d7780be6c@172.26.10.64:9000/1 grails run-appОткрываем в браузере http://localhost:8080/hello/index и exception отправляются в Sentry
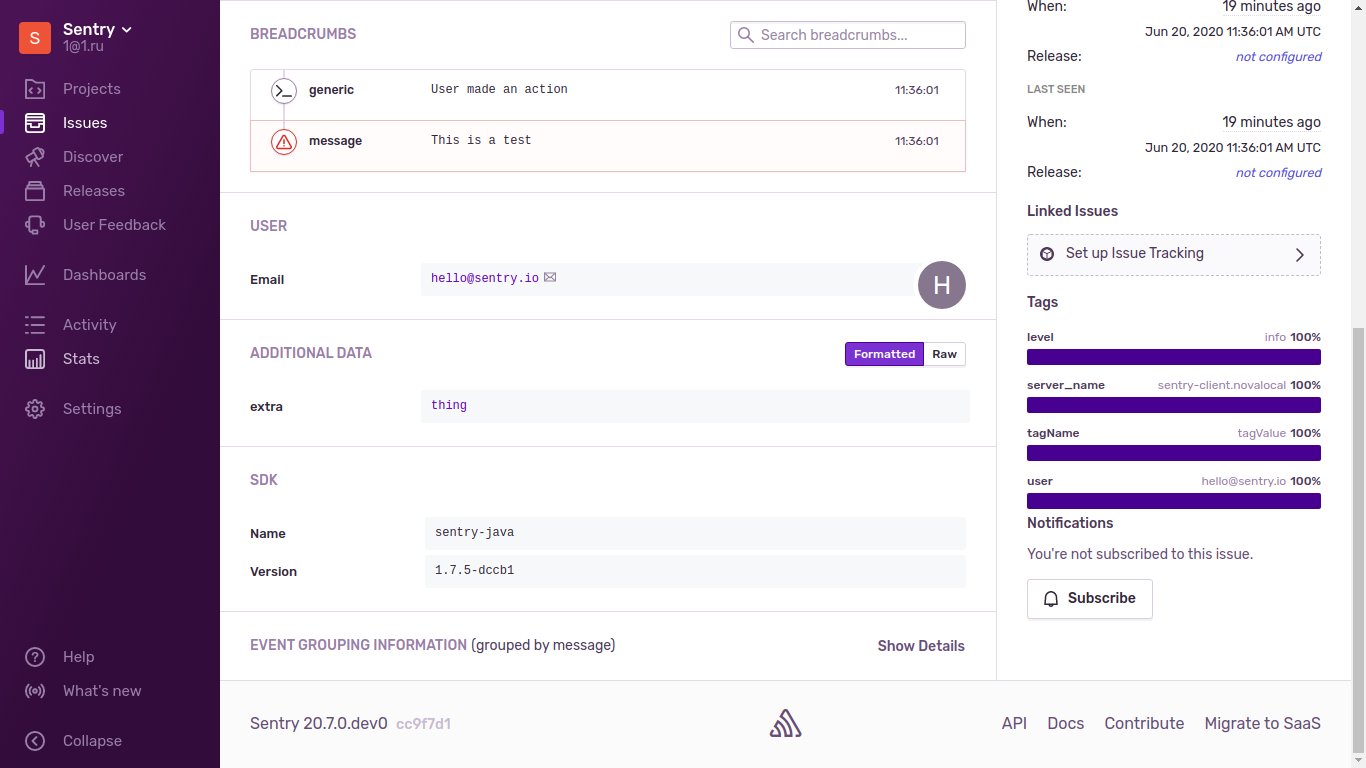
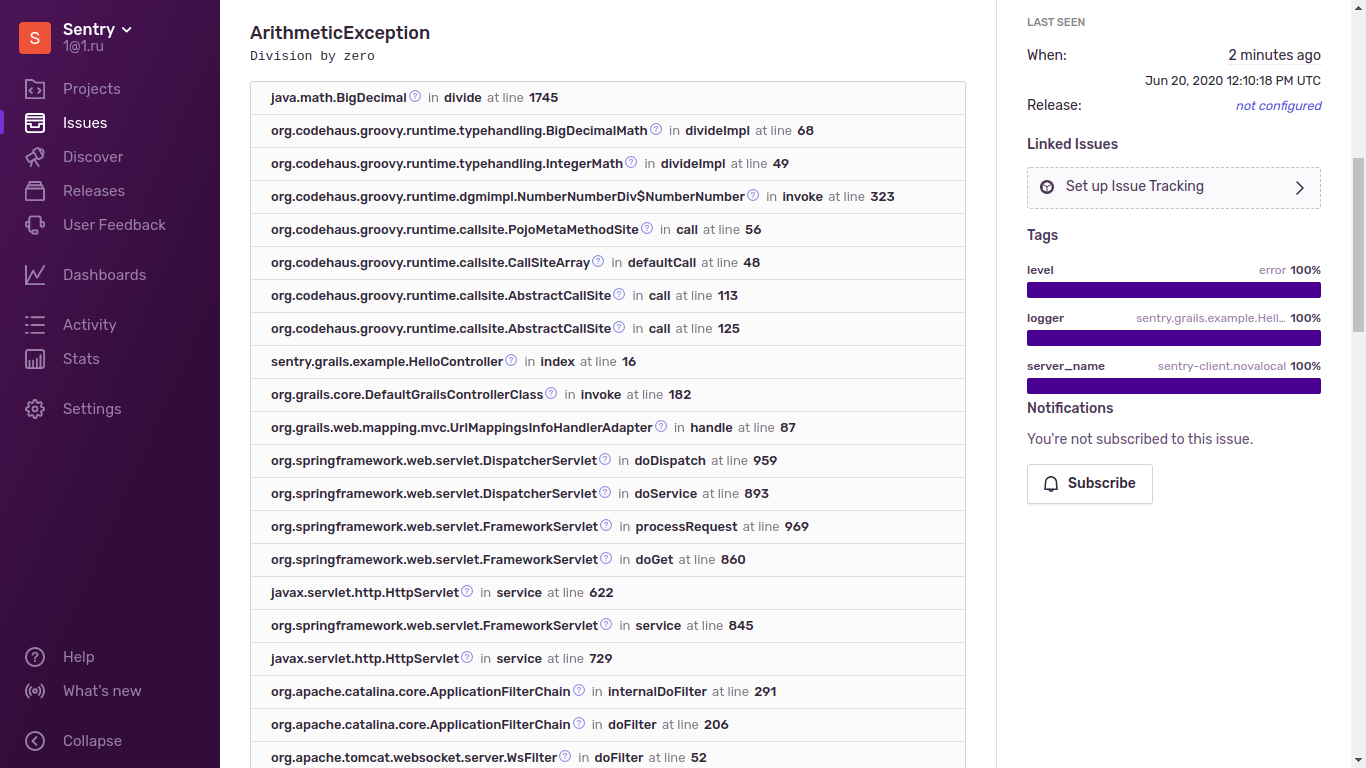
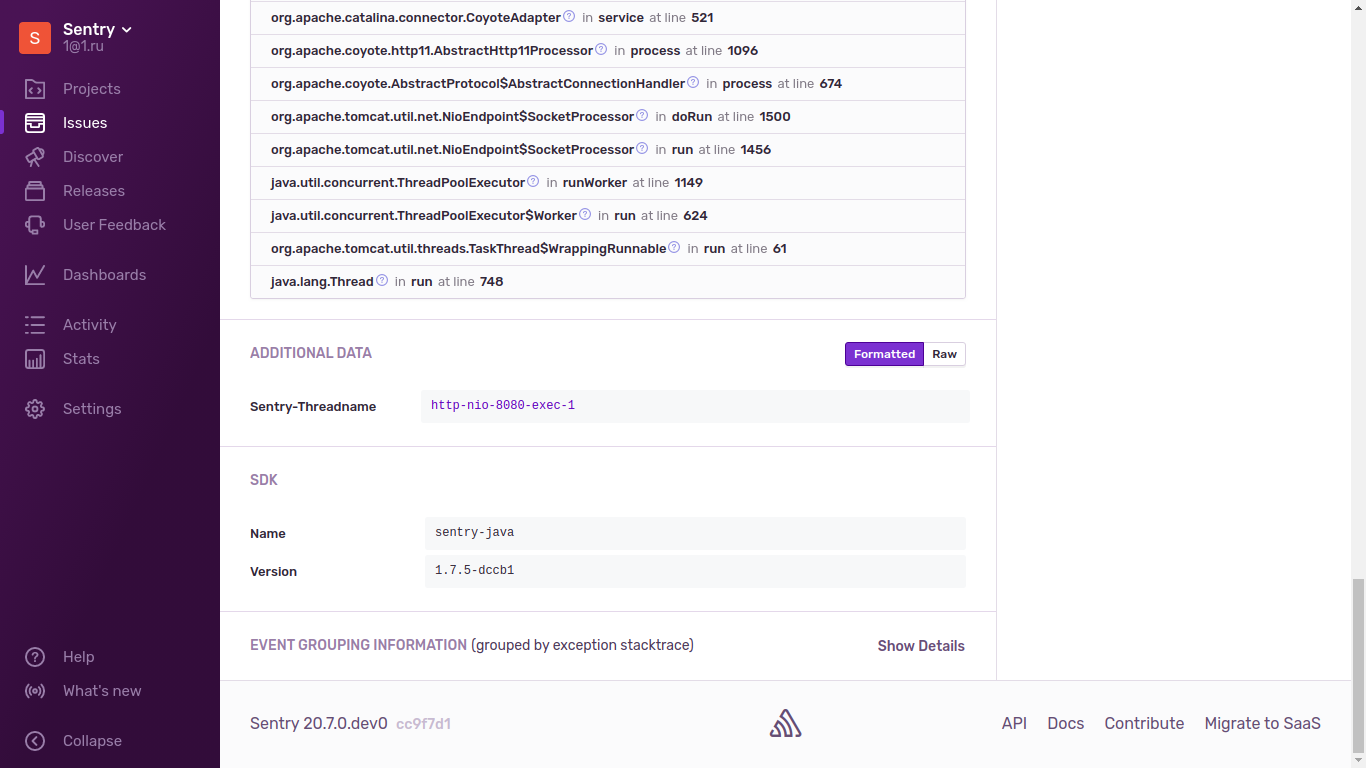
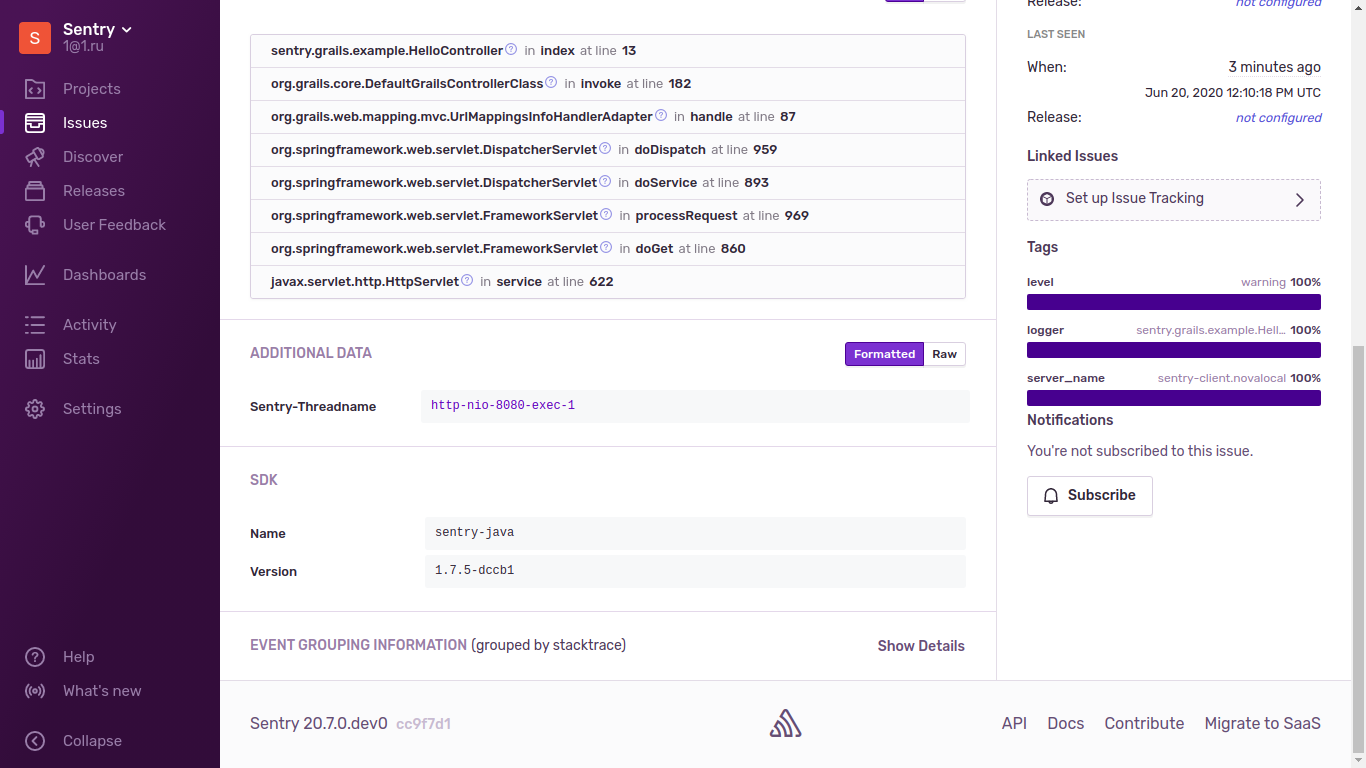
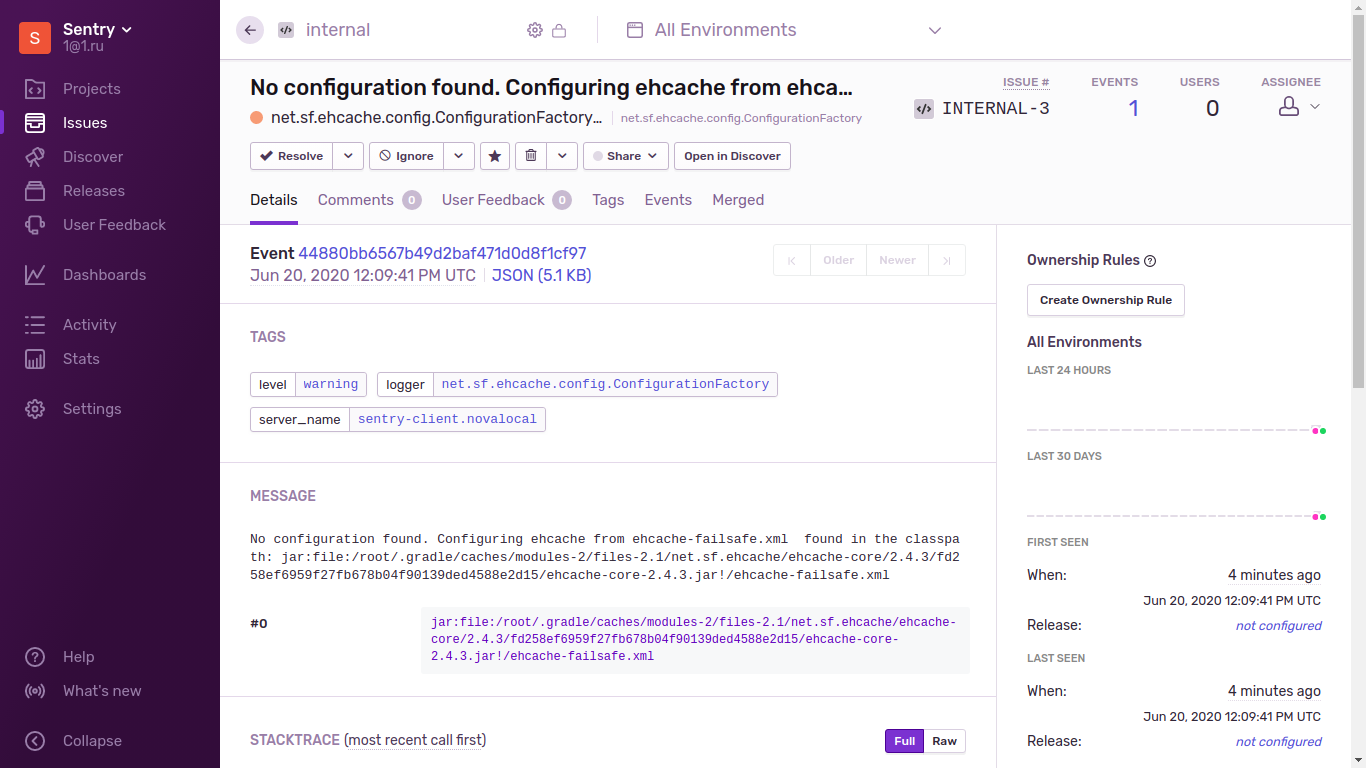
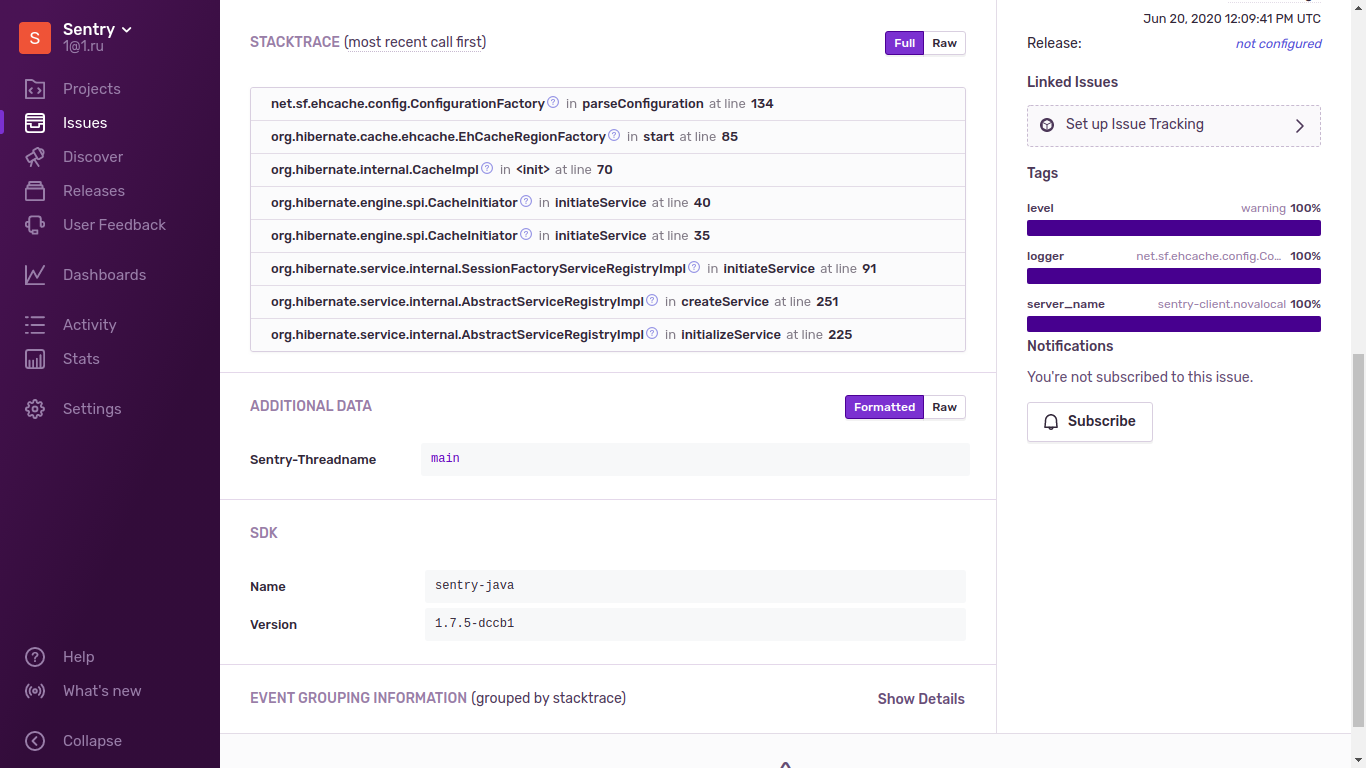
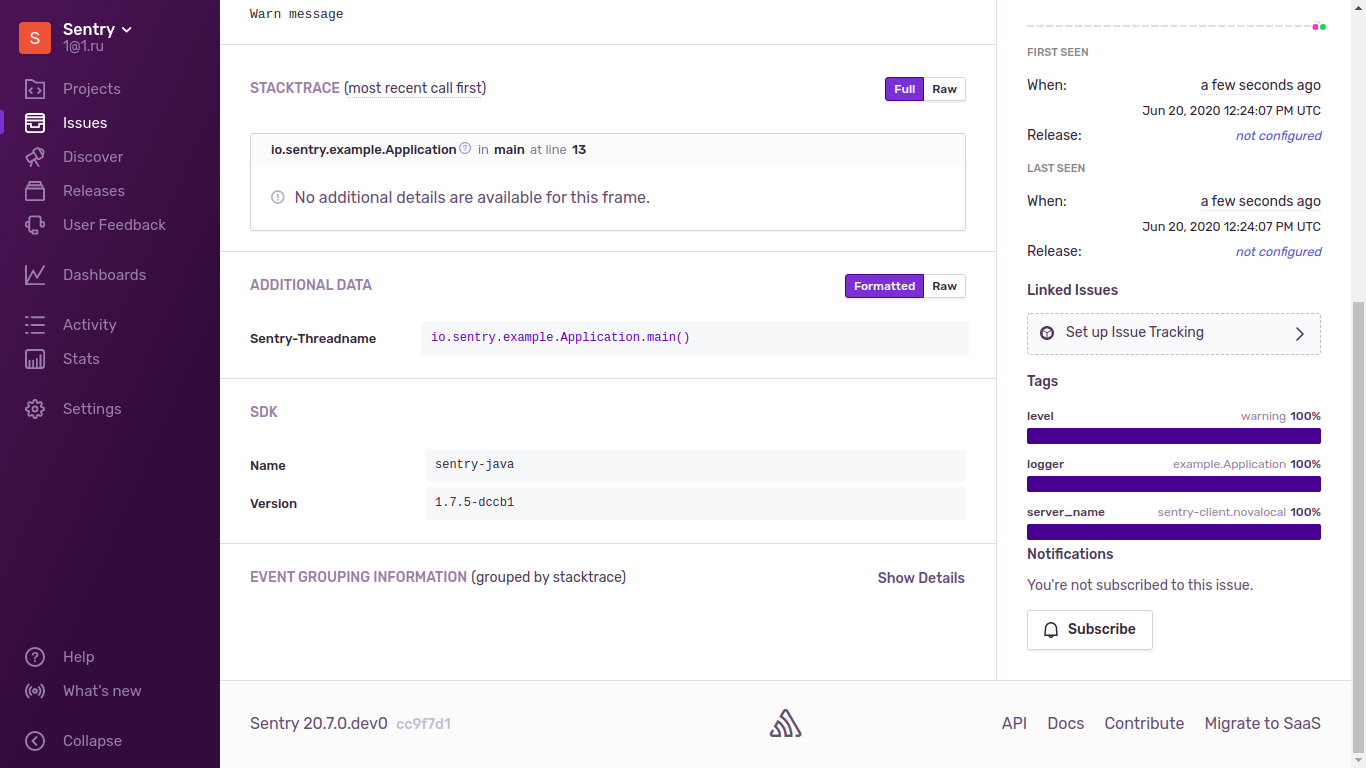
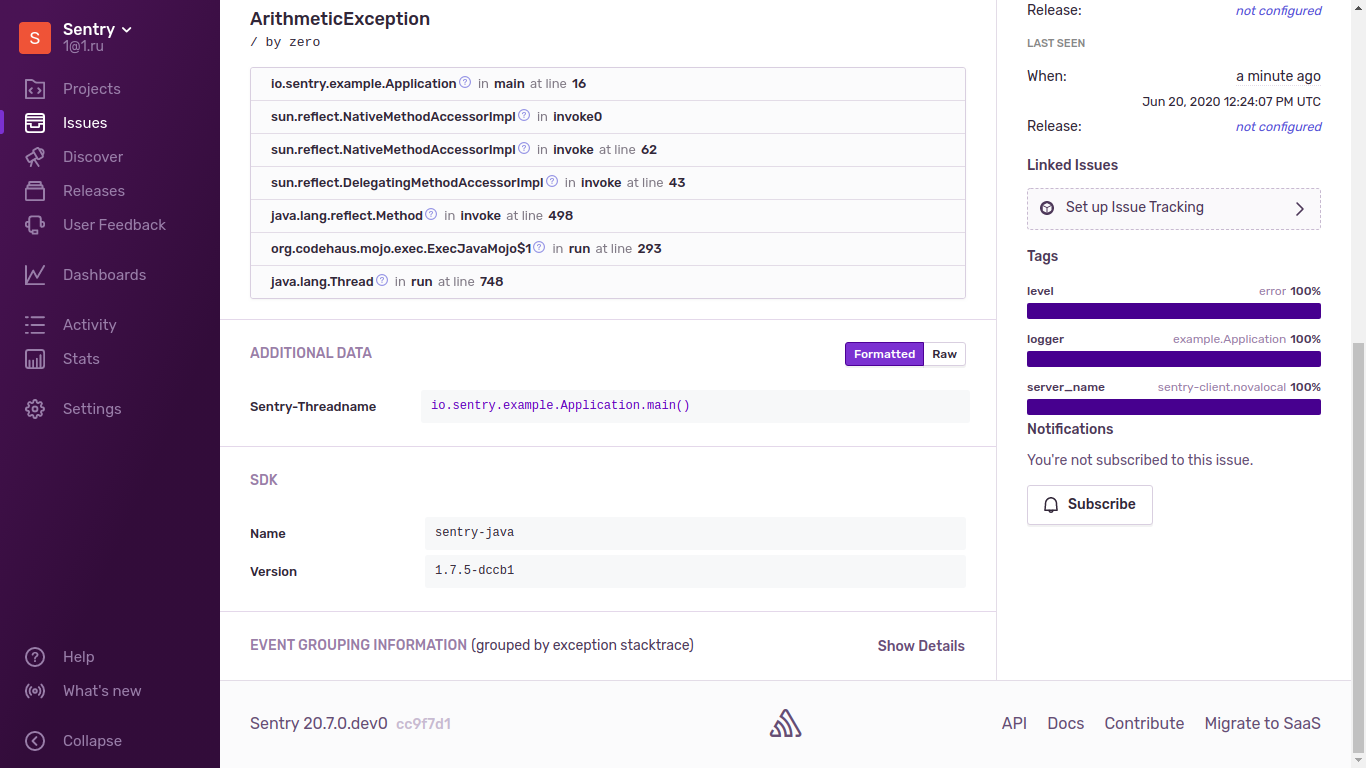
Как выглядят exception в Sentry

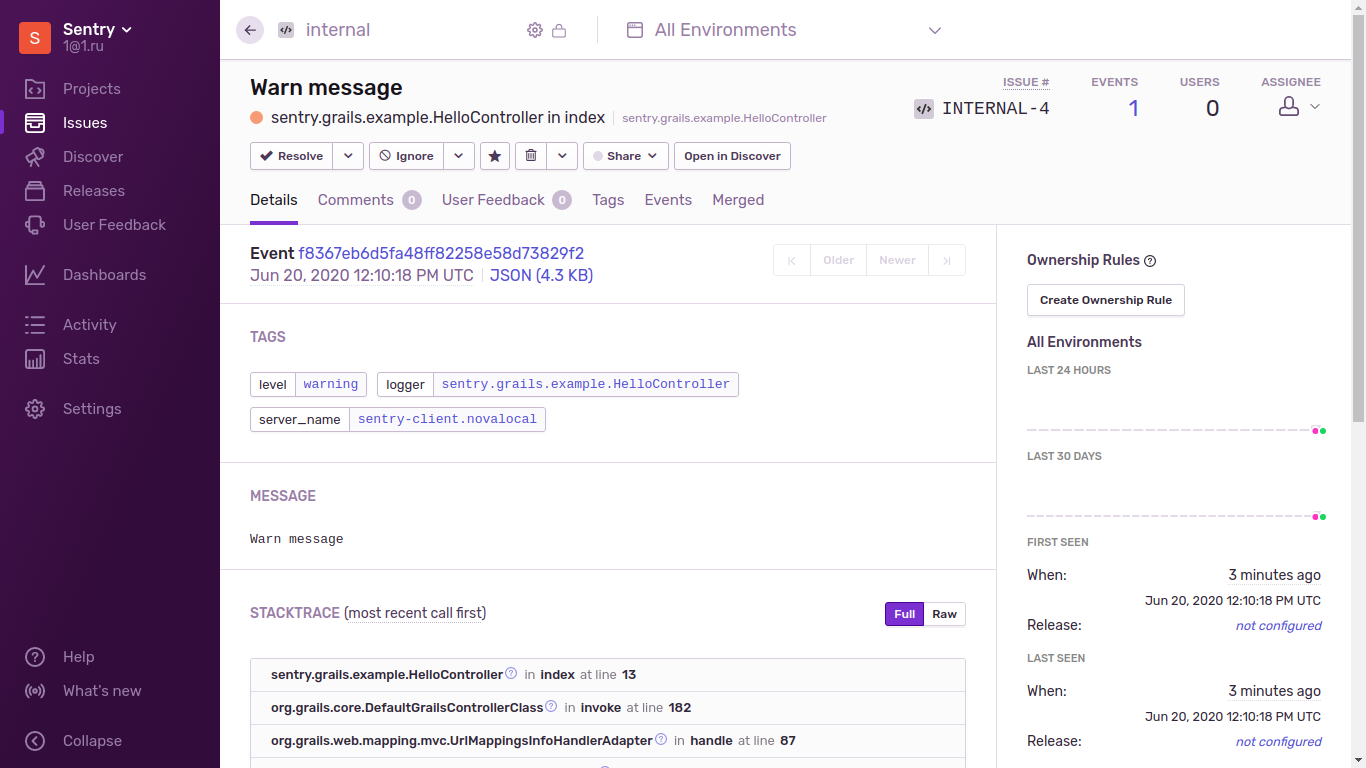
Запустим приложение несколько раз:
SENTRY_DSN=http://31bc93d7d64e4fd6b2e77d6d7780be6c@172.26.10.64:9000/1 grails run-appВидно что счетчик EVENTS для этого конкретного exception увеличился.
Sentry java.util.logging Example
Переходим к https://github.com/getsentry/examples/tree/master/java/java.util.logging
Собираем пакет JAR
mvn clean packageЗапускаем JAR
SENTRY_DSN=http://31bc93d7d64e4fd6b2e77d6d7780be6c@172.26.10.64:9000/1 \
java \
-Djava.util.logging.config.file=src/main/resources/logging.properties \
-cp ./target/sentry-java-jul-example-1.0-SNAPSHOT-jar-with-dependencies.jar \
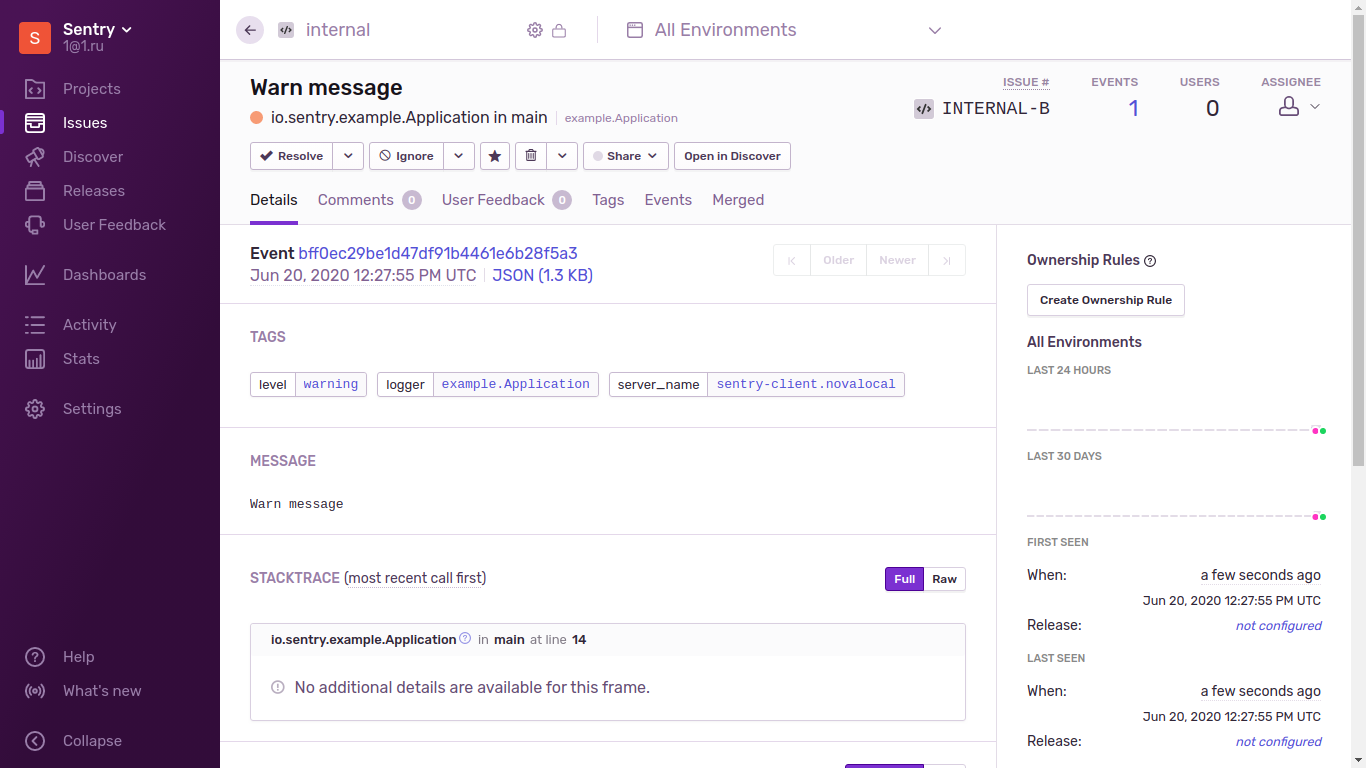
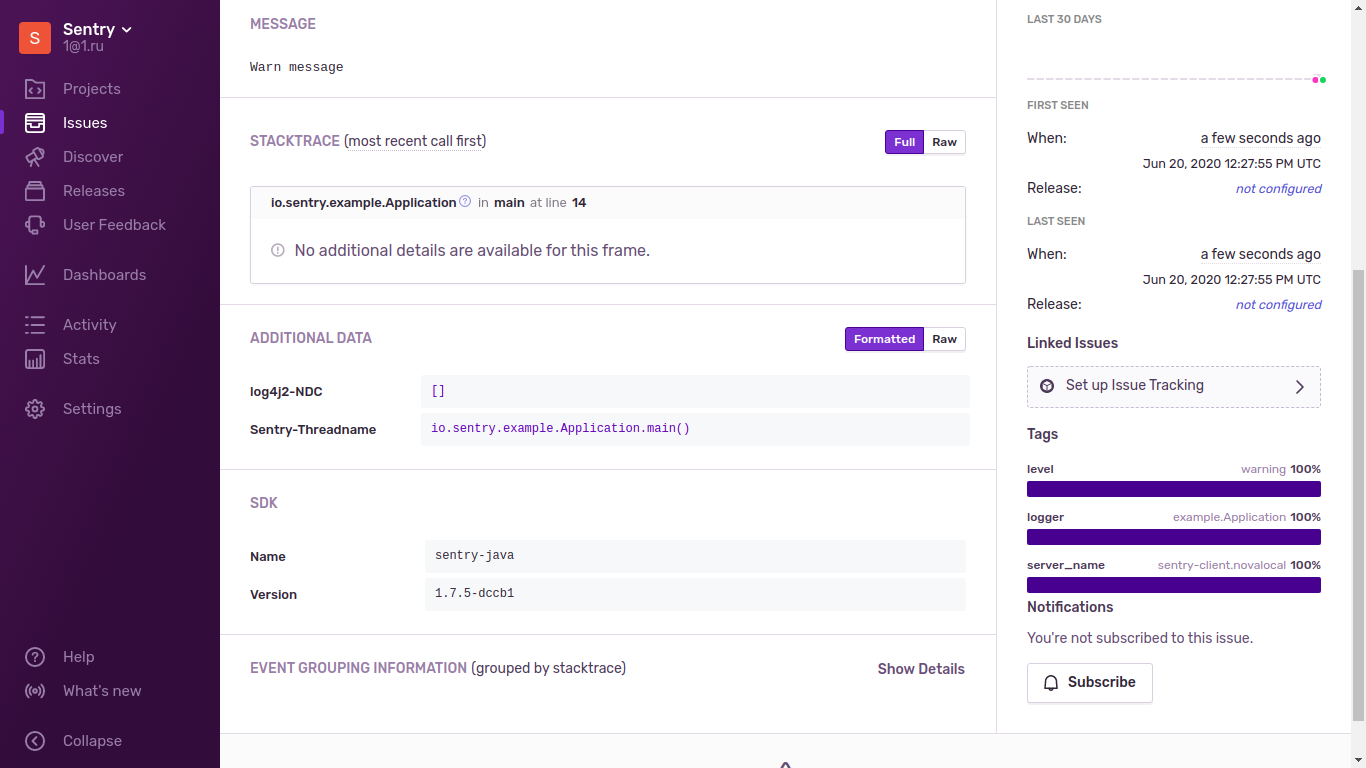
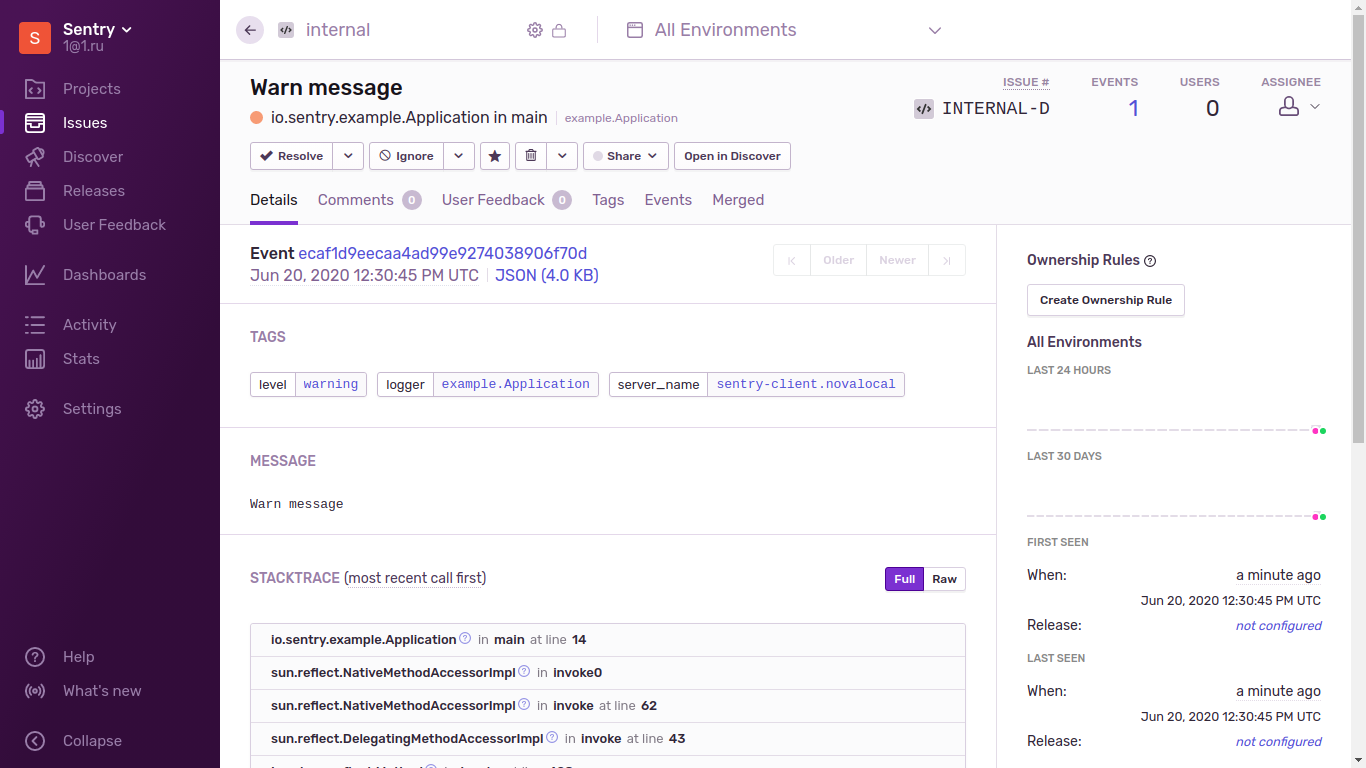
io.sentry.example.ApplicationКак выглядят exception в Sentry
Sentry Log4j 1.x Example
Переходим к https://github.com/getsentry/examples/tree/master/java/log4j-1.x
Компилируем
mvn compile exec:javaЗапускаем
SENTRY_DSN=http://31bc93d7d64e4fd6b2e77d6d7780be6c@172.26.10.64:9000/1 mvn exec:javaКак выглядят exception в Sentry


Sentry Log4j 2.x Example
Переходим к https://github.com/getsentry/examples/tree/master/java/log4j-2.x
Компилируем
mvn compile exec:javaЗапускаем
SENTRY_DSN=http://31bc93d7d64e4fd6b2e77d6d7780be6c@172.26.10.64:9000/1 mvn exec:javaКак выглядят exception в Sentry

Sentry Logback Example
Переходим к https://github.com/getsentry/examples/tree/master/java/logback
Компилируем
mvn compile exec:javaЗапускаем
SENTRY_DSN=http://31bc93d7d64e4fd6b2e77d6d7780be6c@172.26.10.64:9000/1 mvn exec:javaКак выглядят exception в Sentry


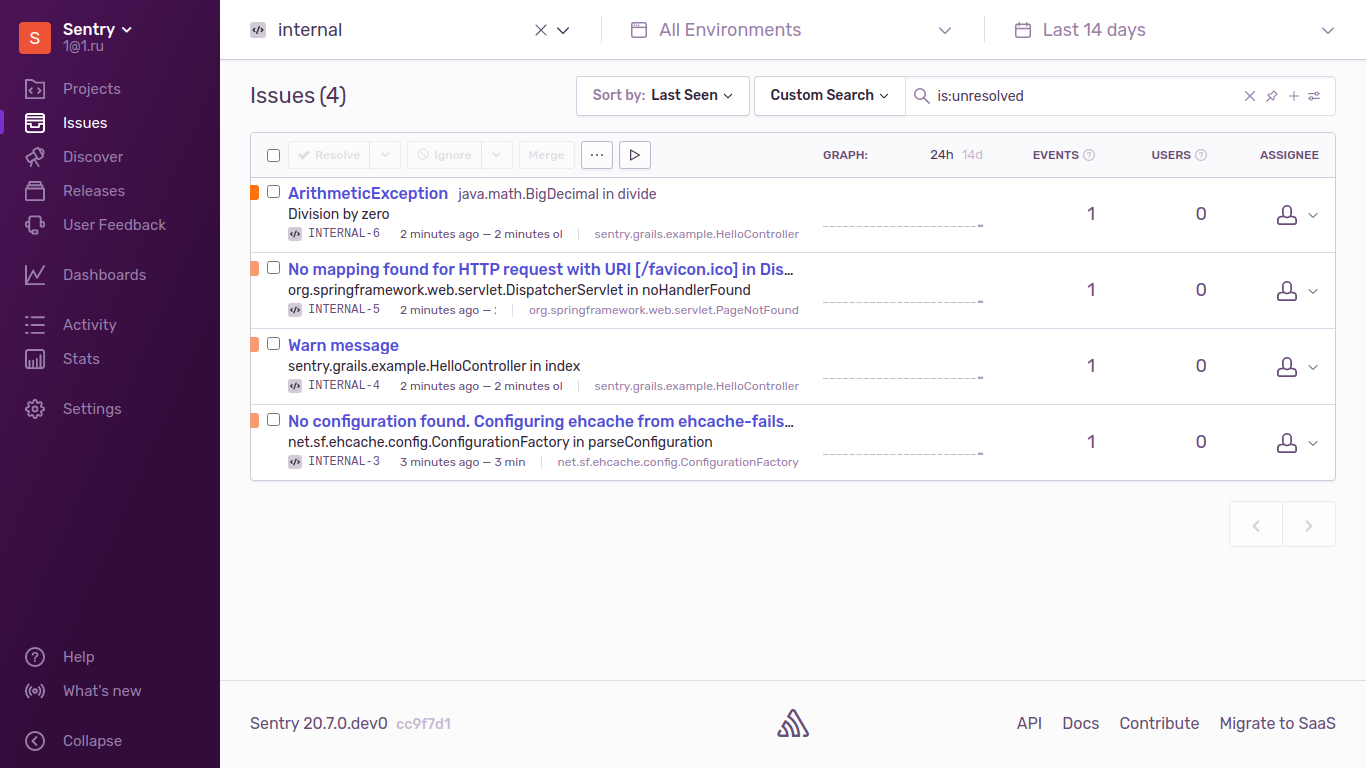
Sentry Spring Boot Example
Переходим к https://github.com/getsentry/examples/tree/master/java/spring-boot
Запускаем
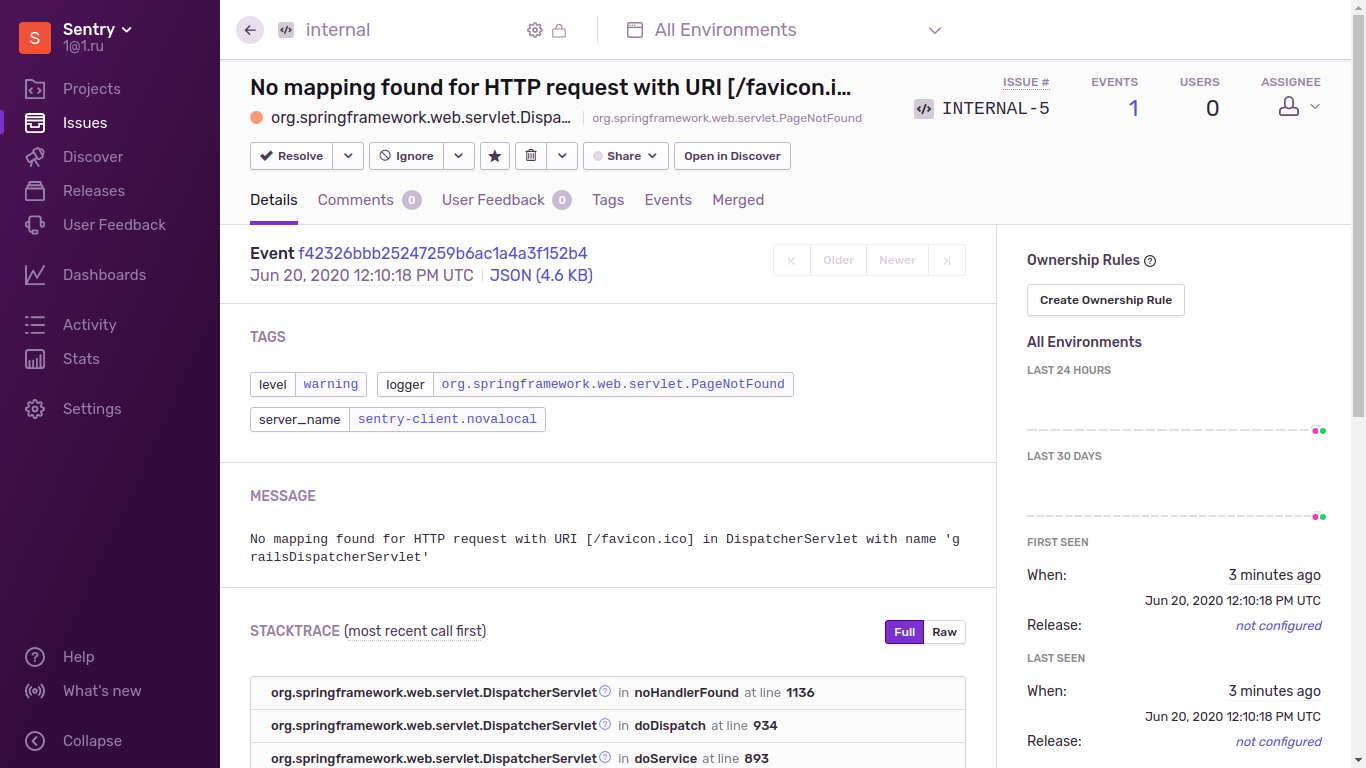
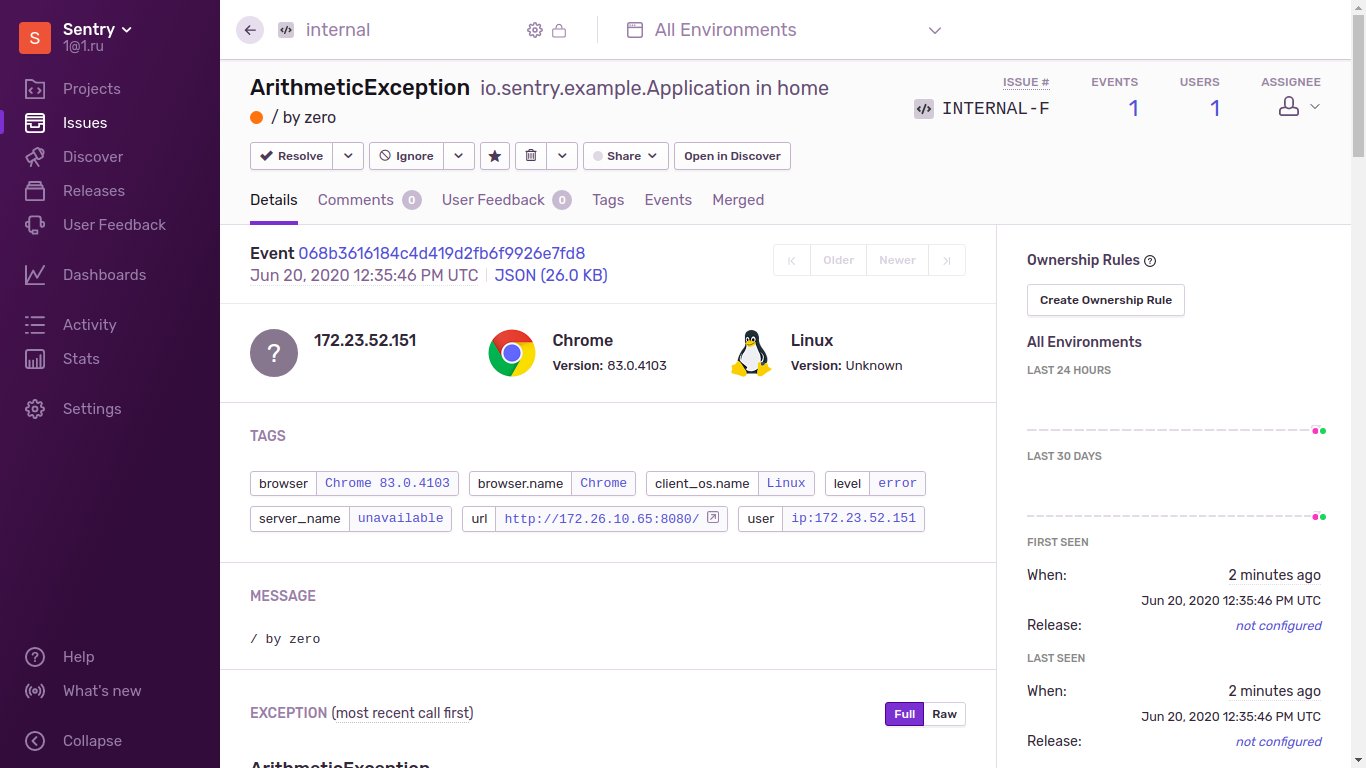
SENTRY_DSN=http://31bc93d7d64e4fd6b2e77d6d7780be6c@172.26.10.64:9000/1 mvn spring-boot:runОткрываем в браузере http://localhost:8080/ и exception отправляются в Sentry
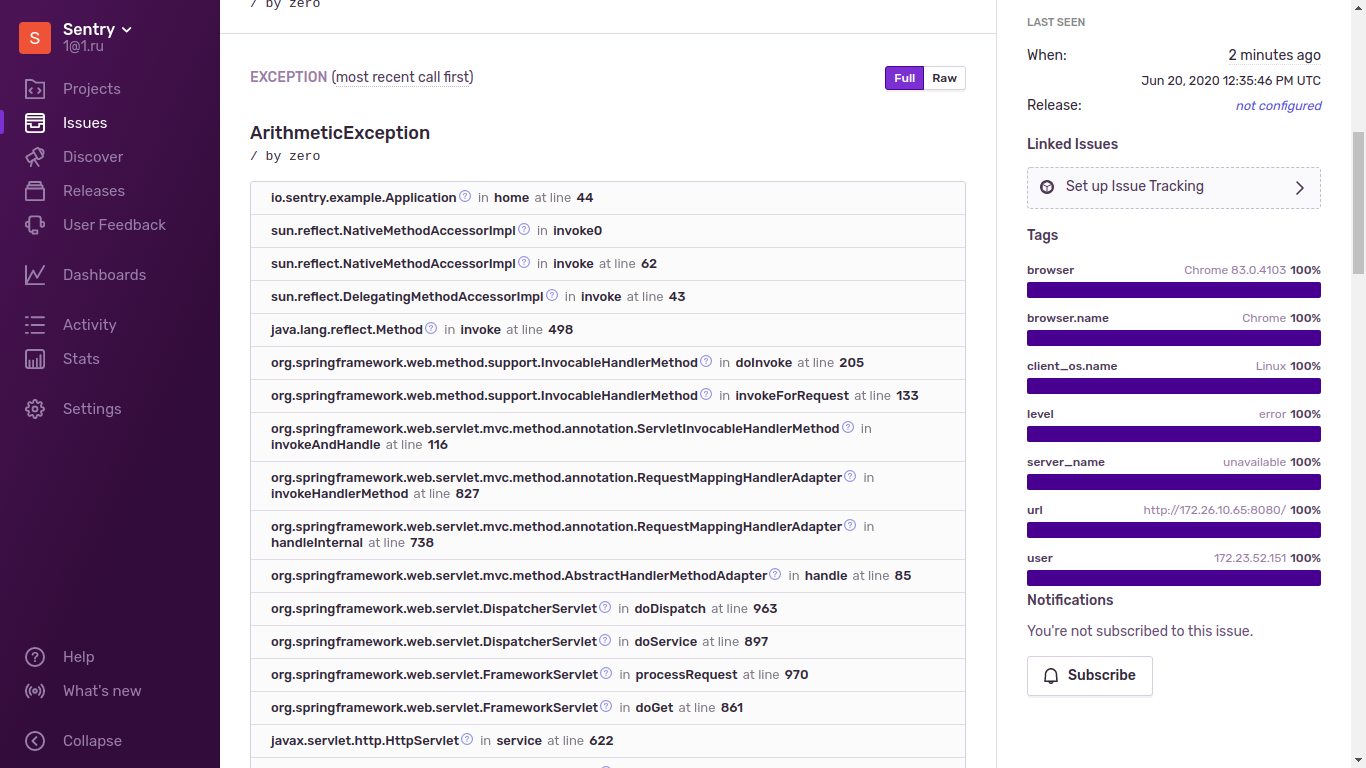
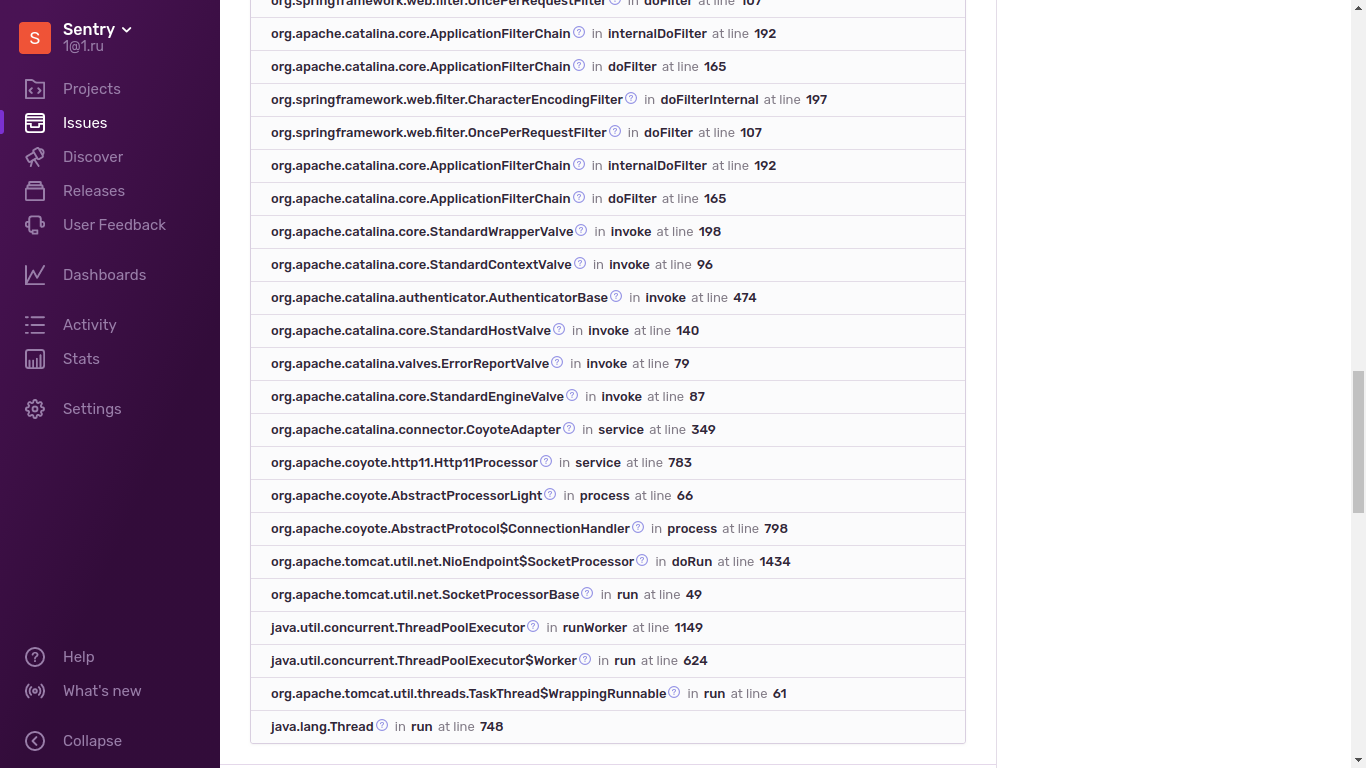
В логах мы видим
2020-06-20 12:35:47.249 ERROR 13939 --- [nio-8080-exec-1] o.a.c.c.C.[.[.[/].[dispatcherServlet]    : Servlet.service() for servlet [dispatcherServlet] in context with path [] threw exception [Request processing failed; nested exception is java.lang.ArithmeticException: / by zero] with root cause

java.lang.ArithmeticException: / by zero
    at io.sentry.example.Application.home(Application.java:44) ~[classes/:na]
    at sun.reflect.NativeMethodAccessorImpl.invoke0(Native Method) ~[na:1.8.0_252]
    at sun.reflect.NativeMethodAccessorImpl.invoke(NativeMethodAccessorImpl.java:62) ~[na:1.8.0_252]
    at sun.reflect.DelegatingMethodAccessorImpl.invoke(DelegatingMethodAccessorImpl.java:43) ~[na:1.8.0_252]
    at java.lang.reflect.Method.invoke(Method.java:498) ~[na:1.8.0_252]
    at org.springframework.web.method.support.InvocableHandlerMethod.doInvoke(InvocableHandlerMethod.java:205) ~[spring-web-4.3.7.RELEASE.jar:4.3.7.RELEASE]
    at org.springframework.web.method.support.InvocableHandlerMethod.invokeForRequest(InvocableHandlerMethod.java:133) ~[spring-web-4.3.7.RELEASE.jar:4.3.7.RELEASE]
    at org.springframework.web.servlet.mvc.method.annotation.ServletInvocableHandlerMethod.invokeAndHandle(ServletInvocableHandlerMethod.java:116) ~[spring-webmvc-4.3.7.RELEASE.jar:4.3.7.RELEASE]
    at org.springframework.web.servlet.mvc.method.annotation.RequestMappingHandlerAdapter.invokeHandlerMethod(RequestMappingHandlerAdapter.java:827) ~[spring-webmvc-4.3.7.RELEASE.jar:4.3.7.RELEASE]
    at org.springframework.web.servlet.mvc.method.annotation.RequestMappingHandlerAdapter.handleInternal(RequestMappingHandlerAdapter.java:738) ~[spring-webmvc-4.3.7.RELEASE.jar:4.3.7.RELEASE]
    at org.springframework.web.servlet.mvc.method.AbstractHandlerMethodAdapter.handle(AbstractHandlerMethodAdapter.java:85) ~[spring-webmvc-4.3.7.RELEASE.jar:4.3.7.RELEASE]
    at org.springframework.web.servlet.DispatcherServlet.doDispatch(DispatcherServlet.java:963) ~[spring-webmvc-4.3.7.RELEASE.jar:4.3.7.RELEASE]
    at org.springframework.web.servlet.DispatcherServlet.doService(DispatcherServlet.java:897) ~[spring-webmvc-4.3.7.RELEASE.jar:4.3.7.RELEASE]
    at org.springframework.web.servlet.FrameworkServlet.processRequest(FrameworkServlet.java:970) ~[spring-webmvc-4.3.7.RELEASE.jar:4.3.7.RELEASE]
    at org.springframework.web.servlet.FrameworkServlet.doGet(FrameworkServlet.java:861) ~[spring-webmvc-4.3.7.RELEASE.jar:4.3.7.RELEASE]
    at javax.servlet.http.HttpServlet.service(HttpServlet.java:622) ~[tomcat-embed-core-8.5.11.jar:8.5.11]
    at org.springframework.web.servlet.FrameworkServlet.service(FrameworkServlet.java:846) ~[spring-webmvc-4.3.7.RELEASE.jar:4.3.7.RELEASE]
    at javax.servlet.http.HttpServlet.service(HttpServlet.java:729) ~[tomcat-embed-core-8.5.11.jar:8.5.11]
    at org.apache.catalina.core.ApplicationFilterChain.internalDoFilter(ApplicationFilterChain.java:230) ~[tomcat-embed-core-8.5.11.jar:8.5.11]
    at org.apache.catalina.core.ApplicationFilterChain.doFilter(ApplicationFilterChain.java:165) ~[tomcat-embed-core-8.5.11.jar:8.5.11]
    at org.apache.tomcat.websocket.server.WsFilter.doFilter(WsFilter.java:52) ~[tomcat-embed-websocket-8.5.11.jar:8.5.11]
    at org.apache.catalina.core.ApplicationFilterChain.internalDoFilter(ApplicationFilterChain.java:192) ~[tomcat-embed-core-8.5.11.jar:8.5.11]
    at org.apache.catalina.core.ApplicationFilterChain.doFilter(ApplicationFilterChain.java:165) ~[tomcat-embed-core-8.5.11.jar:8.5.11]
    at org.springframework.web.filter.RequestContextFilter.doFilterInternal(RequestContextFilter.java:99) ~[spring-web-4.3.7.RELEASE.jar:4.3.7.RELEASE]
    at org.springframework.web.filter.OncePerRequestFilter.doFilter(OncePerRequestFilter.java:107) ~[spring-web-4.3.7.RELEASE.jar:4.3.7.RELEASE]
    at org.apache.catalina.core.ApplicationFilterChain.internalDoFilter(ApplicationFilterChain.java:192) ~[tomcat-embed-core-8.5.11.jar:8.5.11]
    at org.apache.catalina.core.ApplicationFilterChain.doFilter(ApplicationFilterChain.java:165) ~[tomcat-embed-core-8.5.11.jar:8.5.11]
    at org.springframework.web.filter.HttpPutFormContentFilter.doFilterInternal(HttpPutFormContentFilter.java:105) ~[spring-web-4.3.7.RELEASE.jar:4.3.7.RELEASE]
    at org.springframework.web.filter.OncePerRequestFilter.doFilter(OncePerRequestFilter.java:107) ~[spring-web-4.3.7.RELEASE.jar:4.3.7.RELEASE]
    at org.apache.catalina.core.ApplicationFilterChain.internalDoFilter(ApplicationFilterChain.java:192) ~[tomcat-embed-core-8.5.11.jar:8.5.11]
    at org.apache.catalina.core.ApplicationFilterChain.doFilter(ApplicationFilterChain.java:165) ~[tomcat-embed-core-8.5.11.jar:8.5.11]
    at org.springframework.web.filter.HiddenHttpMethodFilter.doFilterInternal(HiddenHttpMethodFilter.java:81) ~[spring-web-4.3.7.RELEASE.jar:4.3.7.RELEASE]
    at org.springframework.web.filter.OncePerRequestFilter.doFilter(OncePerRequestFilter.java:107) ~[spring-web-4.3.7.RELEASE.jar:4.3.7.RELEASE]
    at org.apache.catalina.core.ApplicationFilterChain.internalDoFilter(ApplicationFilterChain.java:192) ~[tomcat-embed-core-8.5.11.jar:8.5.11]
    at org.apache.catalina.core.ApplicationFilterChain.doFilter(ApplicationFilterChain.java:165) ~[tomcat-embed-core-8.5.11.jar:8.5.11]
    at org.springframework.web.filter.CharacterEncodingFilter.doFilterInternal(CharacterEncodingFilter.java:197) ~[spring-web-4.3.7.RELEASE.jar:4.3.7.RELEASE]
    at org.springframework.web.filter.OncePerRequestFilter.doFilter(OncePerRequestFilter.java:107) ~[spring-web-4.3.7.RELEASE.jar:4.3.7.RELEASE]
    at org.apache.catalina.core.ApplicationFilterChain.internalDoFilter(ApplicationFilterChain.java:192) ~[tomcat-embed-core-8.5.11.jar:8.5.11]
    at org.apache.catalina.core.ApplicationFilterChain.doFilter(ApplicationFilterChain.java:165) ~[tomcat-embed-core-8.5.11.jar:8.5.11]
    at org.apache.catalina.core.StandardWrapperValve.invoke(StandardWrapperValve.java:198) ~[tomcat-embed-core-8.5.11.jar:8.5.11]
    at org.apache.catalina.core.StandardContextValve.invoke(StandardContextValve.java:96) [tomcat-embed-core-8.5.11.jar:8.5.11]
    at org.apache.catalina.authenticator.AuthenticatorBase.invoke(AuthenticatorBase.java:474) [tomcat-embed-core-8.5.11.jar:8.5.11]
    at org.apache.catalina.core.StandardHostValve.invoke(StandardHostValve.java:140) [tomcat-embed-core-8.5.11.jar:8.5.11]
    at org.apache.catalina.valves.ErrorReportValve.invoke(ErrorReportValve.java:79) [tomcat-embed-core-8.5.11.jar:8.5.11]
    at org.apache.catalina.core.StandardEngineValve.invoke(StandardEngineValve.java:87) [tomcat-embed-core-8.5.11.jar:8.5.11]
    at org.apache.catalina.connector.CoyoteAdapter.service(CoyoteAdapter.java:349) [tomcat-embed-core-8.5.11.jar:8.5.11]
    at org.apache.coyote.http11.Http11Processor.service(Http11Processor.java:783) [tomcat-embed-core-8.5.11.jar:8.5.11]
    at org.apache.coyote.AbstractProcessorLight.process(AbstractProcessorLight.java:66) [tomcat-embed-core-8.5.11.jar:8.5.11]
    at org.apache.coyote.AbstractProtocol$ConnectionHandler.process(AbstractProtocol.java:798) [tomcat-embed-core-8.5.11.jar:8.5.11]
    at org.apache.tomcat.util.net.NioEndpoint$SocketProcessor.doRun(NioEndpoint.java:1434) [tomcat-embed-core-8.5.11.jar:8.5.11]
    at org.apache.tomcat.util.net.SocketProcessorBase.run(SocketProcessorBase.java:49) [tomcat-embed-core-8.5.11.jar:8.5.11]
    at java.util.concurrent.ThreadPoolExecutor.runWorker(ThreadPoolExecutor.java:1149) [na:1.8.0_252]
    at java.util.concurrent.ThreadPoolExecutor$Worker.run(ThreadPoolExecutor.java:624) [na:1.8.0_252]
    at org.apache.tomcat.util.threads.TaskThread$WrappingRunnable.run(TaskThread.java:61) [tomcat-embed-core-8.5.11.jar:8.5.11]
    at java.lang.Thread.run(Thread.java:748) [na:1.8.0_252]
В http://localhost:8080/ мы видим:

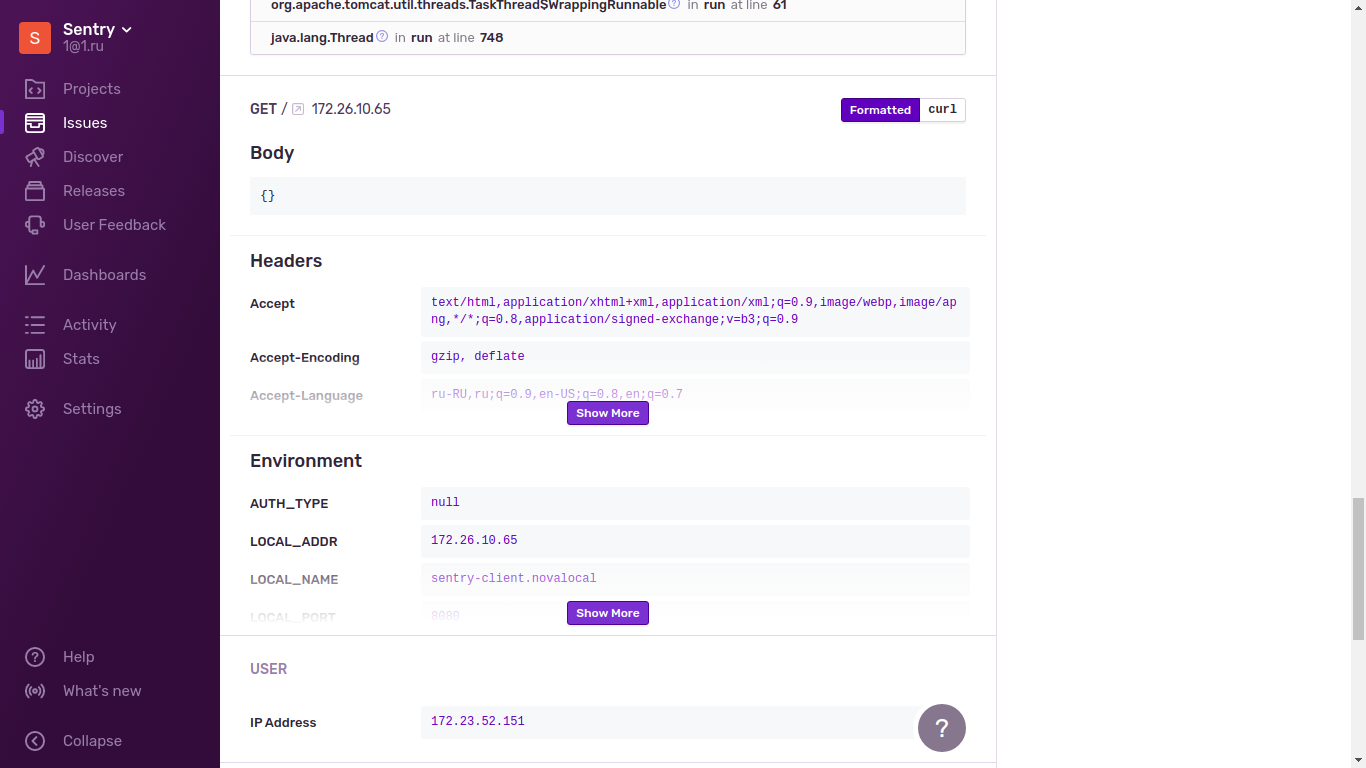
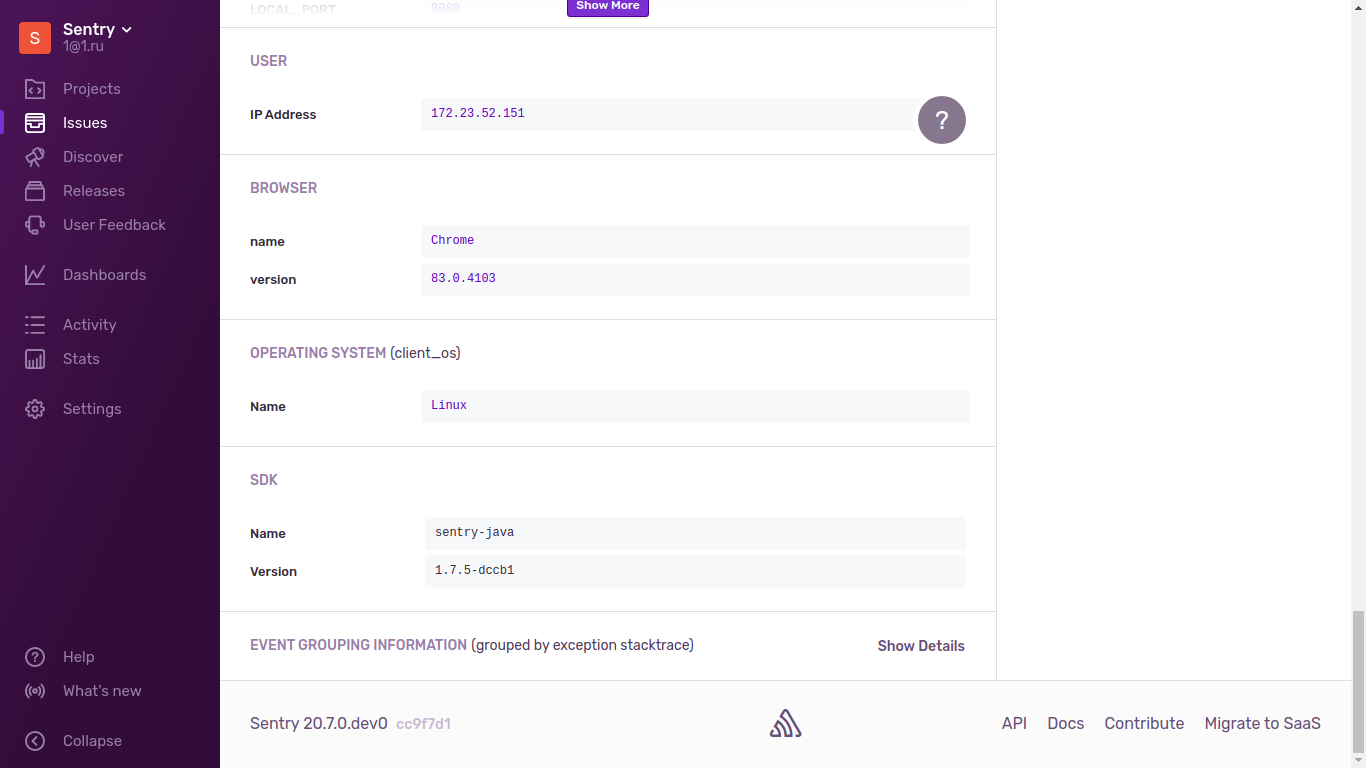
Как выглядят exception в Sentry
Телеграм чат по Sentry https://t.me/sentry_ru
Только зарегистрированные пользователи могут участвовать в опросе. Войдите, пожалуйста.
Используете ли вы трекинг exception, как например Sentry?
24.39%
Да, использую локальный вариант
10
19.51%
Да, использую облачный вариант
8
17.07%
Да, планирую ипользовать
7
17.07%
Нет, я думал Sentry платный и только в облаке
7
19.51%
Нет, мне хватает логов в Kibana
8
19.51%
Нет, я не знал о трекинге exception как направление
8
Проголосовал 41 пользователь.
Воздержались 9 пользователей.
Только зарегистрированные пользователи могут участвовать в опросе. Войдите, пожалуйста.
Попробуете ли вы трекинг exception Sentry?
83.87%
Да, мне это интересно
26
12.9%
Нет, мне хватает логов в Kibana
4
3.23%
Я не понял как подключать Sentry SDK к своему коду
1
Проголосовал 31 пользователь.
Воздержались 13 пользователей.
Search code, repositories, users, issues, pull requests…
Provide feedback
Saved searches
Use saved searches to filter your results more quickly
Sign up
-
Главная
-
Инструкции
-
Серверы
-
Sentry: мониторинг и отслеживание ошибок
О проекте
Sentry — это платформа для отслеживания ошибок и мониторинга приложений. Данные, которые мы получаем в Sentry, содержат исчерпывающую информацию о контексте, в котором это произошло, что облегчает воспроизведение и поиск причины и значительно помогает в устранении ошибок. Хороший друг для разработчиков, тестировщиков и DevOps.
Это open-source проект, который можно развернуть и использовать на своем или облачном сервере.
Sentry начинался как web для отображения trace — exception в удобной форме и с группировкой по типу. С течением времени он разрастался дополнительными функциями, возможностями, интеграциями. Полностью показать и рассказать, на что он способен, в одной статье не получится, и даже краткий видеообзор займет часа три.
- Официальный сайт
- Документация
- GitHub
Зачем Sentry, когда есть логирование?
Просмотреть логи и узнать, что происходит с сервисом, — хорошо. Когда логи со всех сервисов собираются в одном месте, как Elastiс, OpenSearch, Loki — отлично.
Но анализировать ошибки и исключения можно быстрее, удобнее и подробнее как раз в Sentry. Бывают случаи, когда анализ логов не помогает понять проблему, а Sentry спасает.
Могут быть и другие ситуации, когда пользователь вашего сервиса не смог войти в учетку, купить товар или сделать что-то еще, и не стал писать тикет в саппорт, а просто ушел.
В логах такое выявить крайне сложно. И даже если в саппорт оставили обращение о проблеме, проанализировать, выявить и воспроизвести такую специфическую ошибку может дорого стоить:
- С какого устройства и каким браузером пользовались?
- Какая функция и из-за чего вызвала ошибку? Какую ошибку?
- Какие данные были на фронте, что отправилось в бэк?
- …
Самое главная «фишка» Sentry — предоставление в удобной форме подробной контекстной информации об ошибках, что позволяет быстрее реагировать и улучшать разработку.
Как заявляют разработчики проекта на своем сайте, «ваш код скажет вам больше, чем то, что показывают логи. Полный мониторинг стека Sentry покажет более полную картину того, что происходит в коде сервиса, и поможет выявлять проблемы до того, как они приведут к простою».
Как это работает?
В коде своего приложения мы устанавливаем DSN (URL) своей платформы, куда будут отправляться отчеты (ошибки, исключения, логи). При желании можно расширять, дорабатывать, скрывать (маскировать) отправляемые данные.
Поддерживаемые платформы и языки
Продукт поддерживает JavaScript, Node, Python, PHP, Ruby, Java и другие языки программирования.
Форма добавления проекта
На скриншоте видно, что есть как просто Python-проект, так и Django, Flask, FastAPI, в котором уже за нас в более удобной и детальной форме используются данные для отправки отчетов.
Варианты использования
Sentry может использоваться в следующих вариантах:
- Self-hosted (поднятый на своем сервере)
- Облачный (есть ограниченная бесплатная версия и платные с ежемесячной оплатой)
Developer — бесплатная облачная версия для знакомства
Лимиты версии Developer:
Тем, кого заинтересовал Sentry, я рекомендую попробовать хотя бы бесплатную облачную версию, она вполне подойдет для знакомства, а еще лучше — вариант на собственном сервере, т.к. задержки в ошибках облачной версии могут быть от 1 до 5 мин., что не очень удобно.
Установка self-hosted версии
Теперь перейдем к технической части. Для развертывания нам нужен репозиторий getsentry/self-hosted. Платформа будет развернута в docker-compose.
Системные требования
- Docker 19.03.6+
- Compose 2.0.1+
- 4 CPU Cores
- 8 GB RAM
- 20 GB Free Disk Space
Для демонстрации я буду использовать виртуальную машину от Timeweb Cloud с Ubuntu 22.04.
Подготовка
Обновляем зависимости:
apt update && apt upgrade -yУстанавливаем необходимые пакеты.
Для Docker apt предлагает версию 20.10.24, установим ее.
apt install docker.ioДля docker-compose — apt предлагает установить версию 1.29.2-1. Она не сходится с требуемой, поэтому стандартная установка не подойдет. Потребуется устанавливать вручную с официального репозитория.
Получим последнюю версию в переменную:
VERSION=$(curl --silent https://api.github.com/repos/docker/compose/releases/latest | grep -Po '"tag_name": "\K.*\d')Осталось скачать по указанному пути и выдать права:
DESTINATION=/usr/bin/docker-composesudo curl -L https://github.com/docker/compose/releases/download/${VERSION}/docker-compose-$(uname -s)-$(uname -m) -o $DESTINATIONsudo chmod 755 $DESTINATIONПроверим:
docker-compose --versionВывод:
Docker Compose version v2.20.3
Установка
Разработчики Sentry максимально упростили установку с помощью скрипта.
Выбираем и клонируем репозиторий и релизную ветку:
git clone https://github.com/getsentry/self-hosted.git
git checkout 23.8.0
cd self-hosted
Установка:
./install.sh --skip-user-prompt --no-report-self-hosted-issuesФлаги:
--skip-user-prompt— пропустить запрос создания пользователя (создадим его отдельной командой, так будет проще).--no-report-self-hosted-issues— пропустить запрос для анонимной отправки данных разработчикам Sentry с вашего хоста (помогает разработчикам улучшать продукт, но немного отъедает ресурсов; решите для себя, нужно ли вам это).
Начинается процесс проверки соответствия требованиям и скачивание необходимых образов (docker pull).
После будет выведено сообщение, что можно запустить Sentry:
You're all done! Run the following command to get Sentry running:
docker-compose up -d
Запустим:
docker-compose up -dИ теперь уже по IP-адресу хоста по порту 9000 доступен веб-интерфейс.
Но мы пропустили создание пользователя. Сделаем это сейчас с помощью команды:
docker-compose run --rm web createuserВводим email, пароль и отвечаем на вопрос: Давать ли права суперпользователя этому пользователю?
При первом входе откроется окно первоначальной настройки, где можно указать URL, настройки почтового сервера для отправки писем, и разрешить самостоятельную регистрацию остальным пользователям.
На этом в целом Sentry готов к работе, подробнее про конфигурацию можно почитать тут.
Основные файлы конфигурации:
.envself-hosted/sentry/config.ymlself-hosted/sentry/sentry.conf.py
По умолчанию поднимается 42 контейнера, и в конфигах есть что настроить.
Сразу возникает вопрос: зачем столько контейнеров? Можно ли убрать лишнее и собрать минимальную сборку?
Нет, на данный момент нельзя — из-за сложных архитектурных связей.
В .env—файл добавляю переменную SENTRY_BEACON = False. Она позволяет разработчикам собирать приватную статистику для улучшения продукта, я хочу ее отключить.
Срок хранения событий можно также изменить здесь, по умолчанию он равен 90 дням:
SENTRY_EVENT_RETENTION_DAYS=90 Данные проектов и учетные записи пользователей хранятся в PostgreSQL. Можно легко поменять в конфигах на свою DB, а также использовать свой Redis.
Осталось самостоятельно настроить HTTPS proxy для доступа к web-интерфейсу. В документации нет конкретных указаний, рекомендуют использовать любой reverse proxy на ваше усмотрение. После настройки обратного прокси-сервера, нужно будет изменить system.url-prefix в файле config.yml и обновить раздел SSL/TLS в sentry/sentry.conf.py.
Настройка и подключение первого проекта
Создание проекта
Нажимаем «Добавить новый проект» и выбираем платформу.
После этого для проекта генерируется его уникальный ID, который нужно будет использовать в приложении.
Обратите внимание на переменную traces_sample_rate=1.0 и комментарии от разработчиков. Чтобы не перезагружать платформу тысячами однотипных ошибок, рекомендуется настроить данную переменную. При указании 1.0 будут отправляться 100% всех событий, а, например, при 0.25 — 25%.
О дополнительных параметрах sentry_sdk можно почитать в документации. На скрине выше показан пример использования.
Мы немного усложним пример из документации, добавив зависимые функции и свой Exception.
import sentry_sdksentry_sdk.init(
dsn="http://979bc0c738a5e4d8b4709e50247035c7@sentry.akmalov.com:9000/3", # Ссылка DSN с ID=3 получаем при создании проекта
traces_sample_rate=1.0,
environment="production", # Возможность добавить среду выполнения
release="my-app-1.0.0", # Релизная версия приложения
send_default_pii=True,
)
class MyException(Exception):
pass
def my_function(user, email):
raise MyException(f"User {user} ({email}) encountered an error.")
def create_user():
print("Создадим пользователя")
my_function('Artur', 'artur@akmalov.com')
if __name__ == "__main__":
sentry_sdk.capture_message("Просто захотелось отправить сообщение")
create_user()
Запускаю скрипт:
python main.pyВ результате в Sentry получаем следующее:
Новый issue
В тэгах отображаются переменная среды, версия релиза и даже имя сервера (hostname):
На скрине видно подробную трассировку и переходы по функциям из скрипта, а также переменные, которые в них использовались:
И даже версии используемых пакетов:
Итоги
В этой статье мы рассмотрели, что такое Sentry и для чего ее использовать. Надеюсь, мне удалось заинтересовать вас ею достаточно, чтобы вы почитали документацию или попробовали Sentry в работе.
Несмотря на то, что это громоздкая платформа, ее легко установить и настроить. Самое главное — не забывать следить, закрывать, группировать и гибко настраивать события, чтобы не получилось хаоса, и тогда Sentry станет очень полезным и удобным инструментом для команды разработки.
In a production environment, it would be great to get an instant alert if any error occurred in your application. If you are part of a big team, then it would be ideal that the alert will be passed on to the right person to resolve the issue.
Imagin if some error occurred in your application on the production environment and then you have to go through the large file of error logs to find what actually happened at a given time for a particular user (happened to me so many times). It would be ideal to browse through the error history of your application right within your browser.
That’s where the Sentry comes into play. Sentry is a cloud-based error tracking tool that comes with free and paid subscriptions. You can browse through the full list of features on their website at Sentry.io. One of the coolest features of Sentry is the fact that it’s super easy to integrate into your application. So let’s get started.
Installation
Firstly, you’ll need to register an account on the Sentry website (the free plan will be enough to get you started) and create a project. The process of creating a project is very easy, even there is an option for Laravel projects which will tailor the documentation according to your project. Once you have done that, come back here!
I will be using the latest release of Laravel which is ^8.0. To create a new Laravel application, I will use the composer create-project command.
composer create-project laravel/laravel laravel-sentry
Sentry can be integrated into Laravel application using the native package sentry-laravel. We will now install this package using the composer.
composer require sentry/sentry-laravel
Once the package is installed, we will need to generate the config file for this package using the below command.
php artisan vendor:publish --provider="Sentry\Laravel\ServiceProvider"
When you create a new account on the Sentry website, you will be given a DSN string which is like an API key, if you haven’t copied it yet, you can grab it from the settings area. Next, we will add that key to our .env file.
SENTRY_LARAVEL_DSN=https://[email protected]/0000000
Where xxxxx and 0000000 will be equivlent to your keys from Sentry.
Sentry documentation for Laravel will advise you to hook into Laravel error capturing via an Exception handler.
I always set up the Sentry using the log channel so will recommend you follow this approach as it will be more reliable.
To use the log channel, you will need to add a new channel to your config/logging.php configuration file.
'channels' => [
    // ...
    'sentry' => [
        'driver' => 'sentry',
        'level'  => null,
        'bubble' => true,
    ],
],
You can see two extra configuration values in the above code snippet, level and bubble.
The level, allows you to control the minimum error level that will be sent to the sentry. Laravel uses Monolog for handling errors, so you can take a look at the available levels in their documentation.
The bubble allows/prevents errors from being reported to other channels after the error being handled by Sentry.
Configuring Channel
To configure your application to use the Sentry as a log channel, simply change the LOG_CHANNEL value to below.
LOG_CHANNEL=sentry
From now on all errors will be logged to Sentry.
In my application, I like to use the stack option which will enable our application to log errors to multiple channels. I usually use the daily and sentry as my stack because I firstly like to log errors to a local file and then send it to Sentry. This enables me to keep track of errors in a log file and it will be never missed.
So for my above approach, update the .env file to below.
LOG_CHANNEL=stack
and in the config/logging.php file update the stack channel as below.
    'channels' => [
        'stack' => [
            'driver'   => 'stack',
            'channels' => ['daily', 'sentry']
        ],
        'daily' => [
            'driver' => 'daily',
            'path'   => storage_path('logs/laravel.log'),
            'level'  => 'debug',
            'days'   => 28,
        ],
        'sentry' => [
            'driver' => 'sentry',
            'level'  => 'debug',
            'bubble' => true,
        ],
    ...
],
Testing Error Logging
By now we have integrated the Sentry into our application, now we will test if everything is set up properly. For this, the Sentry package provides a nice command for testing the integration.
In your console run the below command.
php artisan sentry:test
If everything is set up properly, you will see an output like below.
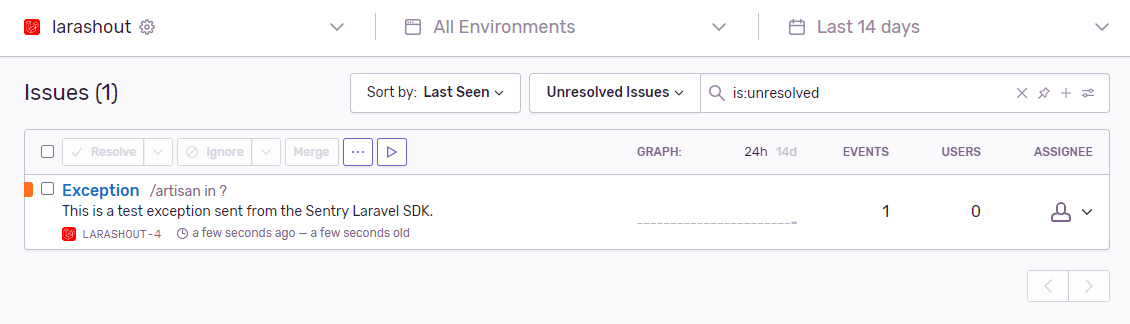
[Sentry] DSN discovered!
[Sentry] Generating test Event
[Sentry] Sending test Event
[Sentry] Event sent with ID: 31e6f44928284d67b891bf4b5415fbbb
You will also see an issue will be added to your Sentry dashboard on the Sentry website for this test.
We can also test it by throwing an exception, For example, add the below route in your routes/web.php file and visit the route in the browser.
Route::get('/sentry-test', function () {
    throw new \Exception("Sentry Test Exception");
});
You will receive an email alert if you have set up that in the Sentry account area and will also see it on the Sentry dashboard like below.

Adding User Context to Error Logs
If you have spent some time on Sentry or are already using it, you will have noticed that Sentry provides a lot of information about your application.
It would be nice to know which error occurred for which user so we can reach the users to inform them that error has been resolved.
To add which user was active at the time of the error, we will need to create a middleware to pass current user information to Sentry.
Run the below command to generate a middleware class.
php artisan make:middleware SentryUser
This will generate a middleware class at app/Http/Middleware.
Open the newly created class and replace it with the below content.
namespace App\Http\Middleware;

    use Auth;
    use Closure;
    use Sentry\State\Scope;

    class SentryUser
    {
        /**
         * Handle an incoming request.
         *
         * @param \Illuminate\Http\Request $request
         * @param \Closure                 $next
         *
         * @return mixed
         */
        public function handle($request, Closure $next)
        {
            if(Auth::check() && app()->bound('sentry'))
            {
                \Sentry\configureScope(function (Scope $scope): void {
                    $scope->setUser([
                        'id'    => Auth::user()->id,
                        'email' => Auth::user()->email,
                        'name'  => Auth::user()->name,
                    ]);
                });
            }

            return $next($request);
        }
    }
The pretty easy stuff is happening in this middleware class, firstly we check if there is a user authenticated and Sentry is available from the Laravel container. Then, we simply pass the details of the current logged in user to Sentry. The array can be altered according to your need to pass any additional information to Sentry.
Now to use this middleware, we will need to register this middleware in your Laravel application, open the app/Http/Kernel.php file and add it to the $middlewareGroups array like below.
protected $middlewareGroups = [
    'web' => [
        // ...
        \App\Http\Middleware\SentryUser::class
    ]
];
Now when an error is logged with Sentry and a user is authenticated, you should see the user information displayed with the error details in your Sentry dashboard.
Final Words
Hopefully, this post will help you to integrate the Sentry into your application for better error logging and log alerts. Sentry offers so many features such as release tracking, detailed control over notifications, removing sensitive data captured by Sentry (known as data scrubbing), etc. – check out the documentation for more details.
Introduction
I’m going to assume you’re already familiar with the Laravel PHP framework and the basics of error logging. Whilst the framework does come with plenty of options out the box for how and where to log errors, if you’re using one of the simple file or system based channels (as defined via your config/logging.php / .env files), you could be doing something better.
Wouldn’t it be great to get an instant alert when there is a problem with your web app? If you work in a team, surely it would be even better for that alert to go straight to the right person to resolve the issue?
Are you fed up reading through long log files to try and trace the cause of an issue? Imagine being able to browse your complete history of errors from a user-friendly web based UI with all the supporting data you need.
This is where Sentry comes in. It’s a cloud based error tracking tool (with free and paid plans) — visit the website to learn more about the full set of features. One of which is the fact it’s super easy to integrate with Laravel, so let’s get started:
Installation
I’m assuming you’re using Laravel 5.6 (which supports various log channels) or above and that you are using package discovery. At the time of writing, everything also works in the current latest version (5.8).
First up, you’ll of course need to register for an account with Sentry (the free plan will be enough to get you started) and create a project. This is an easy process, and there is even an option for a Laravel project (which tailors their documentation to your project). Once you’ve done that, come back here!
You’ll need to install their Laravel package to your project via Composer:
composer require sentry/sentry-laravel
Next up, we’ll need up publish the Sentry Laravel config file by running:
php artisan vendor:publish --provider="Sentry\Laravel\ServiceProvider"
When you created your project in Sentry, you will have been given a DSN string (this is like an API key), if you haven’t already copied it, you should be able to find it in the settings area. You’ll need to add that to your .env file e.g:
SENTRY_LARAVEL_DSN=https://xxxxx@sentry.io/0000000
Whilst the current Sentry Laravel documentation recommends starting by hooking into Laravel to capture errors via the Exception handler, there is a better way — using log channels. To start, you’ll need to add a new channel in your config/logging.php file:
'channels' => [
    // ...
    'sentry' => [
        'driver' => 'sentry',
        'level'  => null,
        'bubble' => true,
    ],
],
Aside from «driver», you’ll notice two other options in the channel config.
There first, «level», allows you to control the minimum error level that will be sent to Sentry. Laravel uses Monolog for handling errors, so you can take a look at the available levels in their documentation.
The second, «bubble», is useful when working with the stack driver to allow / prevent errors being reported to other channels after being handled by Sentry.
Configuring channels
You’ll now need to configure your application to use the new «sentry» error logging channel. The first option (called «default») in your config/logging.php file defines which logging channel is used, and is probably pointing to the LOG_CHANNEL option in your .env file. You can easily change this to sentry (LOG_CHANNEL=sentry) and all your errors will now be logged with Sentry.
However, I like to use the «stack» channel, which allows errors to be logged with multiple channels. I usually like to use both the «daily» and «sentry» channels in my stack. This provides some redundancy — by logging to a local file first, errors won’t be totally lost if their is ever an issue reporting to Sentry. To follow my approach, you should update your .env file to contain:
LOG_CHANNEL=stack
And your config/logging.php should contain:
'default' => env('LOG_CHANNEL', 'stack'),
// ...
'channels' => [
'stack' => [
    'driver'   => 'stack',
    'channels' => ['daily', 'sentry']
],
'daily' => [
    'driver' => 'daily',
    'path'   => storage_path('logs/laravel.log'),
    'level'  => 'debug',
    'days'   => 28,
],
'sentry' => [
    'driver' => 'sentry',
    'level'  => 'debug',
    'bubble' => true,
],
Don’t forget to take a read over the Laravel logging documentation to fully understand everything that is happening above, and to see the full range of configuration options.
Time for a test
The Sentry Laravel package comes with a handy artisan command for testing your integration:
php artisan sentry:test
After you run this, you should receive an email alert (depending on your settings in Sentry) and be able to see it in your Sentry dashboard.
You can also test it by throwing an exception of your own. For example, you can add a simple route closure to your routes/web.php file, then visit it in your browser:
Route::get('/debug-sentry', function () {
throw new \Exception("My test Exception");
Again, you should receive an email alert and see the exception logged in your Sentry dashboard.
Adding user context
As you’ve probably seen, Sentry provides a lot of detailed information for errors including a full stack trace and some environment details. But imagine knowing which errors have occurred for which users. You could reach out to them to let the problem has been fixed, even if they didn’t report the issue.
To tell Sentry which user was active at the time, you’ll need to create some custom middleware:
php artisan make:middleware SentryUserContext
And then add the following to the newly created app/Http/Middleware/SentryUserContext.php file:
namespace App\Http\Middleware;
use Auth;
use Closure;
use Sentry\State\Scope;
class SentryUserContext
{
/**
* Handle an incoming request.
*
* @param \Illuminate\Http\Request $request
* @param \Closure                 $next
*
* @return mixed
*/
public function handle($request, Closure $next)
{
if(Auth::check() && app()->bound('sentry'))
{
\Sentry\configureScope(function (Scope $scope): void {
$scope->setUser([
'id'    => Auth::user()->id,
'email' => Auth::user()->email,
'name'  => Auth::user()->name,
]);
});
}
    return $next($request);
}
You’ll then need to register the middleware against all of your routes. The easiest way to do this is to add it to the relevant sections (e.g. «web» and «api») in the $middlewareGroups property in your app/Http/Kernel.php file. For example:
protected $middlewareGroups = [
'web' => [
    // ...
    \App\Http\Middleware\SentryUserContext::class
]
There are several other ways of registering middleware, so check the Laravel documentation for middleware to see if there is a better approach for your particular application.
Let’s look back and explain what’s happening in the middleware — it’s pretty easy. First off we check that there is a user authenticated (in the default guard) and that Sentry is available from the container (this should have been done automatically through package discovery).
Then, we simply pass the details of the current user to Sentry — giving the ID, email and name. This array could be tailored to include other useful info relevant to your app (e.g. subscription package).
Now when an error is logged with Sentry and a user is authenticated with you app, you should see the user details displayed with the error details in your Sentry dashboard. There are more tools available in the dashboard, such us filtering your error list by user to see which errors they’ve experienced, but I’ll leave that for you to discover.
Further reading
Hopefully that’s enough to get you started with a better error logging setup for your Laravel application. There is so much more that Sentry can do for you (release tracking, detailed control over notifications, removing sensitive data captured by Sentry (known as data scrubbing) etc) — check out the documentation for more details.
If you need help with anything I’ve mentioned — feel free to get in contact.