Use Safari’s web developer tools to study problematic websites
Updated on September 30, 2022
What to Know
- Activate Web Inspector on iOS: Go to Settings > Safari > Advanced and move the Web Inspector toggle switch to the On position.
- Use Web Inspector on macOS: Connect your iOS device to a Mac and choose the URL to inspect from the Develop menu.
If you run into a bug or another issue with a website on Safari mobile, use the Web Inspector tool to investigate. This article explains how to use the Safari console for iPhone to debug errors with the help of your Mac computer. Instructions apply to iPhones with iOS 14, iOS 12, or iOS 11, and well as Macs with macOS Big Sur (11.0), macOS Catalina (10.15), or macOS Mojave (10.14).
Activate Web Inspector on Your iPhone or Other iOS Device
The Web Inspector is disabled by default since most iPhone users have no use for it. However, if you’re a developer or you’re curious, you can activate it in a few short steps. Here’s how:
-
Open the iPhone Settings menu.
On an iPhone with an early version of iOS, access the Debug Console through Settings > Safari > Developer > Debug Console. When Safari on the iPhone detects CSS, HTML, and JavaScript errors, details of each display in the debugger.
-
Scroll down and tap Safari to open the screen that contains everything related to the Safari web browser on your iPhone, iPad, or iPod touch.
-
Scroll to the bottom of the page and select Advanced.
-
Move the Web Inspector toggle switch to the On position.
Connect Your iOS Device to Safari on a Mac
To use the Web Inspector, connect your iPhone or another iOS device to a Mac that has the Safari web browser and enable the Develop menu.
-
With Safari open, select Safari from the menu bar and choose Preferences.
-
Select the Advanced tab.
-
Select the Show Develop menu in menu bar check box and close the settings window.
-
From the Safari menu bar, select Develop and choose the name of your attached iOS device, then select the URL that appears under Safari to open the debug console for that site.
After you connect your device, use your Mac to inspect the website you want to debug and have it open in the Safari mobile browser.
What Is Web Inspector?
Web developers use Web Inspector to modify, debug, and optimize websites on Macs and iOS devices. With Web Inspector open, developers can inspect the resources on a web page. The Web Inspector window contains editable HTML and notes regarding the styles and layers of the web page in a separate panel.
Before iOS 6, the iPhone Safari web browser had a built-in Debug Console that developers used to find web page defects. Recent versions of iOS use Web Inspector instead.
With Safari 9 and OS X Mavericks (10.9), Apple introduced Responsive Design Mode in Web Inspector. Developers use this built-in simulator to preview how web pages scale to different screen sizes, resolutions, and orientations.
FAQ
-
How do I use Web Inspector on my iPad?
To set up Web Inspector on your iPad, open your iPad’s Settings and select Safari > Advanced, then turn Web Inspector On. Connect the iPad to a Mac computer, then open Safari on the Mac and select Safari > Preferences > Advanced, then turn on Show Develop menu in menu bar.
-
Can I use Web Inspector on iOS with Windows Chrome?
You cannot just connect your iPhone to a Windows PC and start using Web Inspector through Chrome like you can with a Mac. Installing package manager software can provide you a sort of workaround, but it’s not recommended unless you’re familiar with the package management app you intend to use.
Thanks for letting us know!
Get the Latest Tech News Delivered Every Day
Subscribe
Каждый браузер оснащен консольной панелью, с помощью которой разработчики проводят тестирование веб-сайта. Вкладка Elements содержит всю информацию об инспектируемом HTML-файле: теги, таблицы стилей и т.д. Но в консоли есть и другие разделы, такие как Console, Sources, Network и прочие.
Для каких целей они используются и как можно выявить ошибки через консоль – поговорим в сегодняшней статье.
Как открыть консоль на разных браузерах
Алгоритм запуска консоли (инспектора) во всех браузерах идентичен. Есть два пути: первый – запуск через специальную клавишу на клавиатуре, второй – через функцию «Посмотреть код страницы/элемента».
Например, если воспользоваться в Chrome клавишей F12, то откроется дополнительное окно с консолью.
Второй путь заключается в просмотре кода текущей страницы – для этого необходимо кликнуть правой кнопкой мыши по любому элементу сайта и в отобразившемся меню выбрать опцию «Посмотреть код». Обратите внимание, что это название опции в Google Chrome, в других браузерах оно может отличаться. Например, в Яндексе функция называется «Исследовать элемент».
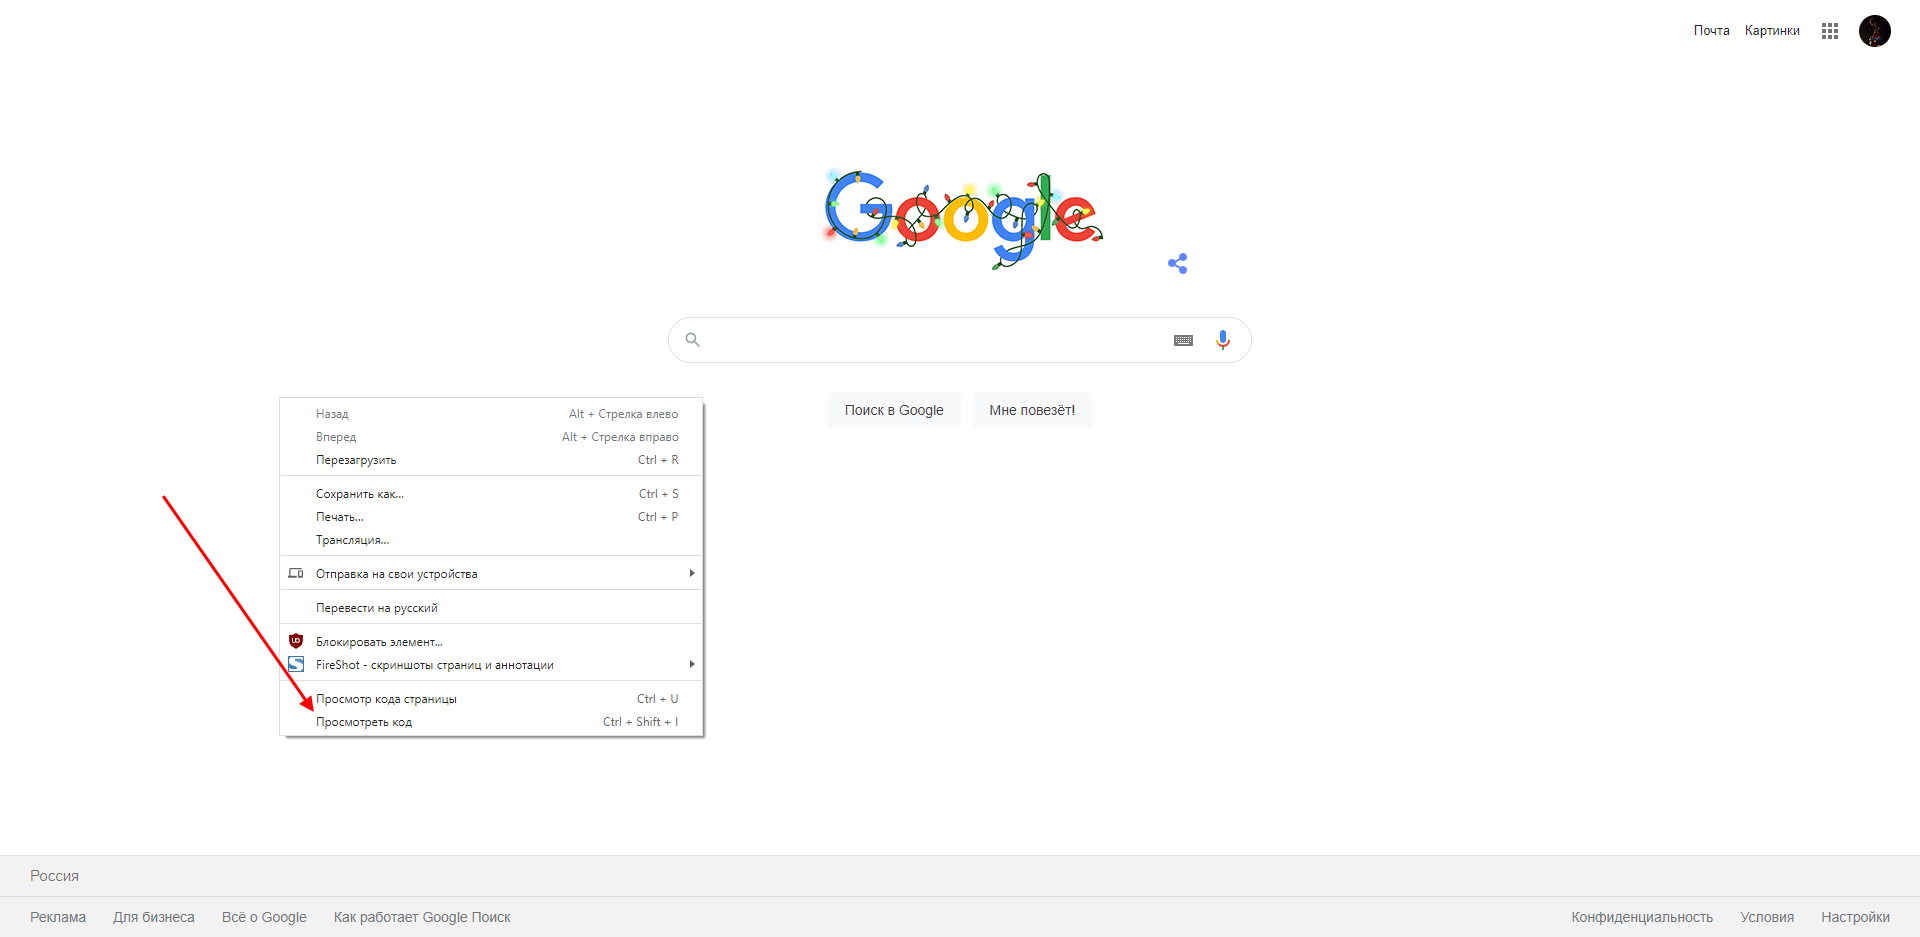
В результате перед нами снова отобразится окно, в котором будет открыта главная вкладка с кодом страницы. Подробнее о ней мы еще поговорим, а пока давайте посмотрим, как выполняется запуск консоли в браузере Safari на устройствах Mac.
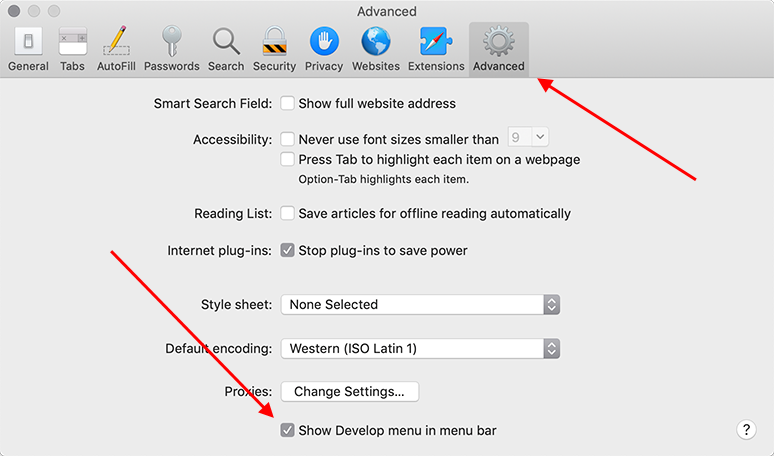
Первым делом нам потребуется включить меню разработчика – для этого переходим в раздел «Настройки» и открываем подраздел «Продвинутые». Находим пункт «Показать меню «Разработка в строке меню» и отмечаем его галочкой.
Теперь можно запустить консольное окно – достаточно воспользоваться комбинацией клавиш «Cmd+Opt+C».
Как видите, запустить консоль в браузере – дело нескольких секунд. Опция полезна, когда вы верстаете новый сайт, исправляете ошибки, проводите различные тесты.
Комьюнити теперь в Телеграм
Подпишитесь и будьте в курсе последних IT-новостей
Подписаться
Какие вкладки есть в консоли и за что они отвечают
Консоль каждого браузера содержит практически идентичные вкладки с одним и тем же функционалом, поэтому рассмотрим каждый из блоков на примере веб-обозревателя Google Chrome.
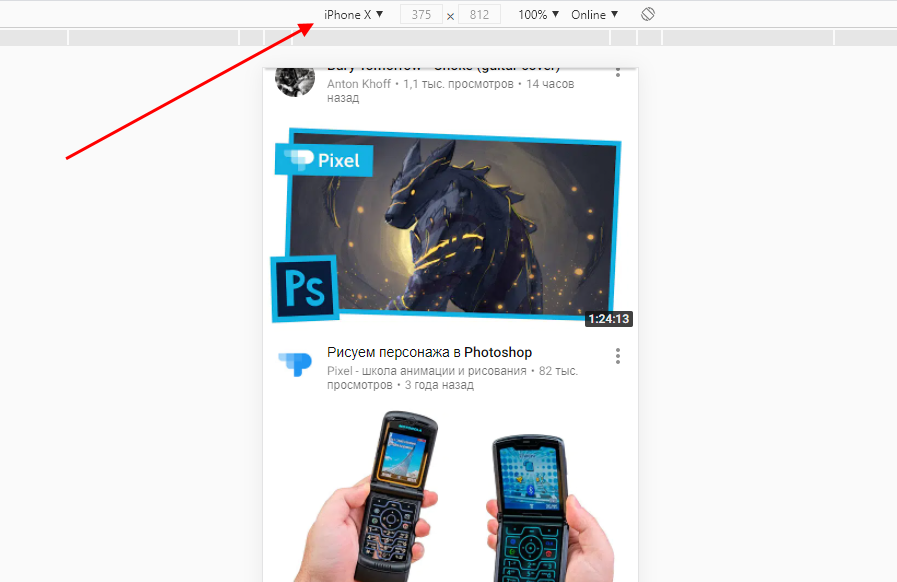
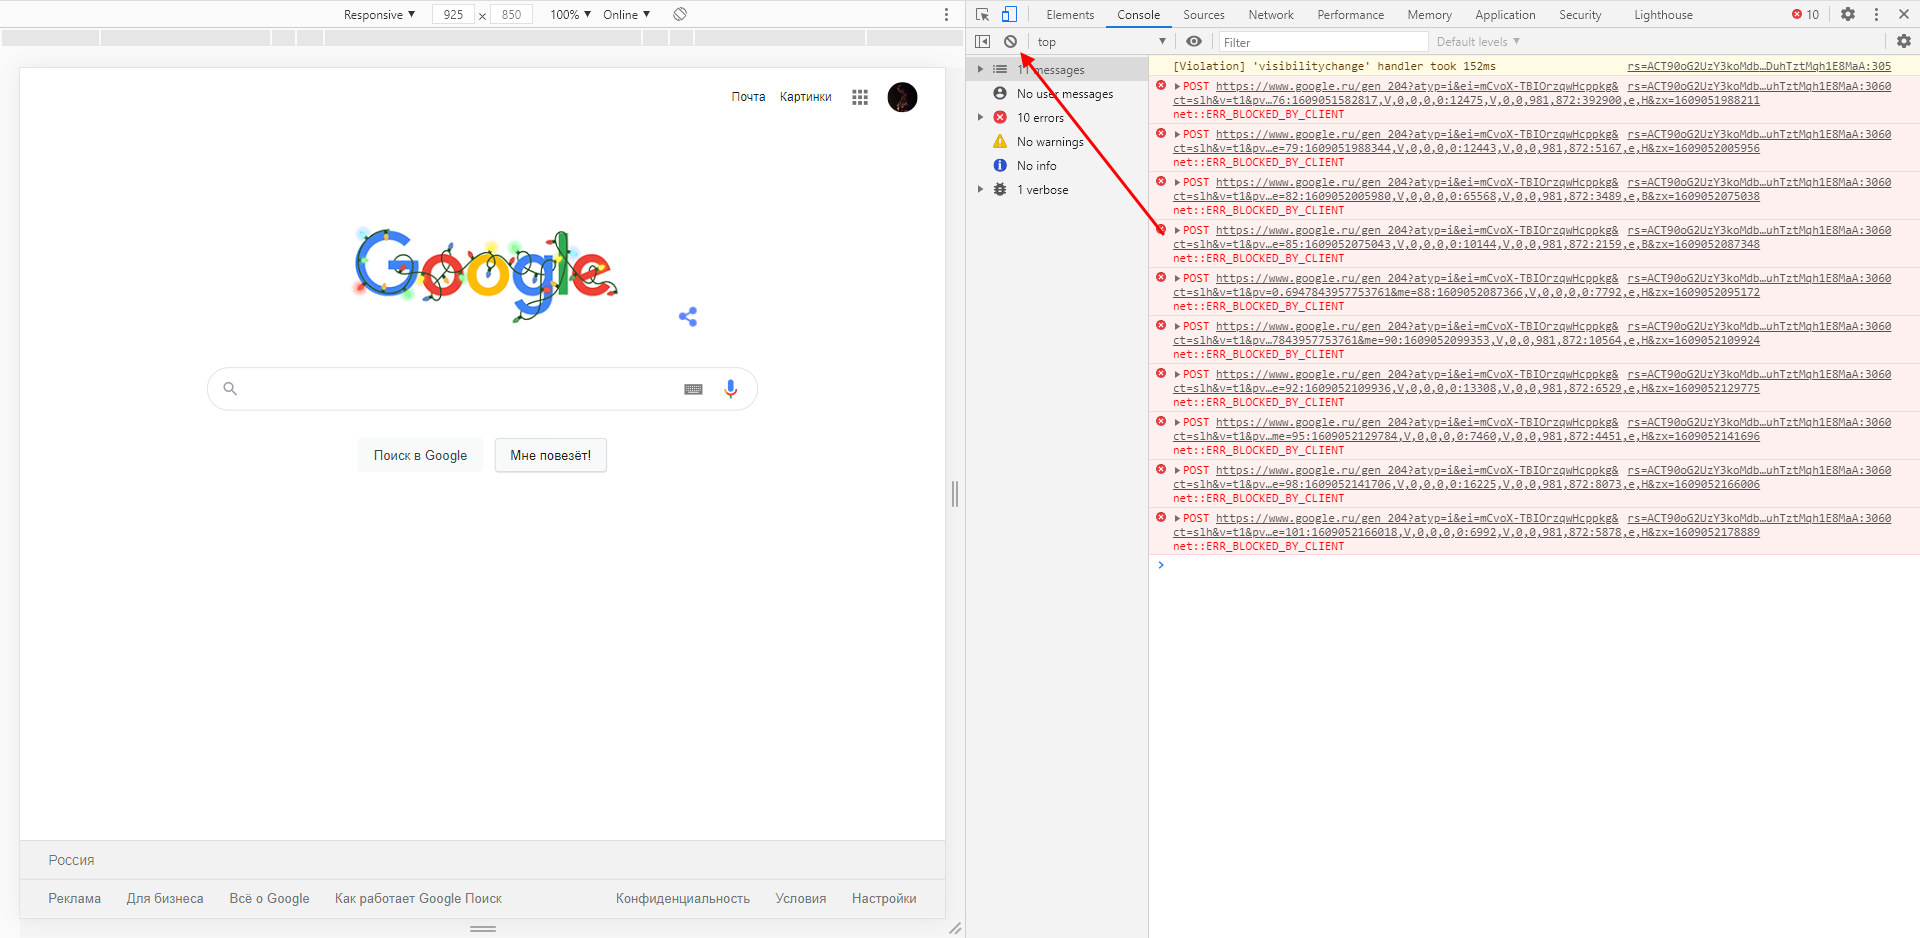
Перед тем как перейти к разбору каждой вкладки, давайте рассмотрим основное элементы, которые могут быть полезны при работе с консолью. Первый – это включение адаптивного режима. Для этого необходимо открыть консоль и в верхнем левом углу нажать на кнопку в виде телефона/планшета.
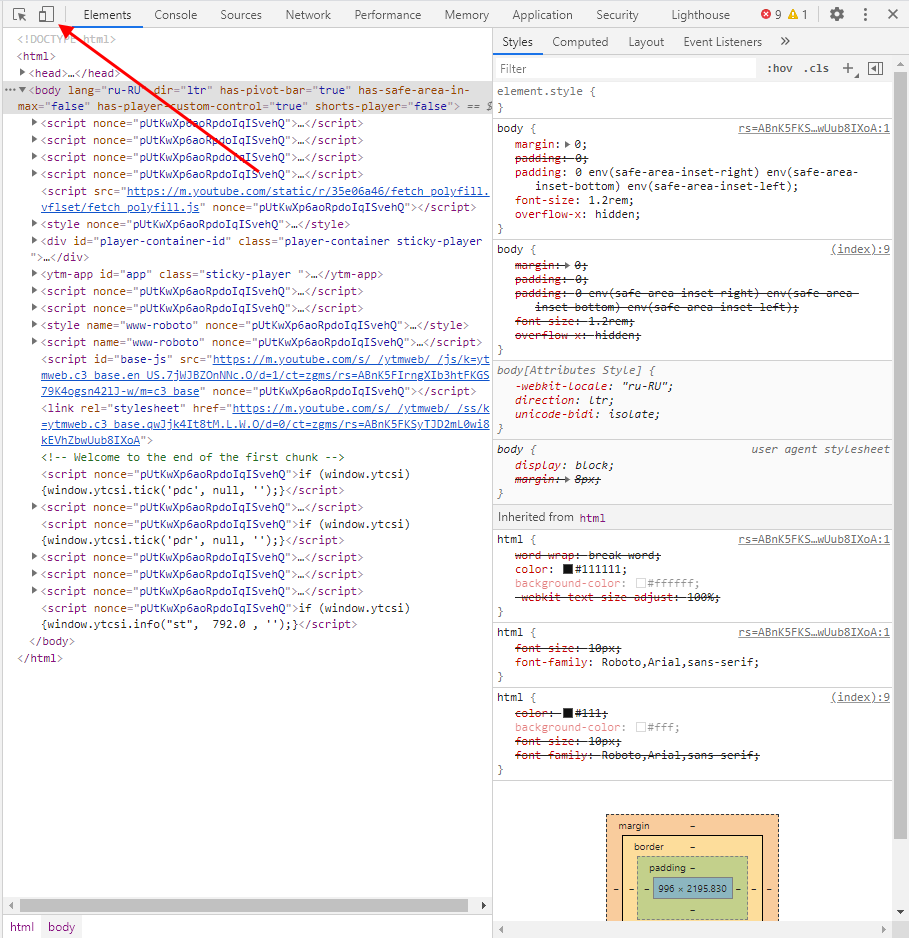
В результате левая часть окна будет немного изменена: добавятся кнопки для выбора разрешения под нужный девайс. Например, выберем устройство iPhone X, и сайт сразу же будет выглядеть так, как он выглядел бы на телефоне.
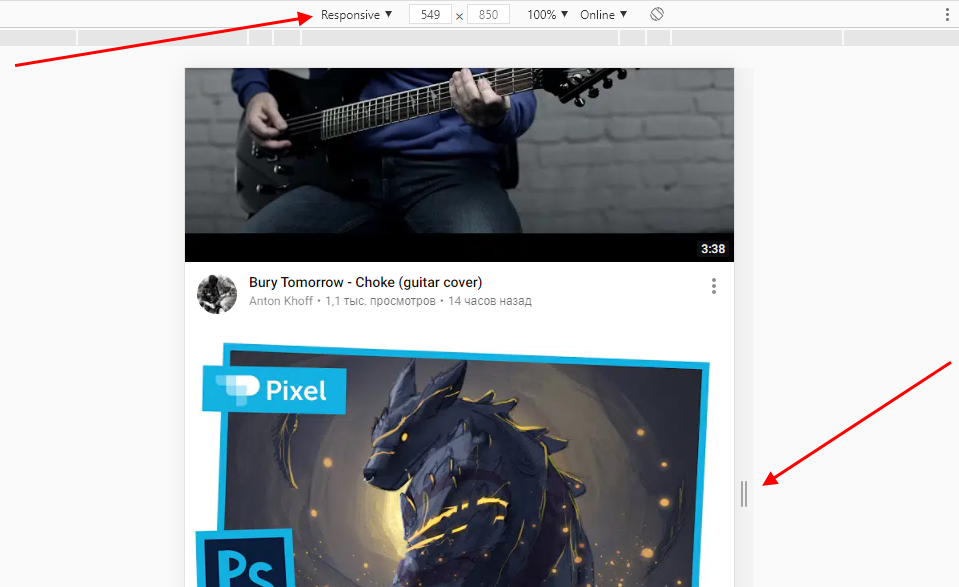
Если выбрать опцию «Responsive», то слева от страницы отобразится дополнительная линия, которую мы можем тянуть влево или вправо – с помощью нее можно подобрать необходимое разрешение страницы. Также настроить разрешение мы можем и в верхней части окна.
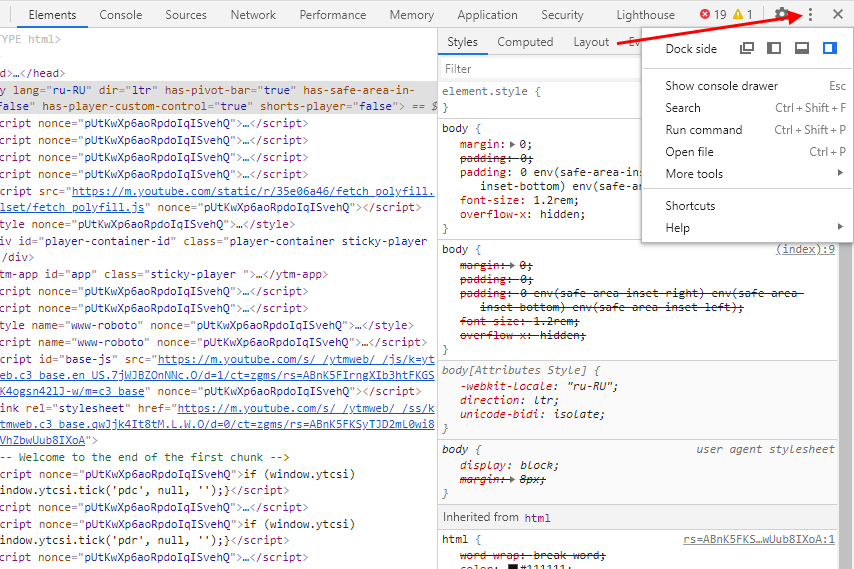
И еще одна опция, которая может быть полезна – изменение расположения консольной панели. Чтобы ей воспользоваться, необходимо в верхней правой части нажать на кнопку в виде троеточия и в строке «Dock side» изменить ориентацию. Доступные положения: справа, слева, снизу, в отдельном окне.
На этом стандартный набор функций консольной панели заканчивается. Давайте посмотрим, какие в ней есть вкладки и за что они отвечают.
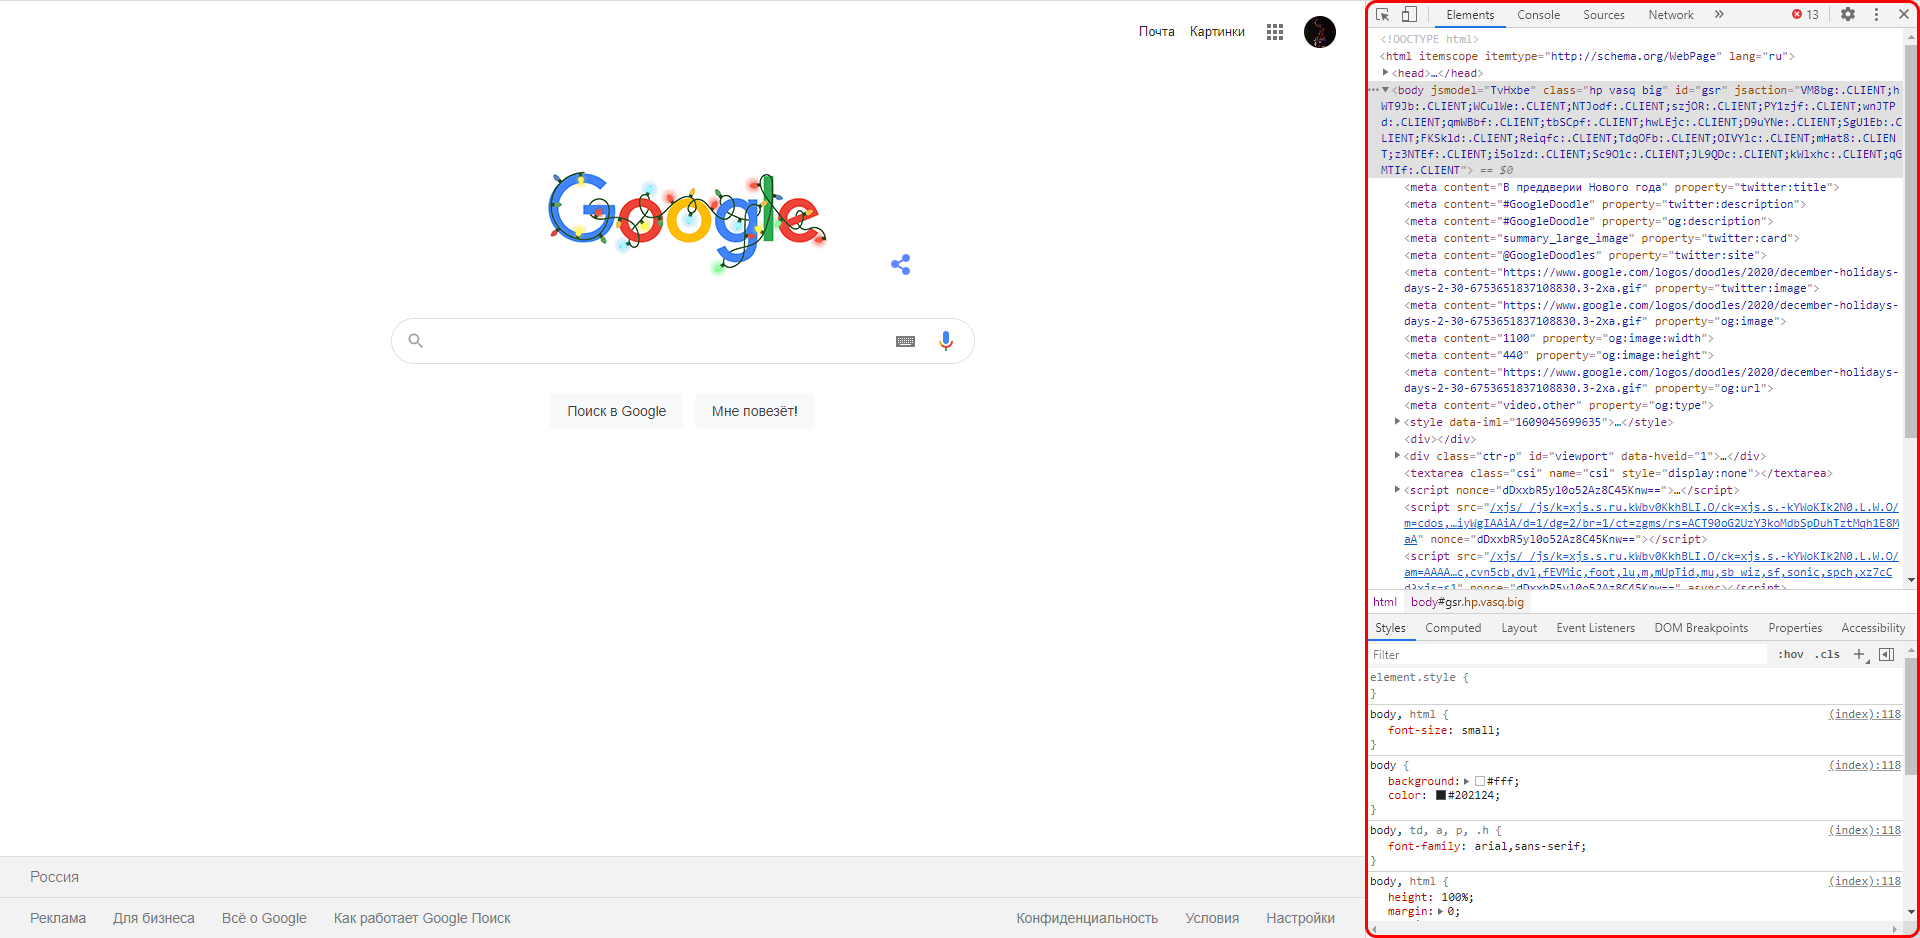
Elements
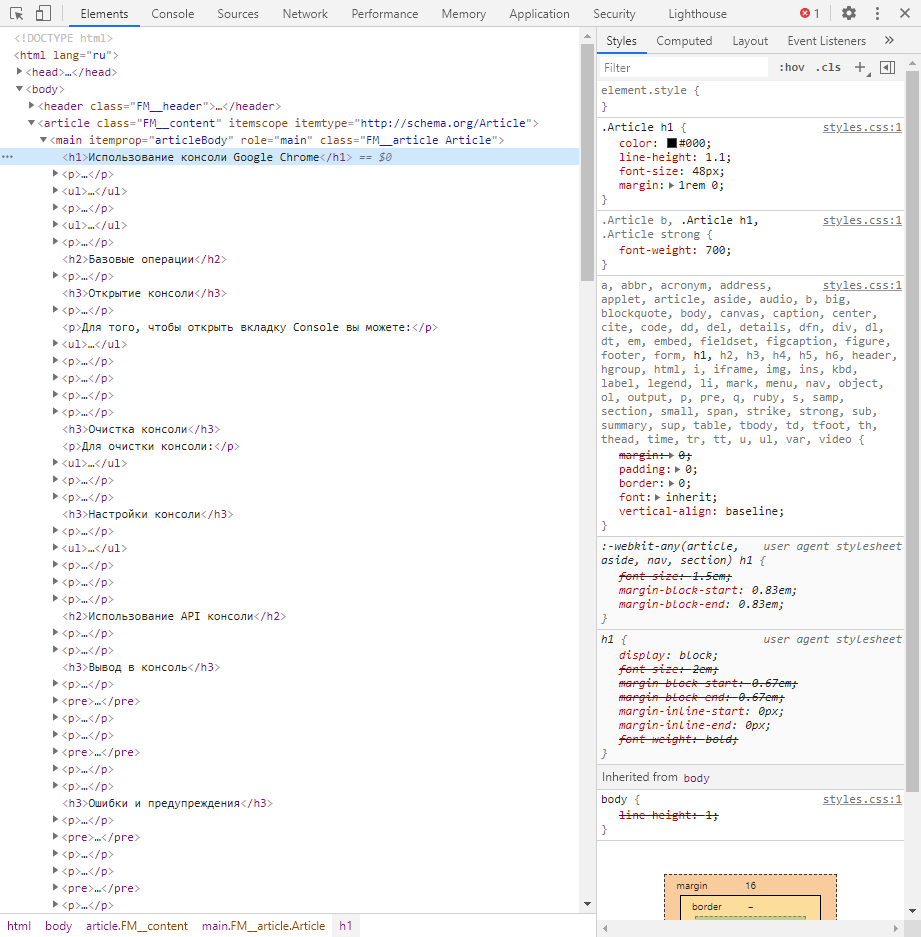
Основной компонент для верстальщиков. Он включает в себя всю информацию об открытой HTML-странице. Здесь мы можем не только посмотреть текущие теги и атрибуты, но и изменить их – в таком случае произойдет автоматическое изменение дизайна на странице. Если ее обновить, все вернется на свои места. Также открыт доступ к просмотру CSS и прочих элементов – для этого в правой части раздела идут вкладки Styles, Computed, Layout, Event Listeners, DOM Breakpoints, Properties и Accessibility.
Console
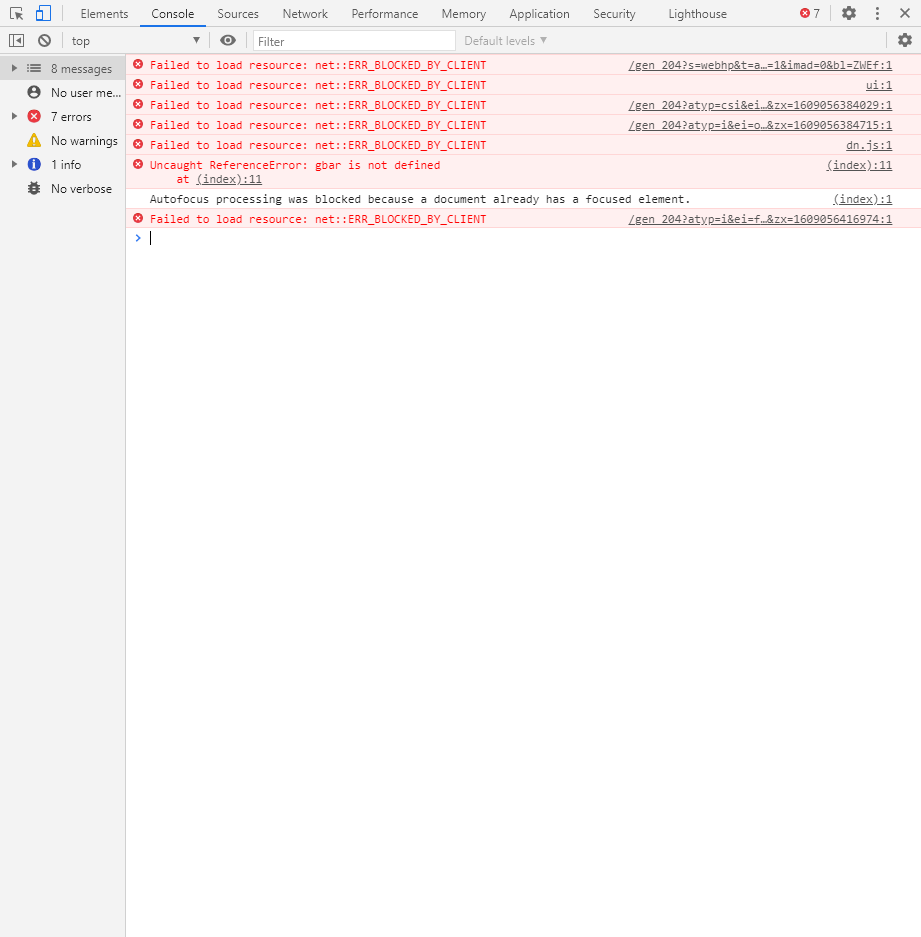
Еще одна важнейшая вкладка для верстальщиков – это Console. В ней мы можем узнать информацию о текущих ошибках на сайте, посмотреть исполняемый JavaScript-код, если он выведен в консоль с помощью метода console.log, и многое другое.
Если вам нужно очистить информацию, выведенную в консоль, то сделать это легко. Достаточно в верхнем левом углу нажать на кнопку в виде знака запрета.
Также в данной консоли мы можем посмотреть информацию об ошибках плагина, воспользоваться поиском по слову или фразе, а также установить различные фильтры на отображаемую информацию.
Sources
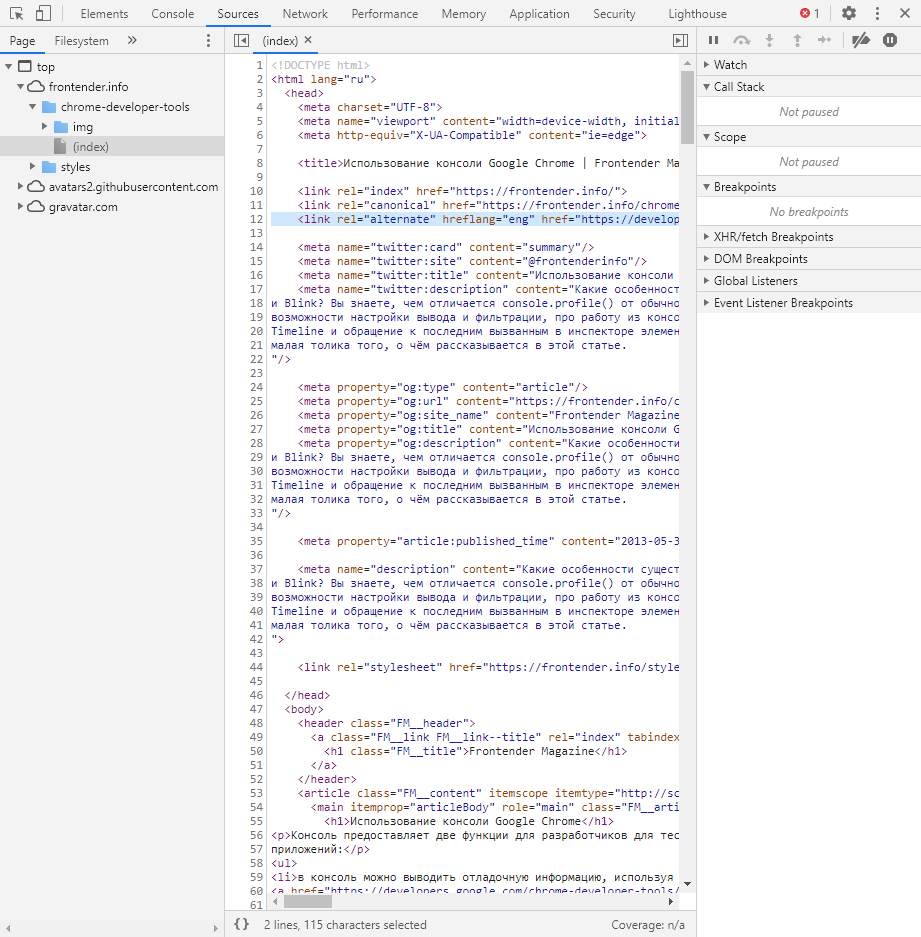
Данный раздел открывает доступ ко всей иерархии сайта: здесь мы можем посмотреть, какие используются картинки, CSS-файлы, шрифты и прочее.
Сама вкладка, как видите, разделена на 3 части. В первой содержится дерево иерархии файлов, относящихся к сайту. Вторая предназначена для просмотра содержимого этих файлов и выполнения их отладки. Для ее запуска необходимо воспользоваться последним окном.
Network
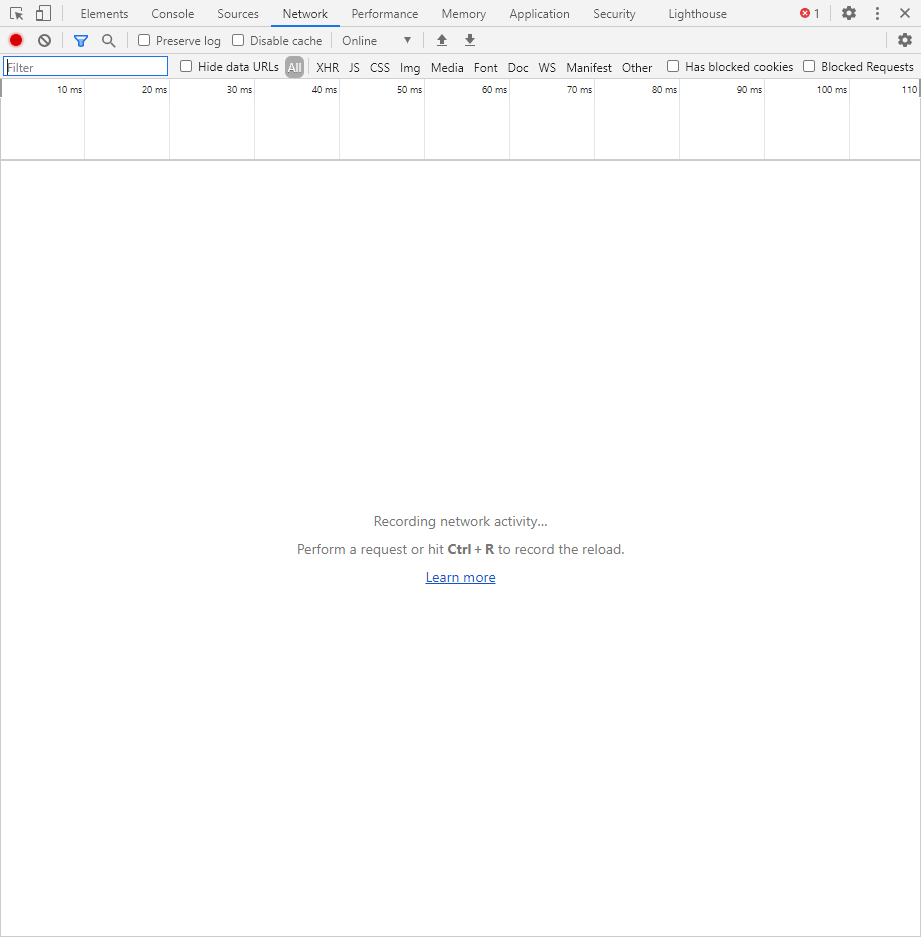
Из названия уже понятно, что данный раздел предназначен для отслеживания сетевого трафика. Его основная функция – запись сетевого журнала. Можно выявить время загрузки и обработки различных файлов, чтобы впоследствии оптимизировать страницу.
Performance
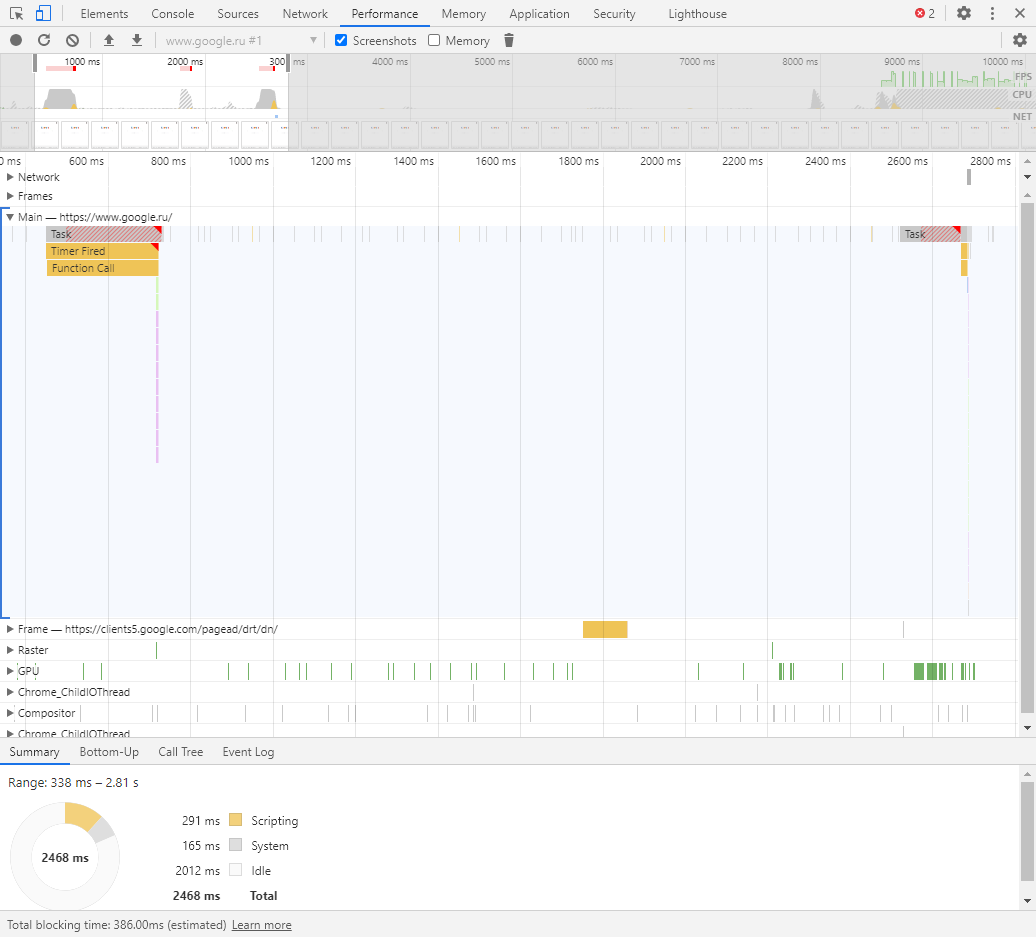
Панель отображает таймлайн использования сети, выполнения JavaScript-кода и загрузки памяти. После первоначального построения графиков будут доступны подробные данные о выполнении кода и всем жизненном цикле страницы.
Memory
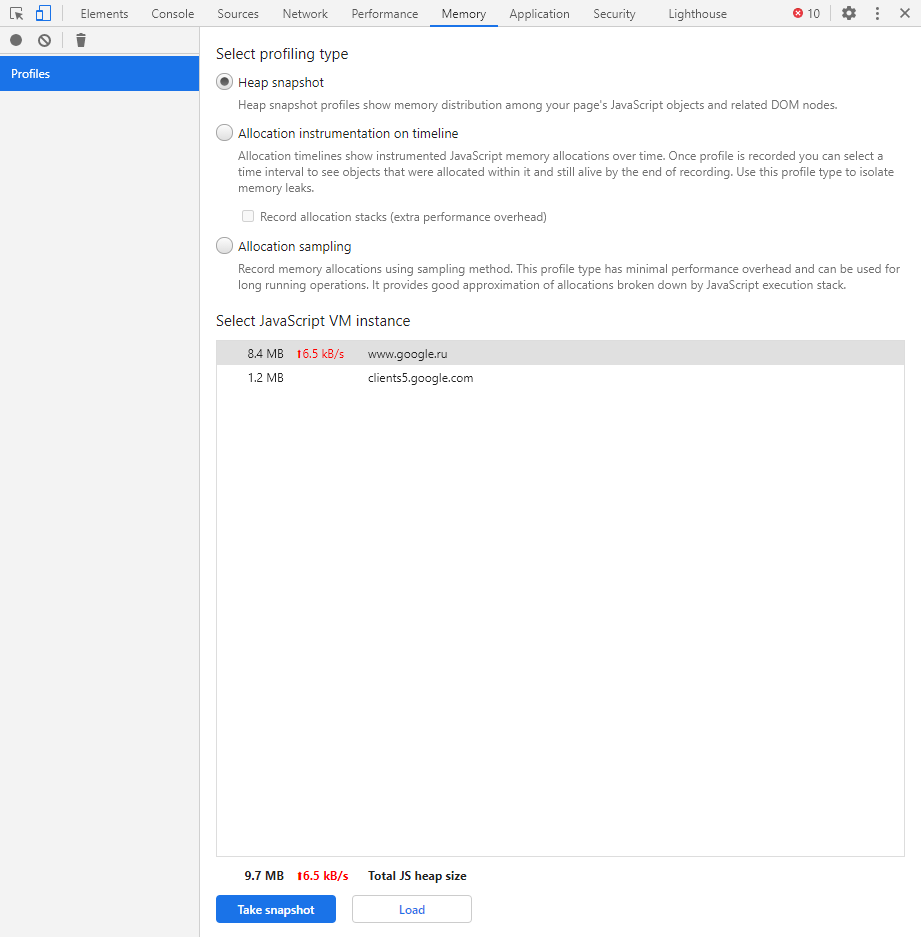
В этой вкладке можно отслеживать использование памяти веб-приложением или страницей. Мы можем узнать, где тратится много ресурсов – эту информацию в последующем можно использовать для оптимизации кода.
Application
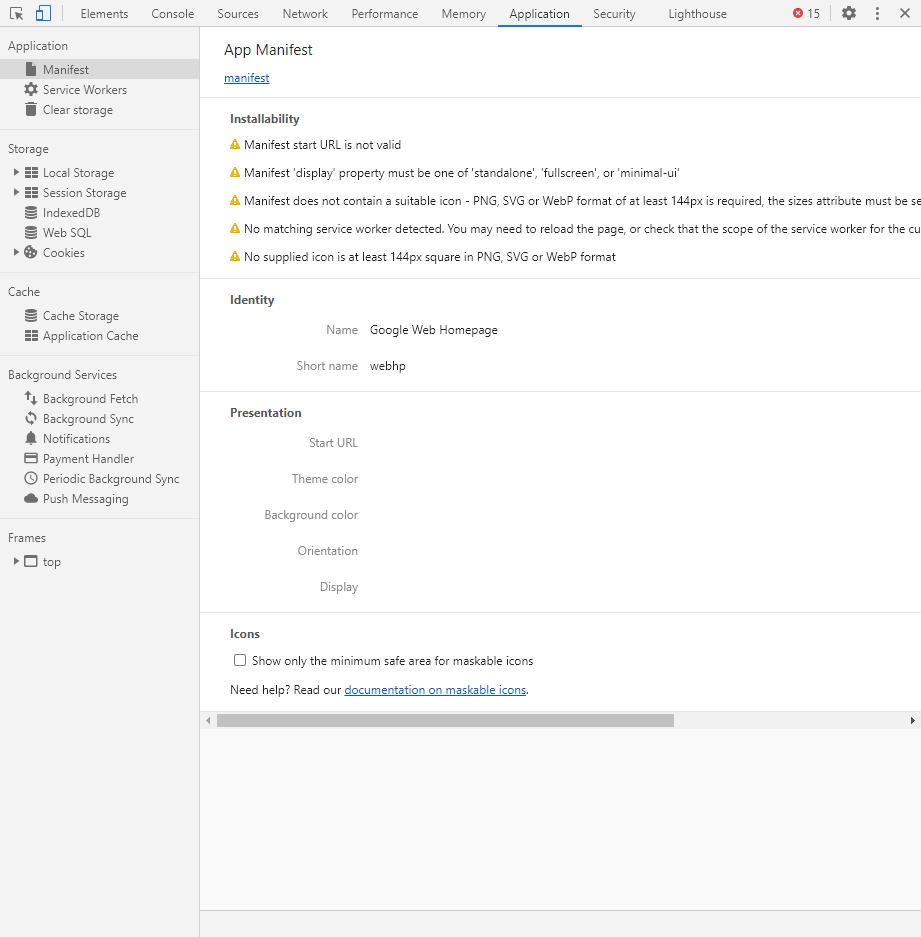
Данный раздел позволяет инспектировать и очищать все загруженные ресурсы. Мы можем взаимодействовать с HTML5 Database, Local Storage, Cookies, AppCache и другими элементами.
Основная особенность опции – чистка куки. Если вам необходимо выполнить эту процедуру, то просто откройте в левой части раздел «Cookies» и нажмите справа на значок запрета. Куки для выбранной ссылки будут очищены.
Security
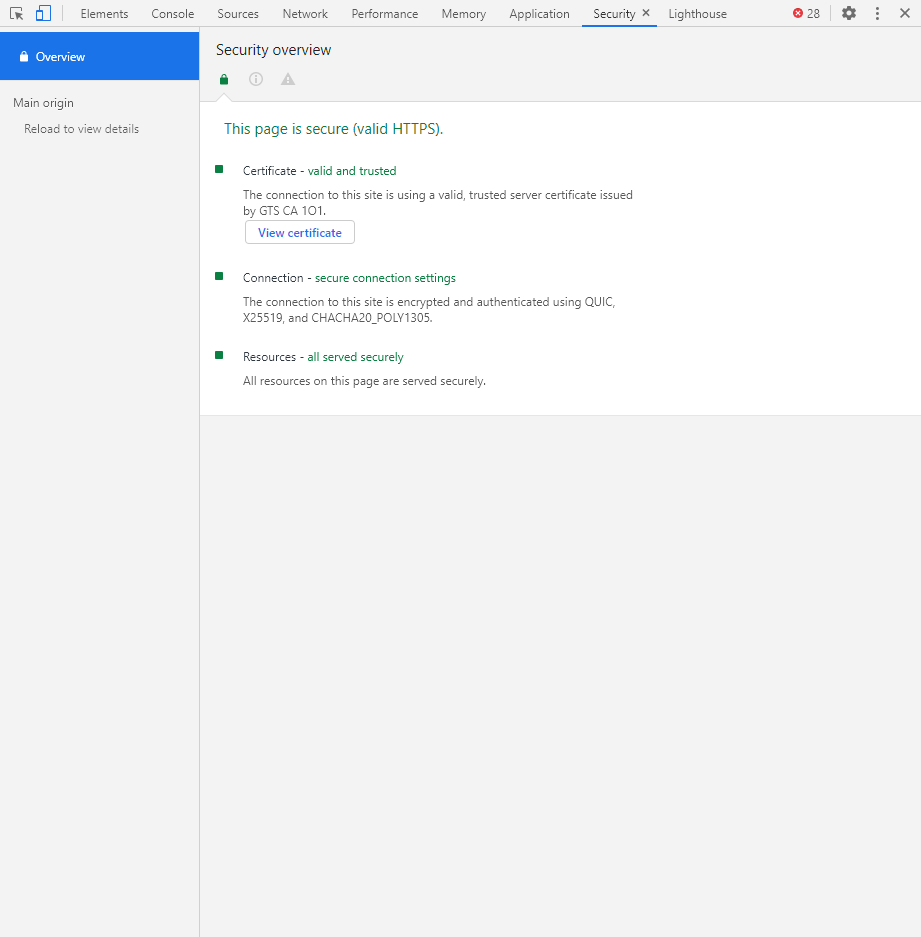
Раздел Security отображает информацию о безопасном протоколе. Если его нет, то будет сообщено, что данная страница является небезопасной. Кроме того, можно получить еще некоторые сведения о:
- проверке сертификата – подтвердил ли сайт свою подлинность TLS;
- tls-соединении – использует ли сайт современные безопасные протоколы;
- безопасности второстепенных источников.
Lighthouse
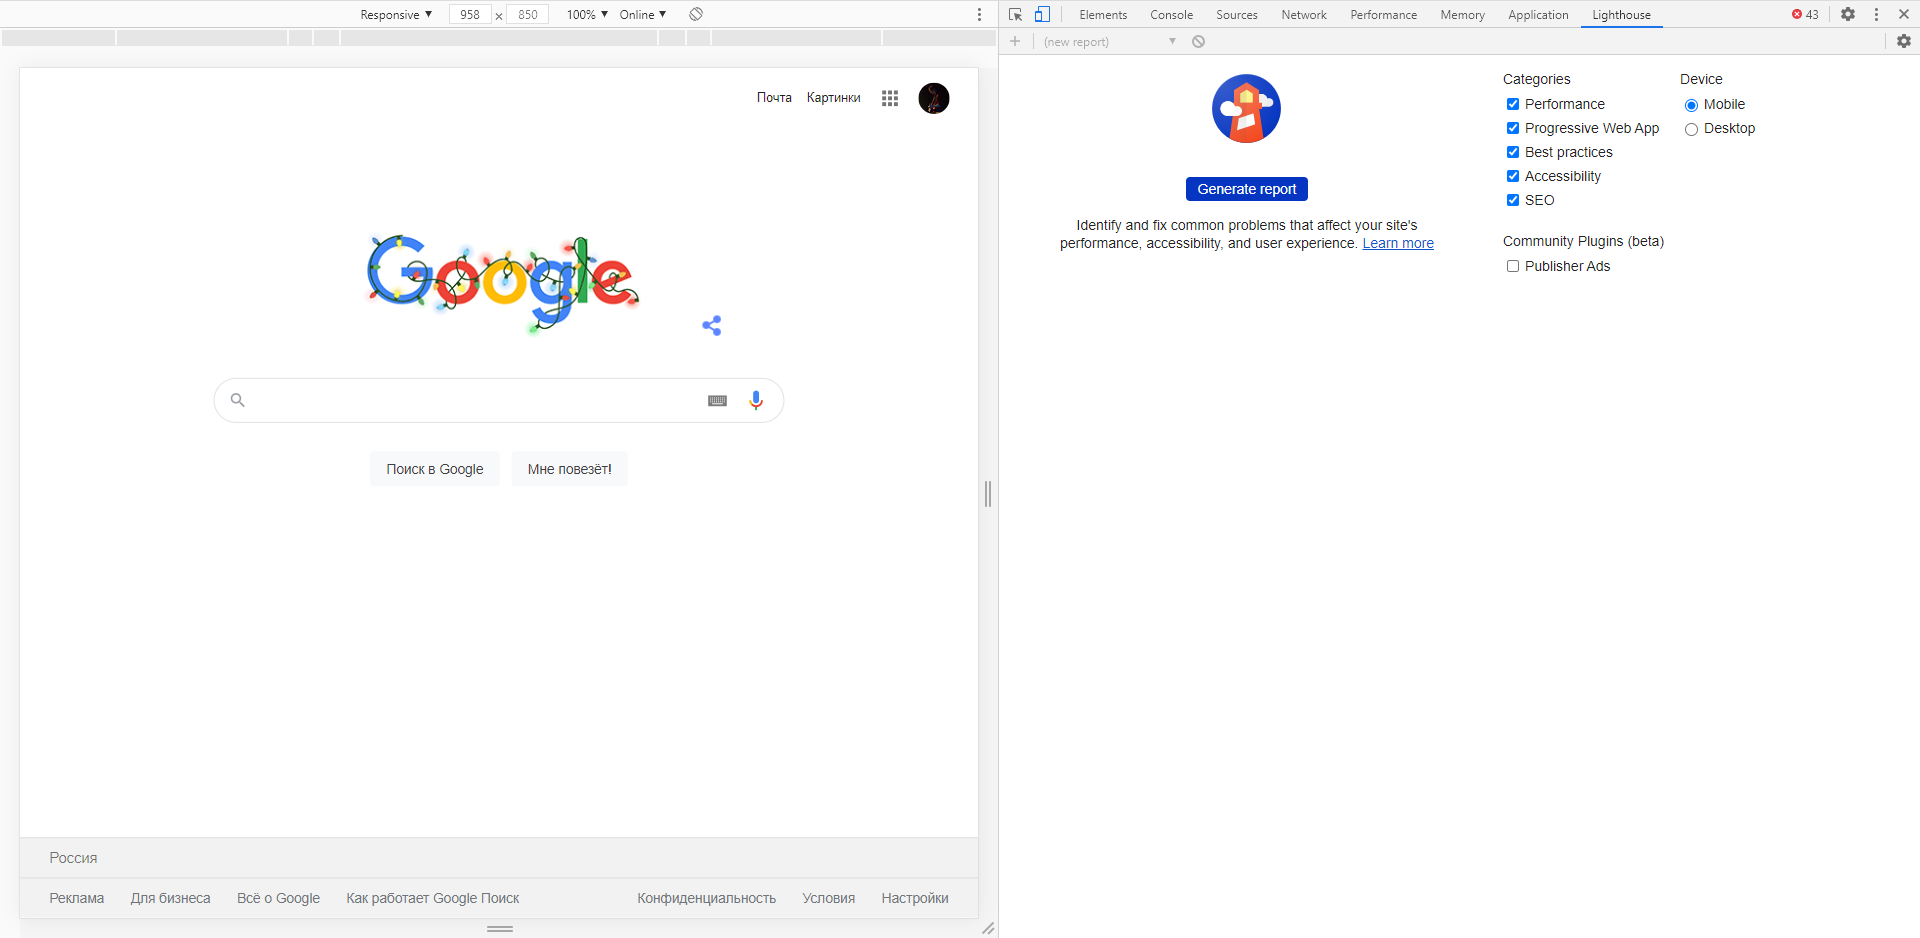
Последний раздел представляет собой инструмент аудита с открытым исходным кодом. Благодаря ему разработчики могут повысить производительность и доступность своих веб-сайтов.
Выявление основных ошибок
При возникновении возможных ошибок мы сразу будем об этом уведомлены во вкладке Console – в ней отобразится информация с красной строкой текста. Рассмотрим самые распространенные ошибки, которые могут возникать в Google Chrome, Safari и Internet Explorer:
- Uncaught TypeError: Cannot read property. Ошибка возникает в Хроме при вызове метода или чтении свойства для неопределенного объекта.
- TypeError: ‘undefined’ is not an object (evaluating). Аналогична предыдущей ошибке, но только в Safari.
- TypeError: null is not an object (evaluating). Возникает в Сафари при вызове метода или чтении свойства для нулевого объекта.
- (unknown): Script error. Обозначает ошибку скрипта.
- TypeError: Object doesn’t support property. Встречается в Internet Explorer – возникает при вызове определенного метода.
- TypeError: ‘undefined’ is not a function. Указывает на неопределенную функцию (в Chrome).
- Uncaught RangeError: Maximum call stack. Ошибка в Chrome, означающая превышение максимального размера стека.
- TypeError: Cannot read property ‘length’. Невозможно прочитать свойство.
- Uncaught TypeError: Cannot set property. Возникает, когда скрипт не может получить доступ к неопределенной переменной.
- ReferenceError: event is not defined. Обозначает невозможность получения доступа к переменной, не входящей в текущую область.
Устранение основных и прочих ошибок может быть проблематично. Если вы считаете, что они сильно мешают производительности вашего сайта, то рекомендуем поискать информацию о них в официальной документации браузера либо на тематических форумах.
Заключение
Иногда консоль пригождается не только верстальщикам – она бывает полезна для самых простых действий. Например, чтобы посмотреть мобильную версию, скачать картинку либо узнать используемый шрифт на сайте. В общем, применять консольное окно можно в различных ситуациях – как для просмотра содержимого сайта, так и для анализа потребления памяти.
Изучайте и находите свои применения этому инструменту – он может многое. Удачи!
This tip explains how to use a web browsers to help diagnose issues with published objects and/or panoramas.
Download Video
Contents
- 1 Accessing the Error Console
- 1.1 Safari
- 1.1.1 Mac OS X
- 1.1.2 Windows
- 1.2 Firefox
- 1.2.1 Mac OS X
- 1.2.2 Windows
- 1.3 Chrome
- 1.3.1 Mac OS X
- 1.3.2 Windows
- 1.4 Internet Explorer
- 1.1 Safari
- 2 Using the Error Console
- 3 See also
Accessing the Error Console
Most web browsers have a built-in error console or developer tools which may need to be activated before use. Below lists some of the more popular browsers and how to access the tools.
Safari
To access the error console in Safari, the Developer Mode must be activated first.
Mac OS X
- Open Safari and choose Safari > Preferences > Advanced. Then select Show Develop menu in menu bar.
- Choose Develop > Show Error Console.
- Close the console by clicking the close button on the left hand side of the error consoles menu bar.
Windows
- Open Safari and click Settings (highlighted below) > Preferences… > Advanced. Then select Show Develop menu in menu bar..

- To show the menu bar, click Settings > Show Menu Bar. The menu bar can be removed at any point by clicking Settings > Hide Menu Bar.
- To use the console, open Safari and in the menu bar choose Develop > Show Error Console.
- Close the console by clicking the close button on the right hand side of the error consoles menu bar.

Firefox
Firefox comes with its own built-in web console.
Mac OS X
- Open Firefox and choose Tools > Web Developer > Web Console.
- Refresh the web page.
- Close the console by clicking the Close button on the left hand side of the error consoles menu bar.
Windows
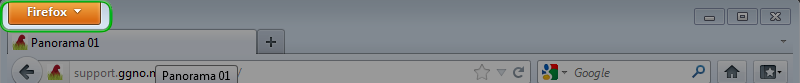
- Open Firefox then click on the Firefox drop-down menu.

- Choose Web Developer > Web Console.
- To close the Console click the Close button found on the right hand side of the Consoles menu bar.
◊ TIP: There is a powerful add-on for Firefox called Firebug, this enhances the console and makes finding faults easier. In the video above, in the second error example which used a back slash, Firebug actually shows the back slash as well as displaying the URL encoding of it.
Chrome
Google Chrome calls its error console, Developer Tools.
Mac OS X
There are a few ways to access the Developer Tools.
- From the menu bar choose View > Developer > Developer Tools. Make sure Console is highlighted then refresh the webpage.

- Open Chrome then click Customize > Tools > Developer Tools. (To close the Developer Tools click the Close button found on the left hand side of the Developer Tools menu.)

Windows
- Open Google Chrome and choose Customize > Tools > Developer Tools.
- To close the Developer Tools click the Close button found on the right hand side of the Developer Tools menu.
Internet Explorer
Internet Explorer calls their error console, Developer Tools. Unlike the other web browsers, Internet Explorer cannot detect what is happening in the Flash player so you will not get any errors. It is recommended that you use one of the other browsers for error hunting. However, it is still useful for other diagnostic reasons.
- Click Tools > F12 developer tools. The Tools button is located the right of the address bar.

- To close the developer tools click the Close button on the right in the developer tools menu.

Using the Error Console
To show the consoles working here are three links each with an error.
- Error_1 does not have its javascript file (swfobject.js) uploaded to the server, so the SWF cannot be displayed.
- Error_2 has a subfolder called, pano, that contains the SWF. The file path is using a backslash instead of a forward slash.
- Error_3 has a simple capitalization error.
Error_1 opened with Safari on Mac
When the Error Console is first opened, make sure Console and All are selected in the console’s menu bar. It is also recommended to refresh the page.
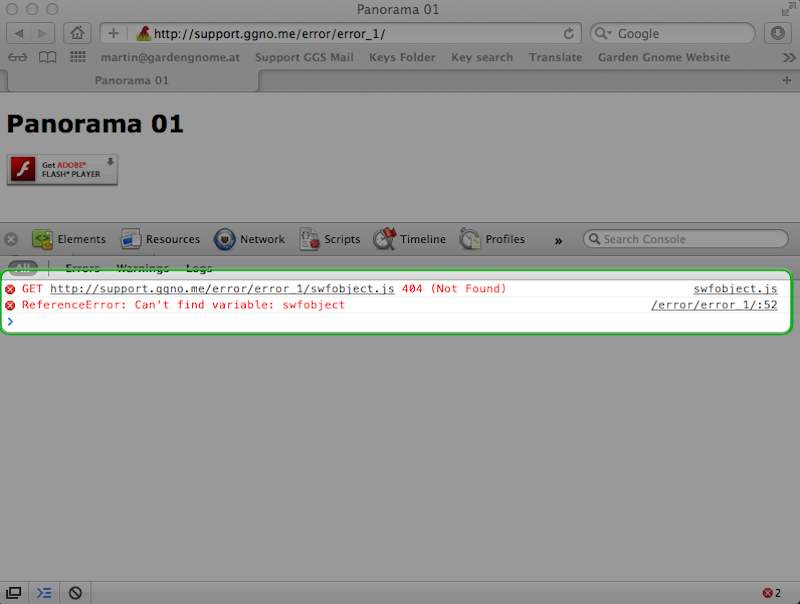
This looks as if Adobe Flash is not installed, but the console is showing it can not find the file, swfobject.js on the server.
Error_2 opened with Firefox on the PC
The page will open without an error, so click the hotspot and the console will show the error as it tries to open the next panorama.
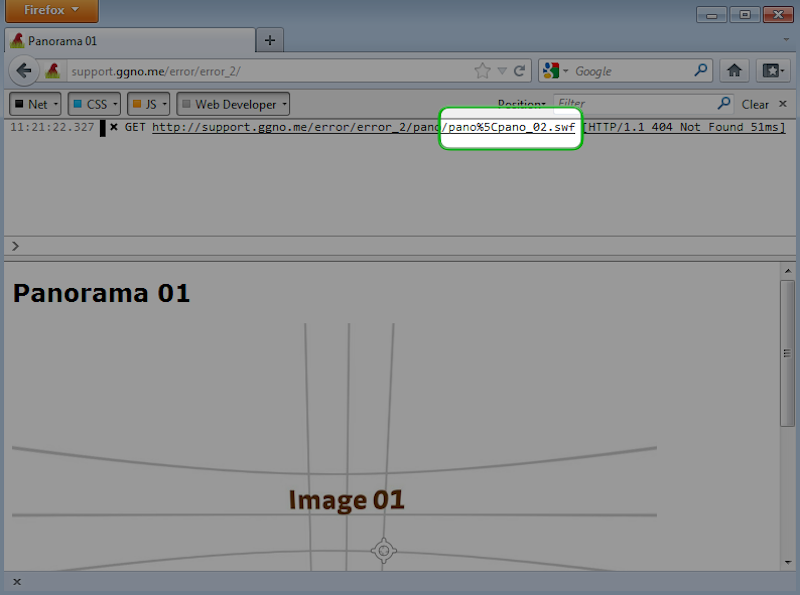
The above image is showing that rather than a forward slash (/) between the file names, it has %5C which is the URL encoding for a backslash (). So, in the Hotspot Editor the wrong slash was used.
Error_3 opened with Google Chrome on the Mac
This panorama worked before uploading to the server.
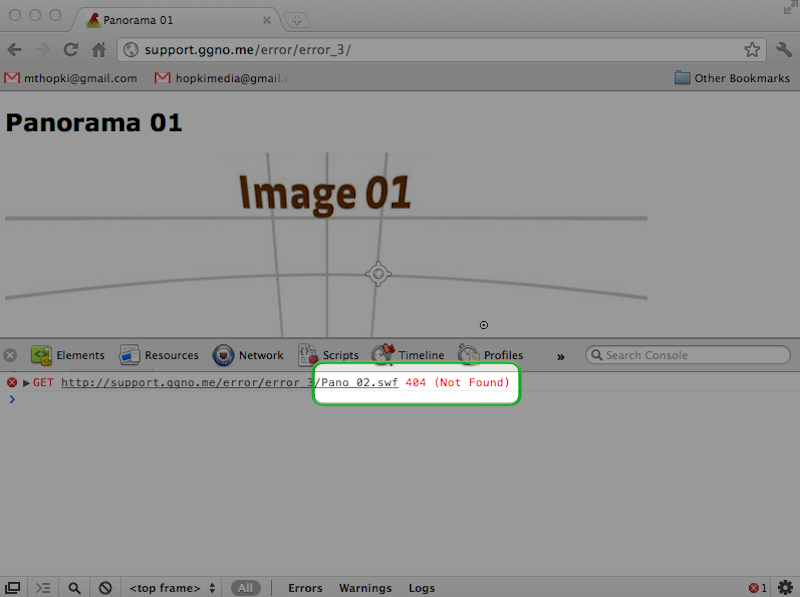
The above image is showing that when the point hotspot was clicked the panoramas did not change and an error was displayed. When clicked, the point hotspot wass looking for Pano_02.swf. However, on the server the file is pano_02.swf. When tested locally hotspots are not case sensitive, even running through the web server, but once uploaded they are.
See also
Safari Developer Tools
Google Chrome Developer Tools: Console
Firefox Error Console
w:Url_encoding
Самая распространенная причина, по которой пользователи хотят открыть консоль своего браузера, – это выявить проблемы с редактированием страницы, сломанные элементы интерфейса, некорректное поведение блоков и другие типы ошибок и конфликтов JavaScripts. Однако в каждом браузере есть свои ярлыки и шаги, которые в конечном итоге позволят вам открыть консоль и увидеть внутреннюю часть веб-страницы, которую вы посещаете. 
Поскольку существует всего четыре различных браузера с долей рынка более 5% (Chrome, Safari, Edge и Firefox), мы покажем вам несколько способов открытия консоли на каждый из них. Но имейте в виду, что в каждом браузере элементы и ошибки обычно имеют цветовую кодировку и помечаются по-разному.
Содержание
- Как Чтобы открыть консоль в Google Chrome
- Как открыть Консоль в Google Microsoft Edge
- Как открыть консоль в Mozilla Firefox
- Как открыть консоль в Google Safari
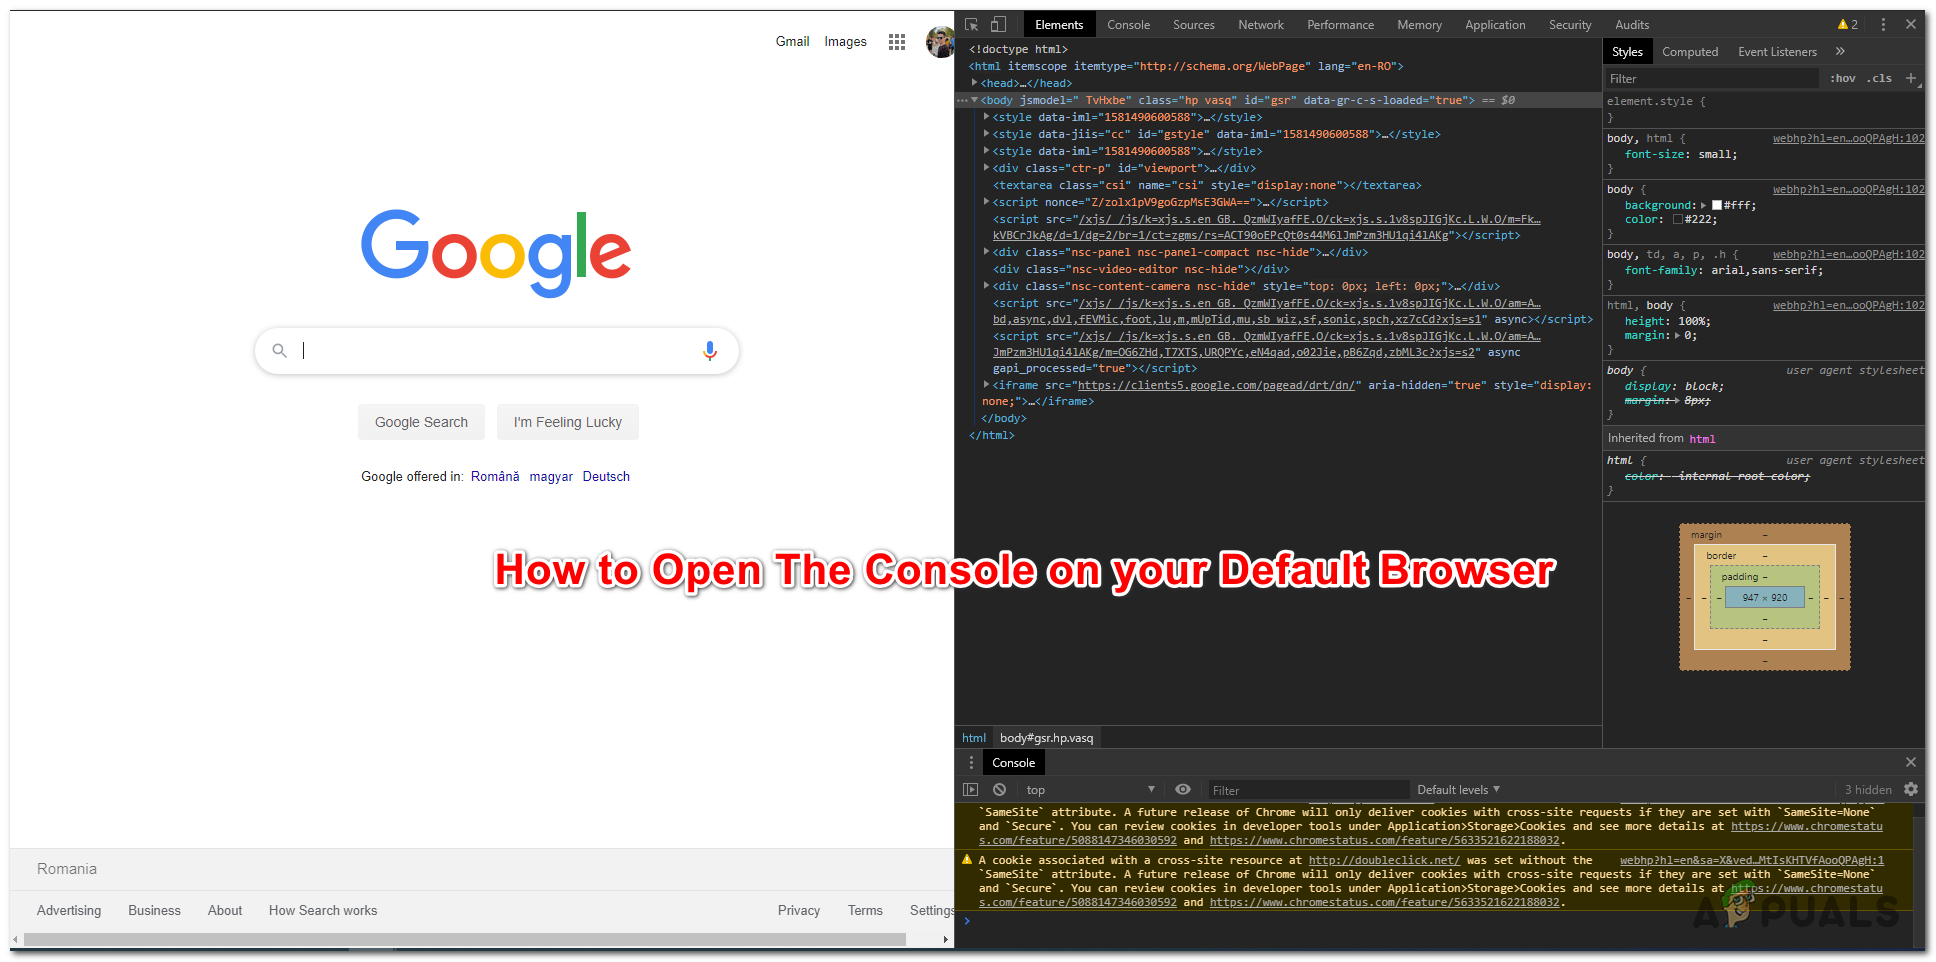
Как Чтобы открыть консоль в Google Chrome
В Chrome на самом деле есть три разных способа открыть встроенную консоль.
Независимо от Chrome сборку, которую вы используете, вы можете использовать один из этих ярлыков для открытия и закрытия встроенной консоли:
- F12
- Ctrl + Shift + J (Cmd + Option + J на Mac)
Имейте в виду, что те же сочетания клавиш также может использоваться, чтобы скрыть консоль. По умолчанию консоль Google Chrome занимает ровно половину экрана, но вы можете легко настроить соотношение с помощью ползунка в центре, и браузер запомнит изменение при следующем открытии консоли.
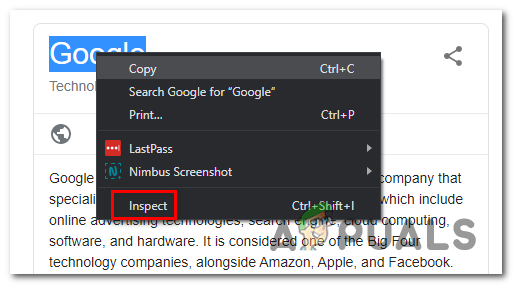
Если вы хотите сосредоточиться на конкретном элементе, вы можете просто выделить его с помощью мыши, а затем щелкнуть по нему правой кнопкой мыши> Inspect. Это откроет Элементы вкладка и вкладка Стили консоли, позволяющие сосредоточиться на текущем элементе.

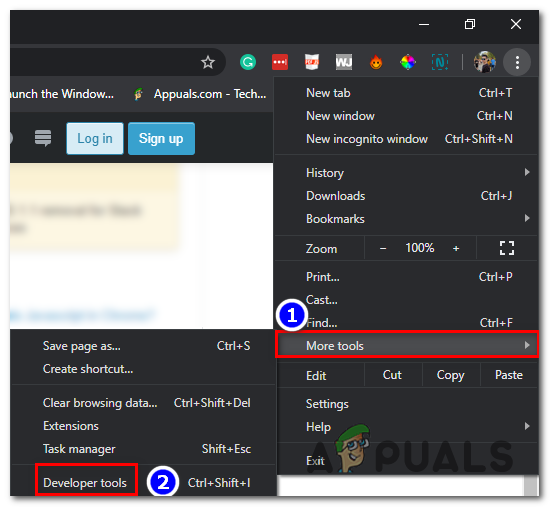
Однако вы также можете получить доступ к консоли через меню графического интерфейса Google Chrome. Для этого просто нажмите кнопку действия в правом верхнем углу и перейдите в Дополнительные инструменты> Инструменты разработчика .

Если вы хотите работать максимально эффективно, вот список ярлыков консоли Chrome, которые вы можете использовать.
Как открыть Консоль в Google Microsoft Edge
Как и в любом другом браузере, Microsoft Edge также имеет инструмент Console, предназначенный для разработчиков, выполняющих интерактивную отладку или специальное тестирование.
Этот инструмент регистрирует информация, связанная с посещаемой веб-страницей. Вы найдете информацию, связанную с Javascript, сетевыми запросами и ошибками безопасности.
Самый простой способ открыть Console Tool в Microsoft Edge – использовать предопределенный ярлык ( F12 Key ).
Но вы также можете сделать это через меню графического интерфейса, нажав кнопку действия (верхний левый угол)> Дополнительные инструменты> Инструменты разработчика .

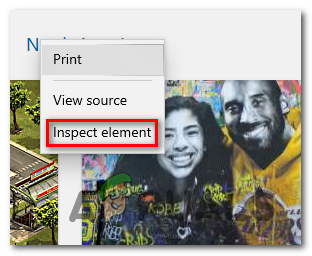
Как и в других браузерах, Microsoft Edge также позволяет вам проверять определенные элементы с помощью встроенной консоли. Для этого просто выберите и щелкните элемент правой кнопкой мыши и выберите Проверить элемент.

Вот список с некоторыми полезными ярлыками, которые вы можно использовать внутри встроенной консоли Microsoft Edge:
| Запуск консоли в режиме фокуса | Ctrl + Shift + |
| Переключение на консоль | Ctrl + |
| Показать или скрыть консоль на другой вкладке DevTools | Ctrl + ` (обратная галочка) |
| Выполнить (однострочная команда) | Enter |
| Разрыв строки без выполнения (multi-lin e) | Shift + Enter или Ctrl + Введите |
| Очистить консоль от всех сообщений | Ctrl + L |
| Фильтровать журналы (установить фокус на поле поиска) | Ctrl + |
| Принять предложение автозаполнения (когда в фокусе) | Введите или |
| Предыдущее/следующее предложение автозаполнения | Клавиша со стрелкой вверх / Клавиша со стрелкой вниз |
Как открыть консоль в Mozilla Firefox
Встроенная консоль в Mozilla Firefox работает немного иначе, чем другие аналоги, которые мы проанализировали до сих пор. Я имею в виду, что он автоматически откроется в отдельном окне, а не разделит экран вашего браузера пополам.
Это обеспечивает более продуктивный подход для людей, у которых есть второй экран, но они могут попасть внутрь способ пользователей, которым нужно работать с одним маленьким экраном. (Если вы находитесь в этом сценарии, вы можете использовать сочетание клавиш Alt + Tab для переключения между Firefox и связанной консолью браузера.
Чтобы открыть встроенную консоль браузера в Mozilla Firefox , у вас есть три варианта:
- Вы можете использовать универсальный ярлык – Ctrl + Shift + J (или Cmd + Shift + J на Mac)
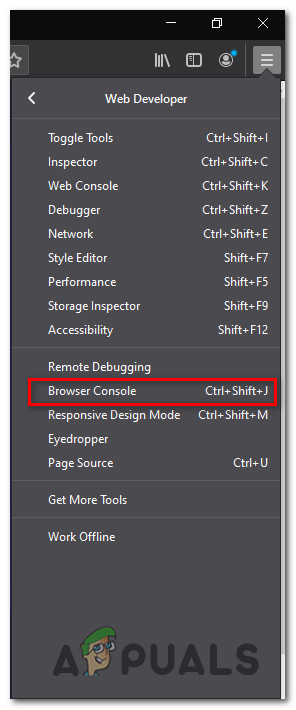
- Вы можете открыть его из меню действий – щелкнув меню действий> Web Developer> Browser Console .

- Или вы можете принудительно открыть консоль браузера напрямую, запустив Firefox из командной строки и передав аргумент ‘-jsconsole’:
/Applications/FirefoxAurora. app/Contents/MacOS/firefox-bin -jsconsole
Примечание. Firefox также включает веб-консоль, которая очень похожа на в консоль браузера, но он применяется к отдельной вкладке контента, а не ко всему браузеру.
Как открыть консоль в Google Safari
В отличие от любого другого браузера, который мы рассмотрели до сих пор, консоль ошибок в Safari отключена по умолчанию. Из-за этого вам нужно будет сделать дополнительный шаг, чтобы включить его в своем браузере.
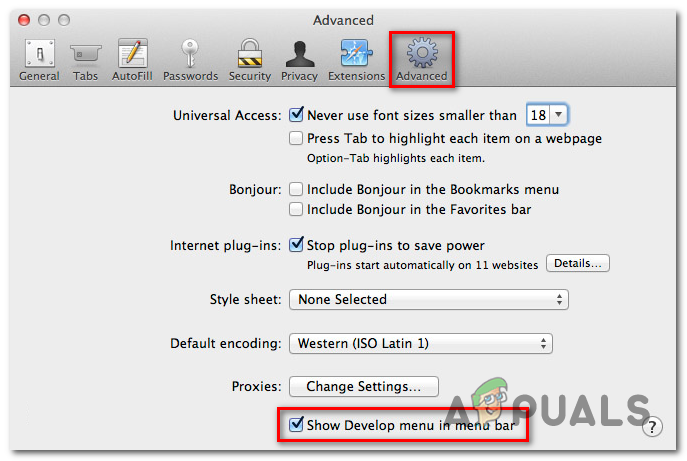
Для этого откройте Safari и нажмите Настройки таб. Находясь на вкладке Настройки , щелкните вкладку «Дополнительно» и установите флажок, связанный с меню Показать разработку в строке меню.

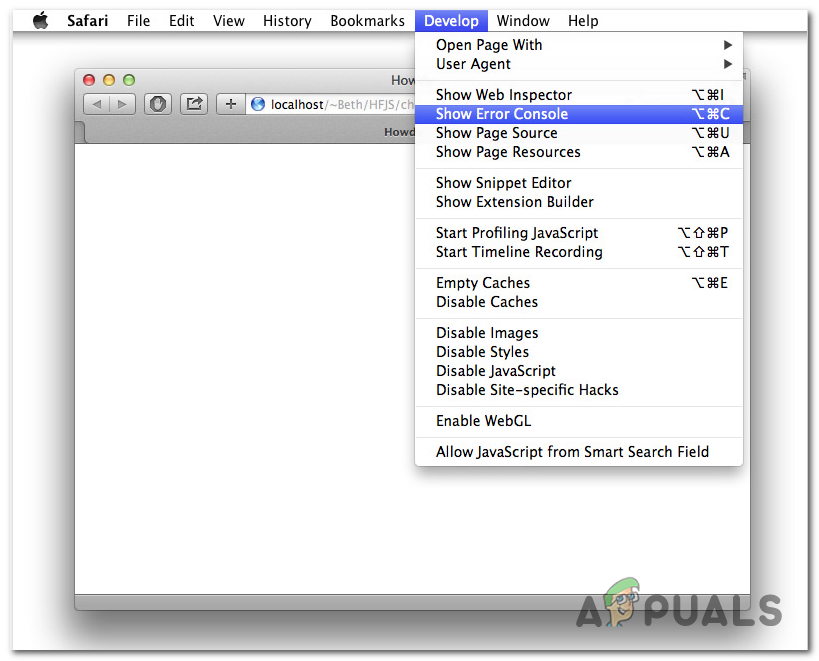
Теперь, когда вы сделали консоль видимой, вы можете открыть ее с помощью Develop вверху и нажав Показать консоль ошибок .

Имейте в виду, что Safari имеет динамический способ отображения консоли ошибок. Если при открытии консоли окно маленькое, вы увидите его в совершенно другом окне.
Если вы хотите открыть консоль в том же окне, что и ваша страница, вам нужно будет перед открытием консоли ошибок убедитесь, что окно браузера полноразмерно.

The most common reason why users want to open their browser console is to identify problems with page editing, broken interface elements, misbehaving blocks ad other types of JavaScripts errors and conflicts. However, each browser has its own shortcuts and steps that will ultimately allow you to open up the console and see the back-end of a web-page that you visit.
Since there are only four different browsers with over 5% market share (Chrome, Safari, Edge, and Firefox), we will show you multiple ways of opening the console on each of them. But keep in mind that with each browser, the elements & errors are generally colour-coded and labelled differently.
On Chrome, there are actually three different ways that will allow you to open the built-in console.
Regardless of the Chrome build that you’re using, you can use one of these shortcuts to open and close the built-in console:
- F12
- Ctrl + Shift + J (Cmd + Option + J on Mac)
Keep in mind that the same shortcuts can also be used to hide the console. By default, the console of Google Chrome takes exactly half of the screen, but you can adjust the ratio easily via the slider on the middle and the browser will remember the modification the next time you open the console.
If you want to focus on a specific element, you can simply highlight it with your mouse and then right-click on it > Inspect. This will open up the Elements tab and Styles tab of the console, allowing you to focus on the element at hand.
However, you can also access the console via the GUI menu of Google Chrome. To do this, simply click on the action button in the top-right corner and go to More Tools > Developer Tools.
If you’re looking to work as efficiently as possible, here’s a list of Chrome Console shortcuts that you can use.
How to Open the Console on Google Microsoft Edge
Like every other browser, Microsoft Edge also has a Console tool meant for developers doing interactive debugging or ad hoc testing.
This tool logs information associated with the webpage that’s being visited. You’ll find information related to Javascript, network requests and security errors.
The easy way of opening the Console Tool on Microsoft Edge is by using the predefined shortcut (F12 Key).
But you can also do it via the GUI menu by clicking on the action button (top-left corner) > More tools > Developer Tools.
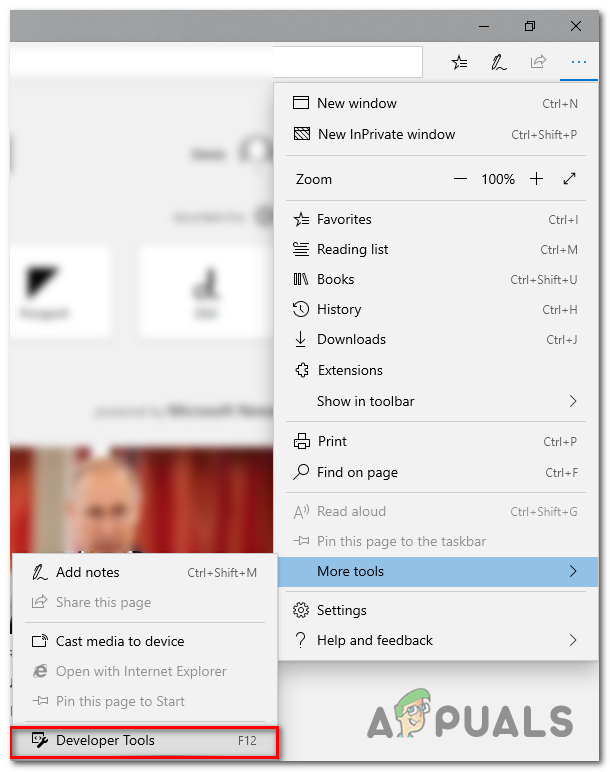
And similar to the functionality on the other browsers, Microsoft Edge also allows you to inspect specific elements using the built-in console. To do this, simply select and right-click on an element and choose Inspect Element.
Here’s a list with some useful shortcuts that you can use inside the built-in console of Microsoft Edge:
| Launching the Console in focus mode | Ctrl + Shift + J |
| Switching to the Console | Ctrl + 2 |
| Show or hide the Console from another DevTools tab | Ctrl + ` (back tick) |
| Execute (single-line command) | Enter |
| Line break without executing (multi-line command) | Shift + Enter or Ctrl + Enter |
| Clear the Console of all messages | Ctrl + L |
| Filter logs (set focus to search box) | Ctrl + F |
| Accept auto-completion suggestion (when in focus) | Enter or Tab |
| Previous/next auto-completion suggestion | Up arrow key/Down arrow key |
How to Open the Console on Mozilla Firefox
The built-in console on Mozilla Firefox works a little differently than the other equivalents that we’ve analyzed so far. What I mean by this is that it will automatically open in a standalone window, rather than splitting your browser screen in half.
This allows for a more productive approach for people with second screens but might get in the way of users that need to work with one small screen. (If you’re in this scenario, you can use Alt + Tab shortcut to cycle back and forth between Firefox and the associated Browser Console.
To open up the build-in browser console on Mozilla Firefox, you have three options:
- You can either use the universal shortcut – Ctrl + Shift + J (or Cmd + Shift + J on a Mac)
- You can open it from the action menu – By clicking on the action menu > Web Developer > Browser Console.
- Or you can force the Browser Console to open directly by launching Firefox from the command line and passing the ‘-jsconsole’ argument:
/Applications/FirefoxAurora.app/Contents/MacOS/firefox-bin -jsconsole
Note: Firefox also includes a Web console, which is very similar to the Browser console but it’s applied on a single content tab rather than on the whole browser.
How to Open the Console on Google Safari
Unlike every other browser that we’ve looked at so far, the Error Console on Safari is disabled by default. Because of this, you’ll need to do an extra step in order to enable it on your browser.
To do this, open Safari and click on the Preferences tab. Once you’re inside the Preferences tab, click on the Advanced tab and check the box associated with Show Develop menu in the menu bar.
Now that you’ve made the Console visible, you can open it by accessing the Develop tab at the top and clicking on Show Error Console.
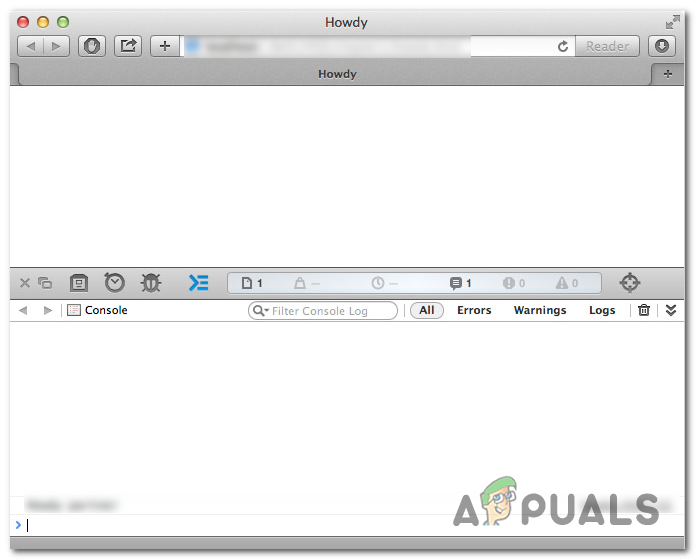
Keep in mind that Safari has a dynamic way of displaying the error console. If the window is small when you open the console, you will see it in a completely different window.
In case you want to open the console in the same window as your page, you will need to ensure that the browser window is of full size before opening the Error console.

Kevin Arrows
Kevin Arrows is a highly experienced and knowledgeable technology specialist with over a decade of industry experience. He holds a Microsoft Certified Technology Specialist (MCTS) certification and has a deep passion for staying up-to-date on the latest tech developments. Kevin has written extensively on a wide range of tech-related topics, showcasing his expertise and knowledge in areas such as software development, cybersecurity, and cloud computing. His contributions to the tech field have been widely recognized and respected by his peers, and he is highly regarded for his ability to explain complex technical concepts in a clear and concise manner.