Продолажем активно использовать оборудование Mikrotik , данная заметка касается диагностика портов, диагностика кабеля.
/interface ethernet monitor ether1
name: ether1-uplink
status: link-ok
auto-negotiation: done
rate: 100Mbps
full-duplex: yes
tx-flow-control: no
rx-flow-control: no
advertising: 10M-half,10M-full,100M-half,100M-full
link-partner-advertising: 10M-half,10M-full,100M-half,100M-full
Начиная с версии RouterOS V6rc4, появилась возможность определения проблем с кабелем:
/interface ethernet cable-test ether2
name: ether2
status: link-ok
# или
name: ether2
status: no-link
cable-pairs: open:6,open:6,open:6,open:6
В первом случае проблем нет, во втором 4 пары открыты на расстоянии 6 метров от коммутатора.
Более подробно можно посмотреть на станице официальной документации Mikrotik — http://wiki.mikrotik.com/wiki/Manual:Interface/Ethernet
Размещено в разделе Mikrotik
25.02.2015

Диагностика неисправностей то ещё занятие. Но всякий, кто изучил данную практику, может ничего не бояться. Поиск и устранение требуют глубокие знания, но выработанный навык много стоит. Компания Mikrotik имеет большое количество инструментов диагностики сети (Troubleshooting), как для проводных, так и WiFi. В данной статье рассмотрим наиболее часто используемые для проводных сетей. Конфигурация будет использоваться самая домашняя на RouterOS 6 47.4.
Если вы хотите углубить свои знания по работе с роутерами MikroTik, то наша команда рекомендует пройти курсы которые сделаны на основе MikroTik Certified Network Associate и расширены автором на основе опыта . Подробно читайте ниже.
Содержание
- Torch
- IP Scan
- Cable Test
- Log
- Traceroute
- Ping
- ARP
- Connections
- Passthrough
- Sniffer
- Profile
- Bandwidth Test
- 89 вопросов по настройке MikroTik
Torch позволяет просматривать трафик на интерфейсах в реальном времени.

В качестве примера, я запущу с рабочей станции ping на 8.8.8.8. Скриншот ниже демонстрирует всех, кто отправляет эхо запросы на 8.8.8.8. Для удобства вывода я отключил IPv6. Так же выбрал основной бридж, т.к. мне нужно понять, кто из локальной сети отправляет и нажал Start. Статус Running в скобках, говорит о том, что идёт прослушка трафика.

Теперь давайте взглянем на какой IP адрес роутера, нам отвечает Google, поменяв местами SRC и DST, а также выберем внешний интерфейс.
Из дополнительного, вы можете просмотреть какая метка VLAN бегает внутри кадра.

Вы можете жёстко задать Src. Address. Посмотрим, куда лезет мой телефон, если я открою YouTube.

Открыть данную утилиту можно в контекстном меню любого из интерфейсов. Есть возможность использовать в консольном режиме.

IP Scan
Маленькая утилита, позволит узнать, какая подсеть/подсети или адреса видны на определённых интерфейсах.
Попробуем выяснить, что живёт на провайдером интерфейсе самого крупного оператора нашей страны.
Если вы хотите просканировать определённую подсеть, то можете ее указать в Address Range.

Как только я получил данный адрес, мой порт тут отключился. Позвонив в ТП, меня уверяли, что никаких блокировок на порту нет и т.д. и т.п. Оператор утверждала, что проблема в обрыве кабеля. Давайте проверим кабель.
Cable Test
Да, Mikrotik умеет диагностировать разрыв физической линии с помощью утилиты Cable Test, причём довольно точно. После разговора с оператором, я запустил данную утилиту. Картина интересна, по трём парам 94 метра, а по одной 98, и все они разорваны на одинаковом расстоянии от меня.

Полагаю, что оператор был не прав (оно и очевидно), т.к. мой линк снова загорелся, спустя 5 минут.
Будьте осторожны, подобные ситуации, могут быть и у вас.
Log
Логирование основных действий пишется в ОЗУ и хранится до перезагрузки устройства. Вот тут, помимо засвеченных маков, можно увидеть, что WAN интерфейс поднялся и через 40 секунд отключился основной провайдерский линк.

Вы можете детализировать отображаемую информацию через System – Logging. На примере ниже, я добавил хранение в ОЗУ всех DNS запросов. Лог сразу же стал быстро заполняться и пролистываться.
Для приостановки автопролистывания есть кнопка Freeze, она замораживает автоскролинг.

В Actions, вы можете настроить отправку логов на удалённый Syslog Server, или хранить их локально на диске.

Не сложными манипуляциями возможно сделать debug определённых служб, допустим DHCP.

Берите на вооружение, очень полезная штука.
Traceroute
Tools — Traceroute
Графическая утилита, для определения количества хопов по пути. Фишка ее в том, что она постоянно будет рисовать потери, историю и время до хопа.

Вы можете указать максимальное количество прыжков, исходящий адрес, таблицу маршрутизации, интерфейс и размер пакета.
Ping
Tools — Ping
Простенькая тулза, с дополнительными фишками по аналогии с Traceroute. Позволяет сделать пинг на L2 – ARP-Ping. Для этого нужно выбрать интерфейс. На скриншоте видно стабильное время отклика до моего ноутбука, подключённого через WiFi.

ARP
IP – ARP-List
Таблица ARP адресов доступна на просмотр соответствий. Можно создать постоянную запись соответствия IP к MAC.

Connections
Если ваш роутер, настроен на преобразование адресов, или по-русски, есть хотя бы одно правило NAT, то включается тот самый Connection Tracker. С помощью его фильтров, можно просматривать состояние соединений.
Открываем IP – Firewall – Connections, нажимаем на фильтр:
Я хочу просмотреть все соединения с 192.168.10.51
![]()
Тут можно увидеть новые, устоявшиеся и любые другие соединения. В колонке Connection Mark отображается метки пакетов – удобно диагностировать при Dual WAN.
Passthrough
Очень полезная функция, которая ничего не делает.
Допустим, вы хотите заблокировать определённый порт на входящем или проходящем трафике, но переживаете что-то поломать.
Открываем IP – Firewall и создаём правило:
Если входящий трафик с 192.168.10.51 по протоколу ICMP…

… Action – passthrough

Теперь данное правило ставим выше, предполагаемого блокируемого.
Отправляю эхо-запрос и вижу, что счётчик Bytes и Packets – тикнули. Улавливаете?

Т.е. если есть пакет, подходящий под это правило, мы ничего не делаем, ну кроме тика счётчика. Данная штука так же работает и для маркировки (Mangle). Главное двигайте его правильно.
Sniffer
Ещё одна полезная фикция в микротик находится Tools – Packet Sniffer позволяет захватывать и анализировать трафик. Доступны разные фильтры.

Сохранять дамп на диск указав максимальный его размер в File Limit. Memory Limit указывает на объем занимаемый в ОЗУ самого снифера.

Так же увидеть направление пакетов, протокол, размер в Packets. И дополнительную информацию в Connections, Hosts, Protocols.

Есть возможность передачи прослушанного трафика на удалённый сервер. Для этих целей подойдёт Wireshark на вашем ПК или ноутбуке.

Доступен так же в CLI. Можно просмотреть входящий/исходящий трафик по определённым портам, очень удобно при диагностировании блокировки L2TP/IPSEC со стороны провайдера, указав их через запятую. Стрелочки, отображают направление.

Profile
Просмотреть нагрузку на само устройство можно через Profile. У ребят, которые не закрывают DNS снаружи, колонка Usage будет в 100%. Есть возможность фильтрации по ядрам.

Bandwidth Test
Bandwidth Test Клиент-серверная утилита созданная компанией mikrotik, позволяет проверить скорость соединения между устройствами по протоколу UDP (порт 2000). Достаточно сильно нагружает процессор на больших скоростях иди маленьких ЦП. Есть инструмент для скачивания на Windows, а также общедоступные сервера в интернете. Доступен в меню Tools.

Кнопкой enable включаем инструмент. Галочка Authenticate разрешает аутентифицироваться под пользователем RouterOS (System – Users).

Так же есть встроенная версия клиента. Вы можете замерить скорость как по UDP так и по TCP. Выбрать направления (Direction), приём, передача или сразу оба. Задать логин и пароль для аутентификации на уделённой стороне.

В самом низу представлен удобный график. Можете мерить скорости внутри VPN или LAN, между мостами и офисами или промежуточных узлов.
89 вопросов по настройке MikroTik
Вы хорошо разбираетесь в Микротиках? Или впервые недавно столкнулись с этим оборудованием и не знаете, с какой стороны к нему подступиться? В обоих случаях вы найдёте для себя полезную информацию в курсе «Настройка оборудования MikroTik». 162 видеоурока, большая лабораторная работа и 89 вопросов, на каждый из которых вы будете знать ответ. Подробности и доступ к началу курса бесплатно тут.
Від
vit75
Подключил в сеть Микротик, настроил Хотспот, страницу с авторизацией хотспота, подменил сообщением о отключении за долг. На основном микротике должников прокидывает по дст-нат на ір хотспота (пробовал нетмап и редиркет).
Так вот большинство сайтов с ssl, по https, например https://www.pravda.com.ua/, https://meta.ua/uk/, https://megogo.ua/ua прокидывает, то есть вместо них показывает сообщение о долге, а https://www.facebook.com/ и https://www.google.com.ua/ — нет. Пишет — сервер неожиданно разорвал подключение.
Возможно ли решить и как?
По snmp снимать входящие ошибки. В счетчике ifInErrors все подряд. Статус дуплекса есть в EtherLike-MIB как и множество других счетчиков.
input errors overrun
На шасси с установленной свичевой картой. Ошибки overrun вызваны недостаточной производительностью маршрутизатора. Причем ситуацию в конкретном случае можно усугубить. Для этого достаточно в таких маршрутизаторах использовать свичевые карты, чтобы трафик передавался через внутренний интерфейс Ba0/3. Cудя по таблице iftable, счетчики ошибок будут расти быстрее на этом интерфейсе при использовании свичевой карты с гигабитными портами.
В качестве примера вывод счетчиков с маршрутизатора cisco 1921
cisco1921# sh int | in overr|^GigabitEthernet0/[01]
     0 input errors, 0 CRC, 0 frame, 0 overrun, 0 ignored
GigabitEthernet0/0 is up, line protocol is up
     48677539 input errors, 0 CRC, 0 frame, 48677539 overrun, 0 ignored
GigabitEthernet0/1 is up, line protocol is up
     4533642 input errors, 0 CRC, 0 frame, 4533642 overrun, 0 ignored
input errors ignored
Недостаточная производительность. От приоритезации толку нет, будут дропы в голосе и видео.
98559 input errors, 0 CRC, 0 frame, 0 overrun, 98559 ignored
input errors unknown protocol drops
Вероятно LLDP включен на коммутаторе и маршрутизатором не поддерживается.
2238654 unknown protocol drops
input errors CRC
Проверить физику, дуплекс. Возможно небольшое колво ошибок при включении интерфейса.
59 input errors, 59 CRC, 0 frame, 0 overrun, 0 ignored
output drops
При настроенных на ограничение скорости политиках счетчик малоинформативен.
Input queue: 0/75/1/0 (size/max/drops/flushes); Total output drops: 3354485
input errors runts
Порт настроен в access, а на удаленной в trunk если ошибки постоянно растут.
32 runts, 0 giants, 0 throttles
32 input errors, 0 CRC, 0 frame, 0 overrun, 0 ignored
input errors FCS
Менять SFP, порт оборудование на удаленной стороне.
Но это не точно поможет, т.к. если коммутатор на удаленной стороне работает в Cut-Through режиме коммутации, то фрейм с ошибкой мог передаться с предыдущего сетевого оборудования.
Возможно не работает автосогласование дуплекса. На 100мбит оптических линках это возможно. /network/eltex/#negotiation
input errors CRC
Проверить физику, дуплекс. На оптических линках возникает при заломах пачкорда, поэтому не надо его наматывать на органайзеры.
Ошибки могут возникать, если на одномодовом участке волс есть многомодовый патчкорд или пигтейл.
output discards
- если есть qos, смотреть очереди, буферы. Вот тут и начиаешь ценить коммутаторы со счетчиками очередей.
- speed mismatch (аплинк 1Gbit/s, downlink 100Mbit/s). Потери из-за burst, который не смог буферизировать коммутатор. Большинство свичей с shared буфером на всех портах.
дропы из-за неудачной модели
При выключенном на всех портах flowcontrol на тестах работает все медленно.
Счетчика ошибок нет. Смотреть и сравнивать счетчики на аплинке и даунлике.
Если не одинаково, то ставить другую модель коммутатора.
дропы из-за переподписки
На модульных коммутаторах при использовании плат с переподпиской возможны ошибки. Обратить внимание, что порты сгруппированы и не испольовать часть портов.
Flags: X — disabled, D — dynamic, R — running
#
NAME
0
R ether1
[admin@MikroTik] > interface ethernet
[admin@MikroTik] interface ethernet> print
Flags: X — disabled, R — running
#
NAME
0
R ether1
[admin@MikroTik] interface ethernet> print detail
Flags: X — disabled, R — running
0
R name=»ether1″ mtu=1500 mac-address=00:0C:42:03:00:F2 arp=enabled
disable-running-check=yes auto-negotiation=yes full-duplex=yes
cable-settings=default speed=100Mbps
[admin@MikroTik] interface ethernet>
Command name: /interface ethernet monitor
Property Description
status ( link-ok | no-link | unknown ) — status of the interface, one of the:
• link-ok — the card has connected to the network
• no-link — the card has not connected to the network
• unknown — the connection is not recognized
rate ( 10 Mbps | 100 Mbps | 1 Gbps ) — the actual data rate of the connection
auto-negotiation ( done | incomplete ) — fast link pulses (FLP) to the adjacent link station to
negotiate the SPEED and MODE of the link
• done — negotiation done
• incomplete — negotiation failed
full-duplex ( yes | no ) — whether transmission of data occurs in two directions simultaneously
Notes
See the
IP Addresses and ARP
the interfaces.
Example
[admin@MikroTik] interface ethernet> monitor ether1,ether2
status: link-ok link-ok
auto-negotiation: done
rate: 100Mbps 100Mbps
full-duplex: yes
Troubleshooting
Description
•
Interface monitor shows wrong information
In some very rare cases it is possible that the device driver does not show correct information,
Page 186 of 695
Copyright 1999-2007, MikroTik. All rights reserved. Mikrotik, RouterOS and RouterBOARD are trademarks of Mikrotikls SIA.
Other trademarks and registred trademarks mentioned herein are properties of their respective owners.
TYPE
ether
MTU
1500
section of the manual for information how to add IP addresses to
done
yes
RX-RATE
TX-RATE
0
0
MAC-ADDRESS
00:0C:42:03:00:F2 enabled
MTU
1500
ARP
Продолажем активно использовать оборудование Mikrotik , данная заметка касается диагностика портов, диагностика кабеля.
/interface ethernet monitor ether1
name: ether1-uplink
status: link-ok
auto-negotiation: done
rate: 100Mbps
full-duplex: yes
tx-flow-control: no
rx-flow-control: no
advertising: 10M-half,10M-full,100M-half,100M-full
link-partner-advertising: 10M-half,10M-full,100M-half,100M-full
Начиная с версии RouterOS V6rc4, появилась возможность определения проблем с кабелем:
/interface ethernet cable-test ether2
name: ether2
status: link-ok
# или
name: ether2
status: no-link
cable-pairs: open:6,open:6,open:6,open:6
В первом случае проблем нет, во втором 4 пары открыты на расстоянии 6 метров от коммутатора.
Более подробно можно посмотреть на станице официальной документации Mikrotik — http://wiki.mikrotik.com/wiki/Manual:Interface/Ethernet
Размещено в разделе Mikrotik
25.02.2015
Приветствую господа.
Мучаюсь над проблемой уже неделю.
В логах на роутере Mikrotik RB750GL периодически начинают появляться ошибки и падать все интерфейсы:
Aug/08/2016 14:16:24 interface,warning 1WAN_KTelecom excessive broadcasts/multicasts, probably a loop
Aug/08/2016 14:16:24 interface,warning 2LANMaster excessive broadcasts/multicasts, probably a loop
Aug/08/2016 14:16:24 interface,warning 3WAN_DOMRU excessive broadcasts/multicasts, probably a loop
Aug/08/2016 14:16:24 interface,warning 5IPTV excessive broadcasts/multicasts, probably a loop
Появление ошибки изо дня в день хаотично. Сегодня один интерфейс, завтра другой, послезавтра все вместе.
Начал с поисков петли, офис небольшой, обошел лично все розетки, нет петель. Пара свичей, один марштрутник для тестового железа (на нем своя подсеть внутри, которая не пересекается с рабочей подсетью)
Отключал полностью на Микротике порт с локальной сети, ошибки продолжаются.
Блокировал входящий трафик на внешних портах от локльных IP.
Отключал по очереди внешние интефейсы.
Отключал все правила в разделе Mangle, ошибка продолжается.
Отключал все правила в разделе NAT, ошибка продолжается.
IGMP отключал
IPv6 отключен (удален пакет из микротик)
Раньше с такой бедой не сталкивался. В конфигурациях вроде все правильно, несколько раз проверил маршруты, маркеры. Трафик ходит хорошо.
Но как только начинает сыпать эта ошибка, периодически падают все интерфейсы на несколько секунд.
Потом поднимаются, и ошибка повторяется через время. Перезагрузка роутера спасает ненадолго.
Может кто сталкивался с подобной проблемой? Подскажет в какую сторону копать?
Трафик снифером собирал во время появления ошибок, открывал в Wireshark. Ничего интересного самостоятельно найти не смог.
Думаю уже роутер новый поставить.

Столкнулся с проблемой на MikroTik – ошибки в логах и отсутствие интернета на порту Ether1. Стал искать ответ в интернете, но решения не нашел. Существует предположение, что проблема появления ошибки interface,warning ether1 fcs error on link связана с наводками от кабелей 220v.
К сожалению, проблема не имеет стойкого графика появления. Цикл между ошибками разный, может быть неделя, а может быть и пару месяцев. Помогает либо полная перезагрузка MikroTik или отключение порта. До текущего момента мы делали это вручную, после был найден скрипт. К сожалению автора скрипта, найти не удалось. Но раз ошибка популярная, то думаю не лишним будет его указать, как решение проблемы.
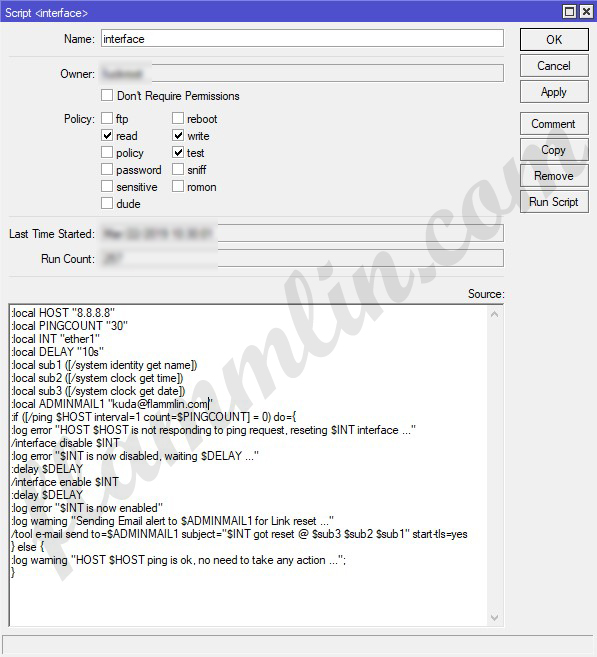
Скрипт выглядит так:
|
1 2 3 4 5 6 7 8 9 10 11 12 13 14 15 16 17 18 19 20 21 22 23 24 25 26 27 |
/system script add dont—require—permissions=no name=interface owner=admin policy=\ read,write,test source=«:local HOST \»8.8.8.8\»\r\ \n:local PINGCOUNT \»30\»\r\ \n:local INT \»ether1\»\r\ \n:local DELAY \»10s\»\r\ \n:local sub1 ([/system identity get name])\r\ \n:local sub2 ([/system clock get time])\r\ \n:local sub3 ([/system clock get date])\r\ \n:local ADMINMAIL1 \»kuda@flammlin.com\»\r\ \n:if ([/ping \$HOST interval=1 count=\$PINGCOUNT] = 0) do={\r\ \n:log error \»HOST \$HOST is not responding to ping request, reseting \$I\ NT interface …\»\r\ \n/interface disable \$INT\r\ \n:log error \»\$INT is now disabled, waiting \$DELAY …\»\r\ \n:delay \$DELAY\r\ \n/interface enable \$INT\r\ \n:delay \$DELAY\r\ \n:log error \»\$INT is now enabled\»\r\ \n:log warning \»Sending Email alert to \$ADMINMAIL1 for Link reset …\»\ \r\ \n/tool e-mail send to=\$ADMINMAIL1 subject=\»\$INT got reset @ \$sub3 \$s\ ub2 \$sub1\» start-tls=yes\r\ \n} else {\r\ \n:log warning \»HOST \$HOST ping is ok, no need to take any action …\»;\ \r\ \n}» |
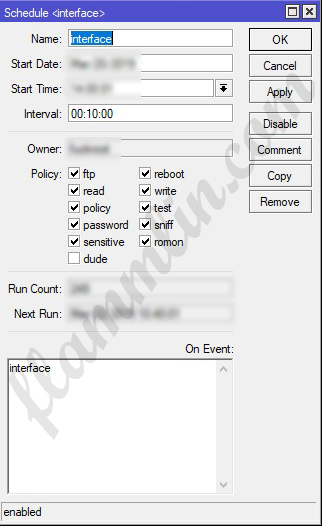
В промежуток времени (задается через планировщик) происходит запуск скрипта, который пингует доступность 8.8.8.8.
|
/system scheduler add interval=10m name=interface on—event=interface policy=\ ftp,reboot,read,write,policy,test,password,sniff,sensitive,romon |
В случае успешного пинга в логах происходит запись:
|
script,warning HOST 8.8.8.8 ping is ok, no need to take any action ... |
Если пинг 8.8.8.8 не работает, то происходит отключение интерфейса ether1, через задержку происходит включение интерфейса ether1.
Появляется соответствующая запись в логах:
|
script,error HOST 1.8.8.8 is not responding to ping request, reseting ether2 interface ... |
Так же на почту происходит отправка сообщения, что интерфейс ether1 был перезапущен.
![]()
Applies to RouterOS: v6.41 +
Introduction
There are certain configuration that are known to have major flaws by design and should be avoided by all means possible. Misconfigured Layer2 can sometimes cause hard to detect network errors, random performance drops, certain segments of a network to be unreachable, certain networking services to be malfunctioning or a complete network failure. This page will contain some common and not so very common configurations that will cause issues in your network.
Bridges on a single switch chip
Consider the following scenario, you have a device with a built-in switch chip and you need to isolate certain ports from each other, for this reason you have created multiple bridges and enabled hardware offloading on them. Since each bridge is located on a different Layer2 domain, then Layer2 frames will not be forwarded between these bridges, as a result ports in each bridge are isolated from other ports in a different bridge.
Configuration
/interface bridge
add name=bridge1
add name=bridge2
/interface bridge port
add bridge=bridge1 interface=ether1
add bridge=bridge1 interface=ether2
add bridge=bridge2 interface=ether3
add bridge=bridge2 interface=ether4
Problem
After a simple performance test you might notice that one bridge is capable of forwarding traffic at wire-speed while the second, third, … bridge is not able to forward as much data as the first bridge. Another symptom might be that there exists a huge latency for packets that need to be routed. After a quick inspection you might notice that the CPU is always at full load, this is because hardware offloading is not available on all bridges, but is available only on one bridge. By checking the hardware offloading status you will notice that only one bridge has it active:
[admin@MikroTik] > /interface bridge port print
Flags: X - disabled, I - inactive, D - dynamic, H - hw-offload
 #     INTERFACE                                 BRIDGE                                 HW
 0   H ether1                                    bridge1                                yes
 1   H ether2                                    bridge1                                yes
 2     ether3                                    bridge2                                yes
 3     ether4                                    bridge2                                yes
The reason why only one bridge has the hardware offloading flag available is because the device does not support port isolation. If port isolation is not supported, then only one bridge will be able to offload the traffic to the switch chip.
Symptoms
Below is a list of possible symptoms that might be as a result of this kind of a misconfiguration:
- Missing «H» flag to bridge ports
- Low throughput
- High CPU usage
Solution
Not all device devices support port isolation, currently only CRS1xx/CRS2xx series devices support it and only 7 isolated and hardware offloaded bridges are supported at the same time, other devices will have to use the CPU to forward the packets on other bridges. This is usually a hardware limitation and a different device might be required. Bridge split horizon parameter is a software feature that disables hardware offloading and when using bridge filter rules you need to enable forward all packets to the CPU, which requires the hardware offloading to be disabled. You can control which bridge will be hardware offloaded with the hw=yes flag and by setting hw=no to other bridges, for example:
/interface bridge port set [find where bridge=bridge1] hw=no
/interface bridge port set [find where bridge=bridge2] hw=yes
Sometimes it is possible to restructure a network topology to use VLANs, which is the proper way to isolate Layer2 networks.
Packet flow with hardware offloading and MAC learning
Consider the following scenario, you setup a bridge and have enabled hardware offloading in order to maximize the throughput for your device, as a result your device is working as a switch, but you want to use Sniffer or Torch tools for debugging purposes, or maybe you want to implement packet logging.
Configuration
/interface bridge
add name=bridge1
/interface bridge port
add bridge=bridge1 hw=yes interface=ether1 learn=yes
add bridge=bridge1 hw=yes interface=ether2 learn=yes
Problem
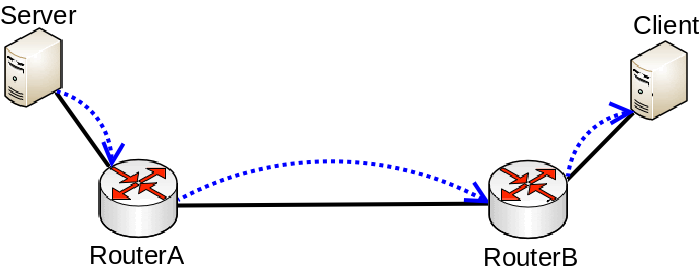
When running Sniffer or Torch tool to capture packets you might notice that barely any packets are visible, only some unicast packets, but mostly broadcast/multicast packets are captured, while the interfaces report that much larger traffic is flowing through certain interfaces than the traffic that was captured. Since RouterOS v6.41 if you add two or more Ethernet interfaces to a bridge and enable Hardware Offloading, then the switch chip will be used to forward packets between ports. To understand why only some packets are captured, we must first examine how the switch chip is interconnected with the CPU, in this example we can use a block diagram from a generic 5-Port EThernet router:
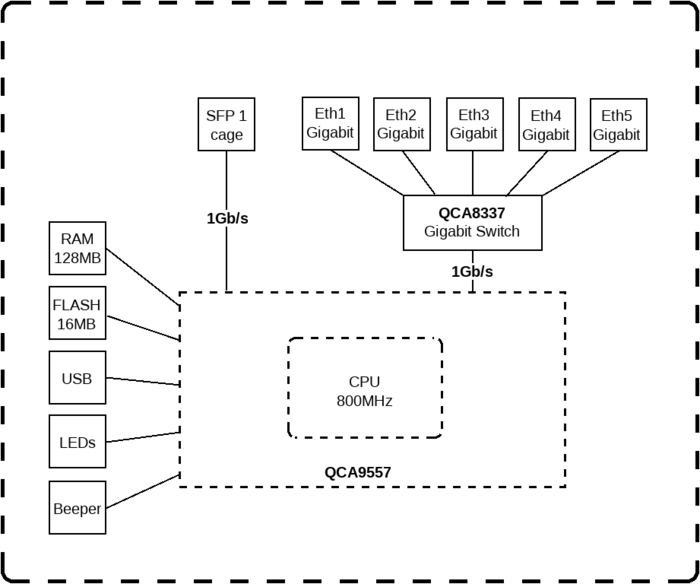
For this device each Ethernet port is connected to the switch chip and the switch chip is connected to the CPU using the CPU port (sometimes called the switch-cpu port). For packets to be visible in Sniffer tools, the packet must be sent from an Ethernet port to the CPU port, this means that the packet must be destined to the CPU port (destination MAC address of the packet matches the bridge’s MAC address) or the packet’s MAC address has not be learnt (packet is flooded to all ports), this behavior is because of MAC learning·
The switch chip keeps a list of MAC addresses and ports called the Hosts table· Whenever a packet needs to be forwarded, the switch chip checks the packet’s destination MAC address against the hosts table to find which port should it use to forward the packet. If the switch chip cannot find the destination MAC address, then the packet is flooded to all ports (including the CPU port). In situations where packet is supposed to be forwarded from, for example, ether1 to ether2 and the MAC address for the device behind ether2 is in the hosts table, then the packet is never sent to the CPU and therefore will not be visible to Sniffer or Torch tool.
Symptoms
Below is a list of possible symptoms that might be as a result of this kind of a misconfiguration:
- Packets not visible by Sniffer or Torch tool
- Filter rules not working
Solution
Packets with a destination MAC address that has been learned will not be sent to the CPU since the packets are not not being flooded to all ports. If you do need to send certain packets to the CPU for packet analyser or for Firewall, then it is possible to copy or redirect the packet to the CPU by using ACL rules. Below is an example how to send a copy of packets that are meant for 4C:5E:0C:4D:12:4B:
/interface ethernet switch rule
add copy-to-cpu=yes dst-mac-address=4C:5E:0C:4D:12:4B/FF:FF:FF:FF:FF:FF ports=ether1 switch=switch1
![]()
Note: If the packet is sent to the CPU, then the packet must be processed by the CPU, this increases the CPU load.
LAG interfaces and load balancing
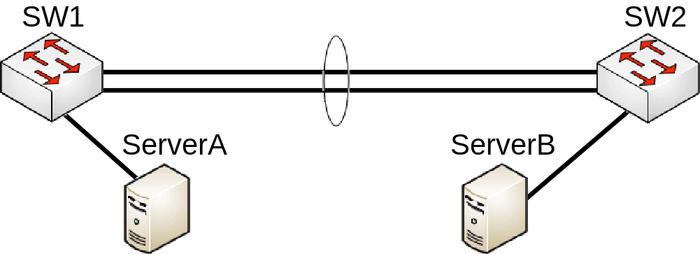
Consider the following scenario, you have created a LAG interface to increase total bandwidth between 2 network nodes, usually these are switches. For testing purposes to make sure that LAG interface is working properly you have attached two servers that transfer data, most commonly the well known network performance measurement tool https://en.wikipedia.org/wiki/Iperf is used to test such setups. For example, you might have made a LAG interface out of two Gigabit Ethernet ports, which gives you a 2Gbps interface while the servers are connected using a 10Gbps interface, for example, SFP+.
Configuration
The following configuration is relevant to SW1 and SW2:
/interface bonding
add mode=802.3ad name=bond1 slaves=ether1,ether2
/interface bridge
add name=bridge1
/interface bridge port
add bridge=bridge1 interface=bond1
add bridge=bridge1 interface=sfp-sfpplus1
Problem
After initial tests you immediately notice that the your network throughput never exceeds the 1Gbps limit even though the CPU load on the servers is low as well as on the network nodes (switches in this case), but the throughput is still limited to only 1Gbps. The reason behind this is because LACP (802.ad) uses transmit hash policy in order to determine if traffic can be balanced over multiple LAG members, in this case a LAG interface does not create a 2Gbps interface, but rather an interface that can balance traffic over multiple slave interface whenever it is possible. For each packet a transmit hash is generated, this determines through which LAG member will the packet be sent, this is needed in order to avoid packets being out of order, there is an option to select the transmit hash policy, usually there is an option to choose between Layer2 (MAC), Layer3 (IP) and Layer4 (Port), in RouterOS this can be selected by using the transmit-hash-policy parameter. In this case the transmit hash is the same since you are sending packets to the same destination MAC address, as well as the same IP address and Iperf uses the same port as well, this generates the same transmit hash for all packets and load balancing between LAG members is not possible. Note that not always packets will get balanced over LAG members even though the destination is different, this is because the standardized transmit hash policy can generate the same transmit hash for different destinations, for example, 192.168.0.1/192.168.0.2 will get balanced, but 192.168.0.2/192.168.0.4 will NOT get balanced in case layer2-and-3 transmit hash policy is used and the destination MAC address is the same.
Symptoms
Below is a list of possible symptoms that might be as a result of this kind of a misconfiguration:
- Traffic going through only one LAG member
Solution
Choose the proper transmit hash policy and test your network’s throughput properly. The simplest way to test such setups is to use multiple destinations, for example, instead of sending data to just one server, rather send data to multiple servers, this will generate a different transmit hash for each packet and will make load balancing across LAG members possible. For some setups you might want to change the bonding interface mode to increase the total throughput, for UDP traffic balance-rr mode might be sufficient, but can cause issues for TCP traffic, you can read more about selecting the right mode for your setup Here.
VLAN interface on a slave interface
Consider the following scenario, you have created a bridge and you want a DHCP Server to give out IP addresses only to a certain tagged VLAN traffic, for this reason you have created a VLAN interface, specified a VLAN ID and created a DHCP Server on it, but for some reasons it is not working properly.
Configuration
/interface bridge
add name=bridge1
/interface bridge port
add interface=ether1 bridge=bridge1
add interface=ether2 bridge=bridge1
/interface vlan
add name=VLAN99 interface=ether1 vlan-id=99
/ip pool
add name=VLAN99_POOL range=192.168.99.100-192.168.99.200
/ip address add address=192.168.99.1/24 interface=VLAN99
/ip dhcp-server
add interface=VLAN99 address-pool=VLAN99_POOL disabled=no
/ip dhcp-server network
add address=192.168.99.0/24 gateway=192.168.99.1 dns-server=192.168.99.1
Problem
When you add an interface to a bridge, the bridge becomes the master interface and all bridge ports become slave ports, this means that all traffic that is received on a bridge port is captured by the bridge interface and all traffic is forwarded to the CPU using the bridge interface instead of the physical interface. As a result VLAN interface that is created on a slave interface will never capture any traffic at all since it is immediately forwarded to the master interface before any packet processing is being done. Usual side effect is that some DHCP clients receive IP addresses and some don’t.
Symptoms
Below is a list of possible symptoms that might be as a result of this kind of a misconfiguration:
- DHCP Client/Server not working properly
- Device is unreachable
- Device behind a bridge is unreachable with tagged traffic
Solution
Change the interface on which the VLAN interface will be listening for traffic, change it to the master interface:
/interface vlan set VLAN99 interface=bridge
VLAN on a bridge in a bridge
Consider the following scenario, you have a set of interfaces (don’t have to be physical interfaces) and you want all of them to be in the same Layer2 segment, the solution is to add them to a single bridge, but you require that traffic from one port tags all traffic into a certain VLAN. This can be done by creating a VLAN interface on top of the bridge interface and by creating a separate bridge that contains this newly created VLAN interface and an interface, which is supposed to add a VLAN tag to all received traffic. Network diagram can be found below:
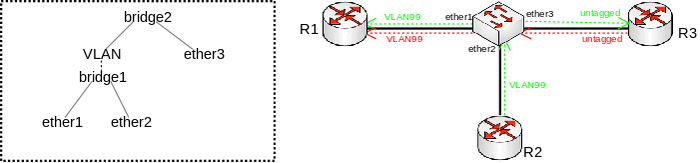
VLAN on bridge in bridge topology
Configuration
/interface bridge
add name=bridge1
add name=bridge2
/interface vlan
add interface=bridge1 name=VLAN vlan-id=99
/interface bridge port
add bridge=bridge1 interface=ether1
add bridge=bridge1 interface=ether2
add bridge=bridge2 interface=VLAN
add bridge=bridge2 interface=ether3
Problem
To better understand the underlying problems, lets first look on bridge host table.
[admin@switch] /interface bridge host print where !local
Flags: X - disabled, I - invalid, D - dynamic, L - local, E - external
 #       MAC-ADDRESS        VID ON-INTERFACE    BRIDGE   AGE
 0   D   CC:2D:E0:E4:B3:A1      ether1          bridge1  42s
 1   D   CC:2D:E0:E4:B3:A2      ether2          bridge1  42s
 2   D   CC:2D:E0:E4:B3:A1      VLAN            bridge2  42s
 3   D   CC:2D:E0:E4:B3:A2      VLAN            bridge2  42s
 4   D   CC:2D:E0:E4:B3:A3      ether3          bridge2  42s
Devices on ether1 and ether2 need to send tagged packets with VLAN-ID 99 in order to reach the host on ether3 (other packets do not get passed towards VLAN interface and further bridged with ether3). We can see in the host table that bridge2 have learned these hosts. Packets coming from ether3 to ether1 will be correctly sent out tagged and traffic will not be flooded in bridge1. But since MAC learning is only possible between bridge ports and not on interfaces that are created on top of the bridge interface, packets sent from ether2 to ether3 will be flooded in bridge1.
Also if a device behind ether3 is using (R)STP, then ether1 and ether2 will send out tagged BPDUs which violates the IEEE 802.1W standard.
Because of the broken MAC learning functionality and broken (R)STP this setup and configuration must be avoided.
It is also known that in some setups this kind of configuration can prevent you from connecting to the device by using MAC telnet.
Symptoms
Below is a list of possible symptoms that might be as a result of this kind of a misconfiguration:
- Port blocked by RSTP
- Loops in network
- Port flapping
- Traffic is flooded to all ports
- MAC telnet is unable to connect
- Device inaccessible
Solution
Use bridge VLAN filtering. The proper way to tag traffic is to assign a VLAN ID whenever traffic enters a bridge, this behaviour can easily be achieved by specifying PVID value for a bridge port and specifying which ports are tagged (trunk) ports and which are untagged (access) ports. Below is an example how such setup should have been configured:
/interface bridge
add name=bridge1 vlan-filtering=yes
/interface bridge port
add bridge=bridge1 interface=ether1
add bridge=bridge1 interface=ether2
add bridge=bridge1 interface=ether3 pvid=99
/interface bridge vlan
add bridge=bridge1 tagged=ether1,ether2 untagged=ether3 vlan-ids=99
![]()
Warning: By enabling vlan-filtering you will be filtering out traffic destined to the CPU, before enabling VLAN filtering you should make sure that you set up a Management port
VLAN in bridge with a physical interface
Very similar case to VLAN on a bridge in a bridge, there are multiple possible scenarios where this could could have been used, most popular use case is when you want to send out tagged traffic through a physical interface, in such a setup you want traffic from one interface to receive only certain tagged traffic and send out this tagged traffic as tagged through a physical interface (simplified trunk/access port setup) by just using VLAN interfaces and a bridge.
Configuration
/interface vlan
add interface=ether1 name=VLAN99 vlan-id=99
/interface bridge
add name=bridge1
/interface bridge port
add interface=ether2 bridge=bridge1
add interface=VLAN99 bridge=bridge1
Problem
This setup and configuration will work on most cases, but it violates the IEEE 802.1W standard when (R)STP is used. If this is the only device in your Layer2 domain, then this should not cause problems, but problems can arise when there are other vendor switches. The reason for this is that (R)STP on a bridge interface is enabled by default and BPDUs coming from ether1 will be sent out tagged since everything sent into ether1 will be sent out through ether2 as tagged traffic, not all switches can understand tagged BPDUs. Precautions should be made with this configuration in a more complex network where there are multiple network topologies for certain (group of) VLANs, this is relevant to MSTP and PVSTP(+) with mixed vendor devices. In a ring-like topology with multiple network topologies for certain VLANs, one port from the switch will be blocked, but in MSTP and PVSTP(+) a path can be opened for a certain VLAN, in such a situation it is possible that devices that don’t support PVSTP(+) will untag the BPDUs and forward the BPDU, as a result the switch will receive its own packet, trigger a loop detection and block a port, this can happen to other protocols as well, but (R)STP is the most common case. If a switch is using a BPDU guard function, then this type of configuration can trigger it and cause a port to be blocked by STP. It has been reported that this type of configuration can prevent traffic from being forwarded over certain bridge ports over time when using 6.41 or later. This type of configuration does not only break (R/M)STP, but it can cause loop warnings, this can be caused by MNDP packets or any other packets that are directly sent out from an interface.
Symptoms
Below is a list of possible symptoms that might be as a result of this kind of a misconfiguration:
- Port blocked by RSTP
- Loops in network
- Port flapping
- Traffic stops forwarding over time
- BPDUs ignored by other RSTP enabled devices
Solution
To avoid compatibility issues you should use bridge VLAN filtering. Below you can find an example how the same traffic tagging effect can be achieved with a bridge VLAN filtering configuration:
/interface bridge
add name=bridge1 vlan-filtering=yes
/interface bridge port
add bridge=bridge1 interface=ether1 pvid=99
add bridge=bridge1 interface=ether2
/interface bridge vlan
add bridge=bridge1 tagged=ether2 untagged=ether1 vlan-ids=99
![]()
Warning: By enabling vlan-filtering you will be filtering out traffic destined to the CPU, before enabling VLAN filtering you should make sure that you set up a Management port
Bridged VLAN on physical interfaces
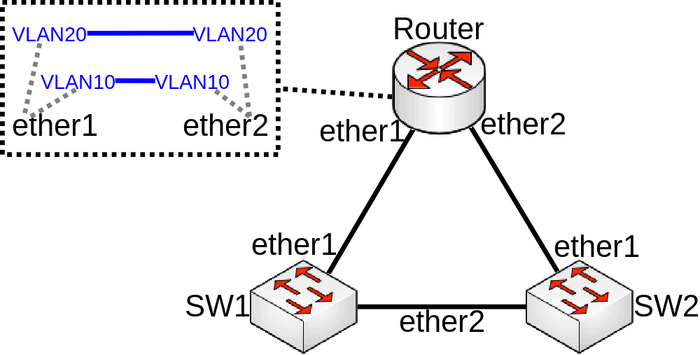
Very similar case to VLAN on a bridge in a bridge, consider the following scenario, you have a couple of switches in your network and you are using VLANs to isolate certain Layer2 domains and connect these switches are connected to a router that assigns addresses and routes the traffic to the world. For redundancy you connect switches all switches directly to the router and have enabled RSTP, but to be able to setup DHCP Server you decide that you can create a VLAN interface for each VLAN on each physical interface that is connected to a switch and add these VLAN interfaces in a bridge. Network diagram can be found bellow:
Configuration
Only the router part is relevant to this case, switch configuration doesn’t really matter as long as ports are switched. Router configuration can be found bellow:
/interface bridge
add name=bridge10
add name=bridge20
/interface vlan
add interface=ether1 name=ether1_v10 vlan-id=10
add interface=ether1 name=ether1_v20 vlan-id=20
add interface=ether2 name=ether2_v10 vlan-id=10
add interface=ether2 name=ether2_v20 vlan-id=20
/interface bridge port
add bridge=bridge10 interface=ether1_v10
add bridge=bridge10 interface=ether2_v10
add bridge=bridge20 interface=ether1_v20
add bridge=bridge20 interface=ether2_v20
Problem
You might notice that the network is having some weird delays or even the network is unresponsive, you might notice that there is a loop detected (packet received with own MAC address) and some traffic is being generated out of nowhere. The problem occurs because a broadcast packet that is coming from either one of the VLAN interface created on the Router will be sent out the physical interface, packet will be forwarded through the physical interface, through a switch and will be received back on a different physical interface, in this case broadcast packets sent out ether1_v10 will be received on ether2, packet will be captured by ether2_v10, which is bridged with ether1_v10 and will get forwarded again the same path (loop). (R)STP might not always detect this loop since (R)STP is not aware of any VLANs, a loop does not exist with untagged traffic, but exists with tagged traffic. In this scenario it is quite obvious to spot the loop, but in more complex setups it is not always easy to detect the network design flaw. Sometimes this network design flaw might get unnoticed for a very long time if your network does not use broadcast traffic, usually Nieghbor Discovery Protocol is broadcasting packets from the VLAN interface and will usually trigger a loop detection in such a setup. Sometimes it is useful to capture the packet that triggered a loop detection, this can by using sniffer and analysing the packet capture file:
/tool sniffer
set filter-mac-address=4C:5E:0C:4D:12:44/FF:FF:FF:FF:FF:FF \
filter-interface=ether1 filter-direction=rx file-name=loop_packet.pcap
Or a more convenient way using logging:
/interface bridge filter
add action=log chain=forward src-mac-address=4C:5E:0C:4D:12:44/FF:FF:FF:FF:FF:FF
add action=log chain=input src-mac-address=4C:5E:0C:4D:12:44/FF:FF:FF:FF:FF:FF
Symptoms
Below is a list of possible symptoms that might be as a result of this kind of a misconfiguration:
- Port blocked by (R)STP
- Loops in network
- Low throughput
- Port flapping
- Network inaccessible
Solution
Partial solution is to use Multiple Spanning Tree Protocol across the whole network, but it is required to use bridge VLAN filtering in order to make all bridges compatible with IEEE 802.1W and IEEE 802.1Q.
/interface bridge
add name=bridge vlan-filtering=yes
/interface bridge port
add bridge=bridge interface=ether1
add bridge=bridge interface=ether2
/interface bridge vlan
add bridge=bridge tagged=ether1,ether2,bridge vlan-ids=10,20
/interface vlan
add name=vlan10 interface=bridge vlan-id=10
add name=vlan20 interface=bridge vlan-id=20
Even though rewriting your configuration to use bridge VLAN filtering will fix loop occurrence because of broadcast traffic that is coming from a VLAN interface, there still might exist loops with tagged unknown unicast or broadcast traffic. To make sure that loops don’t exist with tagged and untagged traffic you should consider implementing MSTP in your network instead of (R)STP.
![]()
Warning: By enabling vlan-filtering you will be filtering out traffic destined to the CPU, before enabling VLAN filtering you should make sure that you set up a Management port
Bridged VLAN
A more simplified scenario of Bridged VLAN on physical interfaces, but in this case you simply want to bridge two or more VLANs together that are created on different physical interfaces. This is a very common type of setup that deserves separate article since misconfiguring this type of setup has caused multiple network failures. This type of setup is also used for VLAN translation.
Configuration
/interface vlan
add interface=ether1 name=ether1_v10 vlan-id=10
add interface=ether2 name=ether2_v10 vlan-id=10
/interface bridge
add name=bridge1
/interface bridge port
add bridge=bridge1 interface=ether1_v10
add bridge=bridge1 interface=ether2_v10
Problem
You may notice that certain parts of network is not accessible and/or certain links keep flapping. This is due to (R)STP, this type of configuration forces the device to send out tagged BPDUs, that might not be supported by other devices, including RouterOS. Since a device receives a malformed packet (tagged BPDUs should not exist in your network when running (R)STP, this violates IEEE 802.1W and IEEE 802.1Q), the device will not interpret the packet correctly and can have unexpected behaviour.
Symptoms
Below is a list of possible symptoms that might be as a result of this kind of a misconfiguration:
- Port blocked by (R)STP
- Port flapping
- Network inaccessible
Solution
The easiest solution is to simply disable (R)STP on the bridge:
/interface bridge
set bridge1 protocol-mode=none
though it is still recommended to rewrite your configuration to use bridge VLAN filtering:
/interface bridge
add name=bridge1 vlan-filtering=yes
/interface bridge port
add bridge=bridge1 interface=ether1
add bridge=bridge1 interface=ether2
/interface bridge vlan
add bridge=bridge1 tagged=ether1,ether2 vlan-ids=10
![]()
Warning: By enabling vlan-filtering you will be filtering out traffic destined to the CPU, before enabling VLAN filtering you should make sure that you set up a Management port
Bridge VLAN filtering on non-CRS3xx
Consider the following scenario, you found out the new bridge VLAN filtering feature and you decided to change the configuration on your device, you have a very simple trunk/access port setup and you like the concept of bridge VLAN filtering.
Configuration
/interface bridge
add name=bridge1 vlan-filtering=yes
/interface bridge port
add bridge=bridge1 interface=ether1
add bridge=bridge1 interface=ether2 pvid=20
add bridge=bridge1 interface=ether3 pvid=30
add bridge=bridge1 interface=ether4 pvid=40
/interface bridge vlan
add bridge=bridge1 tagged=ether1 untagged=ether2 vlan-ids=20
add bridge=bridge1 tagged=ether1 untagged=ether3 vlan-ids=30
add bridge=bridge1 tagged=ether1 untagged=ether4 vlan-ids=40
Problem
For example, you use this configuration on a CRS1xx/CRS2xx series device and you started to notice that the CPU usage is very high and when running a performance test to check the network’s throughput you notice that the total throughput is only a fraction of the wire-speed performance that it should easily reach. The cause of the problem is that not all devices support bridge VLAN filtering on a hardware level. All devices are able to be configured with bridge VLAN filtering, but only few of them will be able to offload the traffic to the switch chip. If improper configuration method is used on a device with a built-in switch chip, then the CPU will be used to forward the traffic.
Symptoms
Below is a list of possible symptoms that might be as a result of this kind of a misconfiguration:
- Missing «H» flag on bridge port
- Low throughput
- High CPU usage
Solution
Before using bridge VLAN filtering check if your device supports it at the hardware level, table with compatibility can be found at the Bridge Hardware Offloading section.
Each type of device currently requires a different configuration method, below is a list of which configuration should be used on a device in order to use benefits of hardware offloading:
- CRS3xx series devices
- CRS1xx/CRS2xx series devices
- Other devices with a switch chip
VLAN filtering with multiple switch chips
Consider the following scenario, you have a device with two or more switch chips and you have decided to use a single bridge and setup VLAN filtering (by using the /interface ethernet switch menu) on a hardware level to be able to reach wire-speed performance on your network. This is very relevant for RB2011 and RB3011 series devices. In this example, lets assume that you want to have a single trunk port and all other ports are access ports, for example, ether10 is our trunk port and ether1-ether9 are our access ports.
Configuration
/interface bridge
add name=bridge1
/interface bridge port
add bridge=bridge1 interface=ether1
add bridge=bridge1 interface=ether2
add bridge=bridge1 interface=ether3
add bridge=bridge1 interface=ether4
add bridge=bridge1 interface=ether5
add bridge=bridge1 interface=ether6
add bridge=bridge1 interface=ether7
add bridge=bridge1 interface=ether8
add bridge=bridge1 interface=ether9
add bridge=bridge1 interface=ether10
/interface vlan
add interface=bridge1 name=VLAN10 vlan-id=10
/interface ethernet switch port
set ether1,ether2,ether3,ether4,ether5,ether6,ether7,ether8,ether9 default-vlan-id=10 vlan-header=always-strip vlan-mode=secure
set ether10 vlan-header=add-if-missing vlan-mode=secure
set switch1-cpu,switch2-cpu vlan-mode=secure
/interface ethernet switch vlan
add ports=ether1,ether2,ether3,ether4,ether5,switch1-cpu switch=switch1 vlan-id=10
add ports=ether6,ether7,ether8,ether9,ether10,switch2-cpu switch=switch2 vlan-id=10
Problem
After running a few tests you might notice that packets from ether6-ether10 are forwarded as expected, but packets from ether1-ether5 are not always forwarded correctly (especially through the trunk port). Most noticeable issue would be that packets from ether1-ether5 through ether10 are simply dropped, this is because these ports are located on different switch chip, this means that VLAN filtering is not possible on a hardware level since the switch chip is not aware of the VLAN table’s contents on a different switch chip. Packets that are being forwarded between ports that are located on different switch chips are also processed by the CPU, which means you won’t be able to achieve wire-speed performance.
Symptoms
Below is a list of possible symptoms that might be as a result of this kind of a misconfiguration:
- Packets being dropped
- Low throughput
Solution
The proper solution is to take into account this hardware design and plan your network topology accordingly. To solve this issue you must create two separate bridges and configure VLAN filtering on each switch chip, this limits the possibility to forward packets between switch chip, though it is possible to configure routing between both bridges (if devices that are connected on each switch chip are using different network subnets).
There is a way to configure the device to have all ports switch together and yet be able to use VLAN filtering on a hardware level, though this solution has some caveats. The idea is to sacrifice a single Ethernet port on each switch chip that will act as a trunk ports to forward packets between switch chip, this can be done by plugging an Ethernet cable between both switch chip, for example, lets plug in an Ethernet cable between ether5 and ether6 then reconfigure your device assuming that these ports are trunk ports:
/interface bridge port
add bridge=bridge1 interface=ether1
add bridge=bridge1 interface=ether2
add bridge=bridge1 interface=ether3
add bridge=bridge1 interface=ether4
add bridge=bridge1 interface=ether5
add bridge=bridge2 interface=ether6
add bridge=bridge2 interface=ether7
add bridge=bridge2 interface=ether8
add bridge=bridge2 interface=ether9
add bridge=bridge2 interface=ether10
/interface ethernet switch port
set ether1,ether2,ether3,ether4,ether7,ether8,ether9 default-vlan-id=10 vlan-header=always-strip vlan-mode=secure
set ether5,ether6,ether10 vlan-header=add-if-missing vlan-mode=secure default-vlan-id=auto
set switch1-cpu,switch2-cpu vlan-mode=secure
/interface ethernet switch vlan
add ports=ether1,ether2,ether3,ether4,ether5,switch1-cpu switch=switch1 vlan-id=10
add ports=ether6,ether7,ether8,ether9,ether10,switch2-cpu switch=switch2 vlan-id=10
![]()
Note: For 100Mbps switch chips use default-vlan-id=0 instead of default-vlan-id=auto
MTU on master interface
Consider the following scenario, you have created a bridge, added a few interfaces to it and have created a VLAN interface on top of the bridge interface, but you need to increase the MTU size on the VLAN interface in order to receive larger packets.
Configuration
/interface bridge
add name=bridge1
/interface bridge port
add bridge=bridge1 interface=ether1
add bridge=bridge1 interface=ether2
/interface vlan
add interface=bridge1 name=VLAN99 vlan-id=99
Problem
As soon as you try to increase the MTU size on the VLAN interface, you receive an error that RouterOS Could not set MTU. This can happen when you are trying to set MTU larger than the L2MTU. In this case you need to increase the L2MTU size on all slave interfaces, which will update the L2MTU size on the bridge interface. After this has been done, you will be able to set a larger MTU on the VLAN interface. The same principle applies to bonding interfaces. You can increase the MTU on interfaces like VLAN, MPLS, VPLS, Bonding and other interfaces only when all physical slave interfaces have proper L2MTU set.
Symptoms
Below is a list of possible symptoms that might be as a result of this kind of a misconfiguration:
- Cannot change MTU
Solution
Increase the L2MTU on slave interfaces before changing the MTU on a master interface.
/interface ethernet
set ether1,ether2 l2mtu=9018
/interface vlan
set VLAN99 mtu=9000
MTU inconsistency
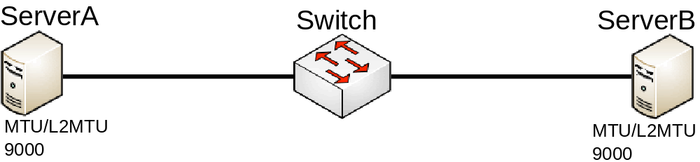
Consider the following scenario, you have multiple devices in your network, most of them are used as a switch/bridge in your network and there are certain endpoints that are supposed to receive and process traffic. To decrease the overhead in your network, you have decided to increase the MTU size so you set a larger MTU size on both endpoints, but you start to notice that some packets are being dropped.
Configuration
In this case both endpoints can be any type of device, we will assume that they are both Linux servers that are supposed to transfer large amount of data. In such a scenario you would have probably set something similar to this on ServerA and ServerB:
ip link set eth1 mtu 9000
And on your Switch you have probably have set something similar to this:
/interface bridge
add name=bridge1
/interface bridge port
add interface=ether1 bridge=bridge1
add interface=ether2 bridge=bridge1
Problem
This is a very simplified problem, but in larger networks this might not be very easy to detect. For instance, ping might be working since a generic ping packet will be 70 bytes long (14 bytes for Ethernet header, 20 bytes for IPv4 header, 8 bytes for ICMP header, 28 bytes for ICMP payload), but data transfer might not work properly. The reason why some packets might not get forwarded is that MikroTik devices running RouterOS by default has MTU set to 1500 and L2MTU set to something around 1580 bytes (depends on the device), but the Ethernet interface will silently drop anything that does not fit into the L2MTU size. Note that L2MTU parameter is not relevant to x86 or CHR devices. For a device that is only supposed to forward packets, there is no need to increase the MTU size, it is only required to increase the L2MTU size, RouterOS will not allow you to increase the MTU size that is larger than the L2MTU size. If you require the packet to be received on the interface and the device needs to process this packet rather than just forwarding it, for example, in case of routing, then it is required to increase the L2MTU and the MTU size, but you can leave the MTU size on the interface to the default value if you are using only IP traffic (that supports packet fragmentation) and don’t mind that packets are being fragmented. You can use the ping utility to make sure that all devices are able to forward jumbo frames:
/ping 192.168.88.1 size=9000 do-not-fragment
Remember that the L2MTU and MTU size needs to be larger or equal to the ping packet size on the device from which and to which you are sending a ping packet, since ping (ICMP) is IP traffic that is sent out from a interface over Layer3.
Symptoms
Below is a list of possible symptoms that might be as a result of this kind of a misconfiguration:
- Web pages are not able to load up, but ping works properly
- Tunnels dropping traffic
- Specific protocols are broken
- Large packet loss
Solution
Increase the L2MTU size on your Switch:
/interface ethernet
set ether1,ether2 l2mtu=9000
In case your traffic is encapsulated (VLAN, VPN, MPLS, VPLS or other), then you might need to consider setting even a larger L2MTU size. In this scenario it is not needed to increase the MTU size for the reason described above.
![]()
Note: Full frame MTU is not the same as L2MTU. L2MTU size does not include the Ethernet header (14 bytes) and the CRC checksum (FCS) field. The FCS field is stripped by the Ethernet’s driver and RouterOS will never show the extra 4 bytes to any packet. For example, if a you set MTU and L2MTU to 9000, then the full frame MTU is 9014 bytes long, this can also be observed when sniffing packets with /tool sniffer quick
Bridge and reserved MAC addresses
Consider the following scenario, you want to transparently bridge two network segments together, either those are tunnel interfaces like EoIP, Wireless interfaces, Ethernet interface or any other kind of interfaces that can be added to a bridge. Such setups allows you to seamlessly connect two devices together like there was only a physical cable between them, this is sometimes called a transparent bridge from DeviceA to DeviceB.
Configuration
For both devices DeviceA and DeviceB there should be a very similar configuration.
/interface bridge
add name=bridge1 protocol-mode=rstp
/interface bridge port
add interface=ether1 bridge=bridge1
add interface=eoip1 bridge=bridge1
Problem
Both devices are able to communicate with each other, but some protocols do not work properly. The reason is that as soon as you use any STP variant (STP, RSTP, MSTP), you make the bridge compliant with IEEE 802.1D and IEEE 802.1Q, these standards recommend that packets that are destined to 01:80:C2:XX:XX:XX should NOT be forwarded. In cases where there are only 2 ports added to a bridge (R/M)STP should not be used since a loop cannot occur from 2 interfaces and if a loop does occur, the cause is elsewhere and should be fixed on a different bridge. Since (R/M)STP is not needed in transparent bridge setups, it can be disabled. As soon as (R/M)STP is disabled, the RouterOS bridge is not compliant with IEEE 802.1D and IEEE 802.1Q and therefore will forward packets that are destined to 01:80:C2:XX:XX:XX.
Symptoms
Below is a list of possible symptoms that might be as a result of this kind of a misconfiguration:
- LLDP neighbors not showing up
- 802.1x authentication (dot1x) not working
- LACP interface not passing traffic
Solution
Since RouterOS v6.43 it is possible to partly disable compliance with IEEE 802.1D and IEEE 802.1Q, this can be done by changing the bridge protocol mode.
/interface bridge
set bridge1 protocol-mode=none
![]()
Warning: The 802.1x standard is meant to be used between a switch and a client directly. If it is possible to connect a device between the switch and the client, then this creates a security threat. For this reason it is not recommended to disable the compliance with IEEE 802.1D and IEEE 802.1Q, but rather design a proper network topology.
Bonding between Wireless links
Consider the following scenario, you have set up multiple Wireless links and to achieve maximum throughput and yet to achieve redundancy you have decided to place Ethernet interfaces into a bond and depending on the traffic that is being forwarded you have chosen a certain bonding mode. This scenario can be applied to any case, where bonding interface is created between links, that are not directly connected to each other.
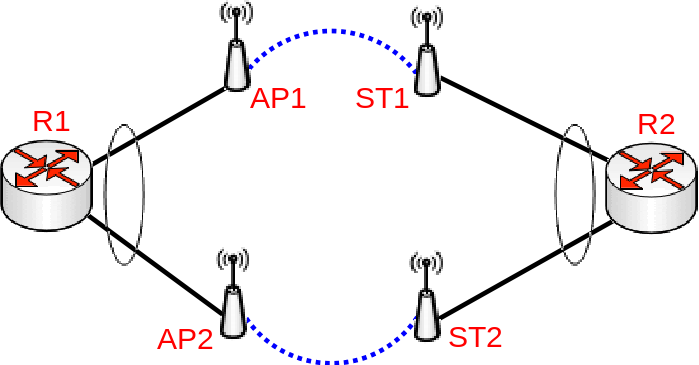
Bonding with Wireless links setup
Configuration
The following configuration is relevant to R1 and R2:
/interface bonding
add mode=802.3ad name=bond1 slaves=ether1,ether2 transmit-hash-policy=layer-2-and-3
/ip address
add address=192.168.1.X/24 interface=bond1
While the following configuration is relevant to AP1, AP2, ST1 and ST2:
/interface bridge
add name=bridge1 protocol-mode=none
/interface bridge port
add interface=ether1 bridge=bridge1
add interface=wlan1 bridge=bridge1
/ip address
add address=192.168.1.X/24 interface=bridge1
Where X corresponds to and IP address for each device.
Problem
While traffic is being forwarded properly between R1 and R2, load balancing, link fail-over is working properly as well, but devices between R1 and R2 are not not always accessible or some of them are completely inaccessible (in most cases AP2 and ST2 is inaccessible). After examining the problem you might notice that packets do not always get forwarded over the required bonding slave and as a result never is received by the device you are trying to access. This is a network design and bonding protocol limitation. As soon as a packet needs to be sent out through a bonding interface (in this case you might be trying to send ICMP packets to AP2 or ST2), the bonding interface will create a hash based on the selected bonding mode and transmit-hash-policy and will select an interface, through which to send the packet out, regardless if the destination is only reachable only through a certain interface. Some devices will be accessible because the generated hash matches the interface, on which the device is located on, but it might not choose the needed interface as well, which will result in inaccessible device. Only broadcast bonding mode does not have this kind of protocol limitation, but this bonding mode has a very limited use case.
Symptoms
Below is a list of possible symptoms that might be as a result of this kind of a misconfiguration:
- Limited connectivity
- Unstable links (in case of balance-rr)
Solution
Bonding interfaces are not supposed to be connected using in-direct links, but it is still possible to create a workaround. The idea behind this workaround is to find a way to bypass packets being sent out using the bonding interface. There are multiple ways to force a packet not to be sent out using the bonding interface, but essentially the solution is to create new interfaces on top of physical interfaces and add these newly created interfaces to a bond instead of the physical interfaces. One way to achieve this is to create EoIP tunnels on each physical interface, but that creates a huge overhead and will reduce overall throughput. You should create a VLAN interface on top of each physical interface instead, this creates a much smaller overhead and will not impact overall performance noticeably. Here is an example how R1 and R2 should be reconfigured:
/interface vlan
add interface=ether1 name=VLAN_ether1 vlan-id=999
add interface=ether2 name=VLAN_ether2 vlan-id=999
/interface bonding
add mode=balance-xor name=bond1 slaves=VLAN_ether1,VLAN_ether2 transmit-hash-policy=layer-2-and-3
/ip address
add address=192.168.1.X/24 interface=bond1
add address=192.168.11.X/24 interface=ether1
add address=192.168.22.X/24 interface=ether2
AP1 and ST1 only needs updated IP addresses to the correct subnet:
/ip address
add address=192.168.11.X/24 interface=bridge1
Same changes must be applied to AP2 and ST2 (make sure to use the correct subnet):
/ip address
add address=192.168.22.X/24 interface=bridge1
With this approach you create the least overhead and the least configuration changes are required.
![]()
Note: LACP (802.3ad) is not mean to be used in setups, where devices bonding slaves are not directly connected, in this case it is not recommended to use LACP, if there are Wireless links between both routers. LACP requires both bonding slaves to be at the same link speeds, Wireless links can change its rates at any time, which will decrease overall performance and stability. Other bonding modes should be used instead.
Bandwidth testing
Consider the following scenario, you set up a link between two devices, this can be any link, an Ethernet cable, a Wireless link, a tunnel or any other connection. You decide that you want to test the link’s bandwidth, but for convenience reasons you decide to start testing the link the same devices that are running the link.
Bad way to test bandwidth or throughput
Problem
As soon as you start Bandwidth test or Traffic generator you notice that the throughput is much smaller than expected. For very powerful routers, which should be able to forward many Gigabits per second (Gbps) you notice that only a few Gigabits per second gets forwarded. The reason why this is happening is because of the testing method you are using, you should never test throughput on a router while using the same router for generating traffic, this is especially true when using Bandwidth test since it is only able to generate traffic on a single CPU core and also applies when using Traffic-generator, though it can run on multiple cores, but you are still adding a load on the CPU that reduces the total throughput.
Symptoms
Below is a list of possible symptoms that might be as a result of this kind of a misconfiguration:
- Low throughput
- High CPU usage on one CPU core
Solution
Use a proper testing method. Don’t use Bandwidth-test to test large capacity links and don’t run any tool that generates traffic on the same device you are testing. Design your network properly so you can attach devices that will generate and receive traffic on both ends. If you are familiar with Iperf, then this concept should be clear. Remember that in real world a router or a switch does not generate large amounts of traffic (at least it shouldn’t, otherwise it might indicate an existing security issue), a server/client generates the traffic while a router/switch forwards the traffic (and does some manipulations to the traffic in appropriate cases).
Proper way to test bandwidth or throughput
Bridge split-horizon usage
Consider the following scenario, you have a bridge and you need to isolate certain bridge ports from each other. There are options to use a built-in switch chip to isolate certain ports on certain switch chips, you can use bridge firewall rules to prevent certain ports to be able to send any traffic to other ports, you can isolate ports in a PVLAN type of setup using port isolation, but there is also a software based solution to use bridge split-horizon (which disables hardware offloading on all switch chips).
Configuration
/interface bridge
add name=bridge1
/interface bridge port
add bridge=bridge1 horizon=1 hw=no interface=ether1
add bridge=bridge1 horizon=2 hw=no interface=ether2
add bridge=bridge1 horizon=3 hw=no interface=ether3
add bridge=bridge1 horizon=4 hw=no interface=ether4
Problem
After setting the bridge split-horizon on each port, you start to notice that each port is still able to send data between each other. The reason for this is misuse of bridge split-horizon. A bridge port is only not able to communicate with ports that are in the same horizon, for example, horizon=1 is not able to communicate with horizon=1, but is able to communicate with horizon=2, horizon=3 and so on.
Symptoms
Below is a list of possible symptoms that might be as a result of this kind of a misconfiguration:
- Traffic is being forwarded on different bridge split-horizons
Solution
Set a proper value as the bridge split-horizon. In case you want to isolate each port from each other (common scenario for PPPoE setups) and each port is only able to communicate with the bridge itself, then all ports must be in the same bridge split-horizon.
/interface bridge port
set [f] horizon=1
![]()
Note: Setting all bridge ports in the same bridge split-horizon will result traffic being only able to reach the bridge interface itself, then packets can only be routed. This is useful when you want other devices to filter out certain traffic. Similar behavior can be achieved using bridge filter rules.
Unsupported SFP modules
Consider the following scenario, you have decided to use optical fibre cables to connect your devices together by using SFP or SFP+ optical modules, but for convenience reasons you have decided to use SFP optical modules that were available.
Problem
As soon as you configure your devices to have connectivity on the ports that are using these SFP optical modules, you might notice that either the link is working properly or are experiencing random connectivity issues. There are many vendors that manufacture SFP optical modules, but not all vendors strictly follow SFP MSA, SFF and IEEE 802.3 standards, which can lead to unpredictable compatibility issues, which is a very common issue when using not well known or unsupported SFP optical modules in MikroTik devices.
Symptoms
Below is a list of possible symptoms that might be as a result of this kind of a misconfiguration:
- SFP interface does not link up
- Random packet drop
- Unstable link (flapping)
- SFP module not running after reboot
- SFP module not running after power-cycle
- SFP module running only on one side
Solution
You should only use supported SFP modules. Always check SFP compatibility table if you are intending to use SFP modules manufactured by MikroTik. There are other SFP modules that do work with MikroTik devices as well, check Supported peripherals table to find other SFP modules that have been confirmed to work with MikroTik devices. Some unsupported modules might not be working properly in certain speeds and with auto-negotiation, you might want to try to disable it and manually set a link speed.
[ Top | Back to Content ]