>Лечиться путём reset system и настройкой с нуля.
Не обязательно ресетить весь коммутатор, можно счетчики на портах обнулить (clear counters ports <portlist>)
Но эта проблема аппаратная, программно её не исправишь.
Небольшая статистика, откуда на клиентских портах CRC Err:
1. Самое распространенное: аппаратное отключение от сети интернет на стороне клиента (выдергивание вилки из сетевой карты) — как следствие плохой контакт между вилкой 8р8с и розеткой сетевой карты. Патчкорды никто не использует, а жесткий кабель обжатый в вилку 8р8с со временем теряет контакт.
Лечится не ресетом коммутатора, а тупо вынуть вилку из сетевой и снова воткнуть. Иногда клиент так задрачивает вилку, что приходится ехать переобжимать.
2. неисправность сетевой карты.
3. На стороне коммутатора. Сырость, пыль, грязь. Отсутствие гибких патчкордов. Кабель обжатый «двустволкой» после небольших телодвижений контакт в разъеме 8р8с лучше не становиться.
4. неисправность порта после грозы. Либо залило коммутатор водой (было такое: пинги ходят, а на IPerf порт виснет намертво)
5. По кабелю. Скрутки, боченки кат3. Кабель алюминиевый и/или стальной. Запредельная длина (больше 100метров), Толщина жилы AWG26 вместо положенных AWG24.
Последний раз редактировалось pvl Пт авг 26, 2011 10:12, всего редактировалось 2 раз(а).
<Core-Switch_01> display logbuffer
Feb 5 2018 19:13:49 010.-Core-Switch_01 %%01IFPDT/4/IF_STATE(l)[5]:Interface GigabitEthernet0/0/1 has turned into UP state.
Feb 5 2018 19:13:31 010.Core-Switch_01 %%01IFPDT/4/IF_STATE(l)[6]:Interface GigabitEthernet0/0/1 has turned into DOWN state.
Feb 5 2018 19:08:19 010.Core-Switch_01 %%01IFPDT/4/IF_STATE(l)[7]:Interface GigabitEthernet0/0/1 has turned into UP state.
Feb 5 2018 19:08:06 010.Core-Switch_01 %%01IFPDT/4/IF_STATE(l)[8]:Interface GigabitEthernet0/0/1 has turned into DOWN state.
Feb 5 2018 18:47:39 010.Core-Switch_01 %%01IFPDT/4/IF_STATE(l)[9]:Interface GigabitEthernet0/0/1 has turned into UP state.
Feb 5 2018 18:47:24 010.Core-Switch_01 %%01IFPDT/4/IF_STATE(l)[10]:Interface GigabitEthernet0/0/1 has turned into DOWN state.
<xxxxx_Core-Switch_01>display trapbuffer
#Jan 17 2018 19:49:31 010.Core-Switch_01 IFNET/1/CRCERRORRISING:OID 1.3.6.1.4.1.2011.5.25.41.4.1 The CRC error is rising. (hwIfMonitorIndex=6, hwIfMonitorCrcErrorStatistics=5, hwIfMonitorCrcErrorThreshold=3, hwIfMonitorCrcErrorInterval=10, InterfaceName=GigabitEthernet0/0/1)
#Jan 17 2018 19:49:29 010.Core-Switch_01 MSTP/4/PFWD:OID 1.3.6.1.4.1.2011.5.25.42.4.2.1 The port has been set to forwarding state. (InstanceID=0, PortInstanceID=0, PortID=1, IfIndex=6, PortName=GigabitEthernet0/0/1)
#Jan 17 2018 19:49:29 010.Core-Switch_01 MSTP/1/TOPOC:OID 1.3.6.1.2.1.17.0.2 Bridge topology change.
#Jan 17 2018 19:49:29 010.Core-Switch_01 IFNET/1/IF_LINKUP:OID 1.3.6.1.6.3.1.1.5.4 Interface 6 turned into
UP state.(AdminStatus=1,OperStatus=1,InterfaceName=GigabitEthernet0/0/1)
#Jan 17 2018 19:49:21 010.Core-Switch_01 IFNET/1/CRCERRORRESUME:OID 1.3.6.1.4.1.2011.5.25.41.4.2 The CRC error resume. (hwIfMonitorIndex=6, hwIfMonitorCrcErrorStatistics=0, hwIfMonitorCrcErrorThreshold=3, hwIfMonitorCrcErrorInterval=10, InterfaceName=GigabitEthernet0/0/1)
#Jan 17 2018 19:49:13 010.Core-Switch_01 IFNET/1/IF_LINKDOWN:OID 1.3.6.1.6.3.1.1.5.3 Interface 6 turned into DOWN state.(AdminStatus=1,OperStatus=2,InterfaceName=GigabitEthernet0/0/1)
#Jan 17 2018 19:39:31 010.Core-Switch_01 IFNET/1/CRCERRORRISING:OID 1.3.6.1.4.1.2011.5.25.41.4.1 The CRC error is rising. (hwIfMonitorIndex=6, hwIfMonitorCrcErrorStatistics=117, hwIfMonitorCrcErrorThreshold=3, hwIfMonitorCrcErrorInterval=10, InterfaceName=GigabitEthernet0/0/1)
#Jan 17 2018 19:39:29 010.Core-Switch_01 IFNET/1/CRCERRORRESUME:OID 1.3.6.1.4.1.2011.5.25.41.4.2 The CRC error resume. (hwIfMonitorIndex=6, hwIfMonitorCrcErrorStatistics=0, hwIfMonitorCrcErrorThreshold=3, hwIfMonitorCrcErrorInterval=10, InterfaceName=GigabitEthernet0/0/1)
[Core-Switch_01]display interface GigabitEthernet 0/0/1 (The command to Show the CRC errors on the Interface)
Line protocol current state : UP
Switch Port, Link-type : trunk(configured),
PVID : 1, TPID : 8100(Hex), The Maximum Frame Length is 9216
IP Sending Frames’ Format is PKTFMT_ETHNT_2, Hardware address is 7079-903f-15c0
Current system time: 2018-02-05 19:33:15
Port Mode: COMMON COPPER
Speed : 1000, Loopback: NONE
Duplex: FULL, Negotiation: ENABLE
Mdi : AUTO, Flow-control: DISABLE
Last 300 seconds input rate 2338368 bits/sec, 389 packets/sec
Last 300 seconds output rate 3589400 bits/sec, 503 packets/sec
Input peak rate 5685864 bits/sec, Record time: 2018-02-05 19:24:25
Output peak rate 5605984 bits/sec, Record time: 2018-02-05 19:31:33
Input: 250309 packets, 188157096 bytes
Unicast: 245903, Multicast: 345
Broadcast: 19, Jumbo: 0
Discard: 0, Pause: 0
Frames: 0
Total Error: 4042
CRC: 3573, Giants: 0
Jabbers: 53, Fragments: 0
Runts: 0, DropEvents: 0
Alignments: 0, Symbols: 416
Ignoreds: 0
Output: 313693 packets, 267303089 bytes
Unicast: 311325, Multicast: 1075
Broadcast: 1293, Jumbo: 0
Discard: 0, Pause: 0
Total Error: 0
Collisions: 0, ExcessiveCollisions: 0
Late Collisions: 0, Deferreds: 0
Buffers Purged: 0
Input bandwidth utilization threshold : 80.00%
Output bandwidth utilization threshold: 80.00%
Input bandwidth utilization : 0.23%
Output bandwidth utilization : 0.36%
Introduction
This document describes details surrounding Cyclic Redundancy Check (CRC) errors observed on interface counters and statistics of Cisco Nexus switches.
Prerequisites
Requirements
Cisco recommends that you understand the basics of Ethernet switching and the Cisco NX-OS Command Line Interface (CLI). For more information, refer to one of these applicable documents:
- Cisco Nexus 9000 NX-OS Fundamentals Configuration Guide, Release 10.2(x)
- Cisco Nexus 9000 Series NX-OS Fundamentals Configuration Guide, Release 9.3(x)
- Cisco Nexus 9000 Series NX-OS Fundamentals Configuration Guide, Release 9.2(x)
- Cisco Nexus 9000 Series NX-OS Fundamentals Configuration Guide, Release 7.x
- Troubleshooting Ethernet
Components Used
The information in this document is based on these software and hardware versions:
- Nexus 9000 series switches starting from NX-OS software release 9.3(8)
- Nexus 3000 series switches starting from NX-OS software release 9.3(8)
The information in this document was created from devices in a specific lab environment. All of the devices used in this document started with a cleared (default) configuration. If your network is live, ensure that you understand the potential impact of any command.
The information in this document was created from the devices in a specific lab environment. All of the devices used in this document started with a cleared (default) configuration. If your network is live, ensure that you understand the potential impact of any command.
Background Information
This document describes details surrounding Cyclic Redundancy Check (CRC) errors observed on interface counters on Cisco Nexus series switches. This document describes what a CRC is, how it is used in the Frame Check Sequence (FCS) field of Ethernet frames, how CRC errors manifest on Nexus switches, how CRC errors interact in Store-and-Forward switching and Cut-Through switching scenarios, the most likely root causes of CRC errors, and how to troubleshoot and resolve CRC errors.
Applicable Hardware
The information in this document is applicable to all Cisco Nexus Series switches. Some of the information in this document can also be applicable to other Cisco routing and switching platforms, such as Cisco Catalyst routers and switches.
CRC Definition
A CRC is an error detection mechanism commonly used in computer and storage networks to identify data changed or corrupted during transmission. When a device connected to the network needs to transmit data, the device runs a computation algorithm based on cyclic codes against the data that results in a fixed-length number. This fixed-length number is called the CRC value, but colloquially, it is often called the CRC for short. This CRC value is appended to the data and transmitted through the network towards another device. This remote device runs the same cyclic code algorithm against the data and compares the resulting value with the CRC appended to the data. If both values match, then the remote device assumes the data was transmitted across the network without being corrupted. If the values do not match, then the remote device assumes the data was corrupted during transmission across the network. This corrupted data cannot be trusted and is discarded.
CRCs are used for error detection across multiple computer networking technologies, such as Ethernet (both wired and wireless variants), Token Ring, Asynchronous Transfer Mode (ATM), and Frame Relay. Ethernet frames have a 32-bit Frame Check Sequence (FCS) field at the end of the frame (immediately after the payload of the frame) where a 32-bit CRC value is inserted.
For example, consider a scenario where two hosts named Host-A and Host-B are directly connected to each other through their Network Interface Cards (NICs). Host-A needs to send the sentence “This is an example” to Host-B over the network. Host-A crafts an Ethernet frame destined to Host-B with a payload of “This is an example” and calculates that the CRC value of the frame is a hexadecimal value of 0xABCD. Host-A inserts the CRC value of 0xABCD into the FCS field of the Ethernet frame, then transmits the Ethernet frame out of Host-A’s NIC towards Host-B.
When Host-B receives this frame, it will calculate the CRC value of the frame with the use of the exact same algorithm as Host-A. Host-B calculates that the CRC value of the frame is a hexadecimal value of 0xABCD, which indicates to Host-B that the Ethernet frame was not corrupted while the frame was transmitted to Host-B.
CRC Error Definition
A CRC error occurs when a device (either a network device or a host connected to the network) receives an Ethernet frame with a CRC value in the FCS field of the frame that does not match the CRC value calculated by the device for the frame.
This concept is best demonstrated through an example. Consider a scenario where two hosts named Host-A and Host-B are directly connected to each other through their Network Interface Cards (NICs). Host-A needs to send the sentence “This is an example” to Host-B over the network. Host-A crafts an Ethernet frame destined to Host-B with a payload of “This is an example” and calculates that the CRC value of the frame is the hexadecimal value 0xABCD. Host-A inserts the CRC value of 0xABCD into the FCS field of the Ethernet frame, then transmits the Ethernet frame out of Host-A’s NIC towards Host-B.
However, damage on the physical media connecting Host-A to Host-B corrupts the contents of the frame such that the sentence within the frame changes to “This was an example” instead of the desired payload of “This is an example”.
When Host-B receives this frame, it will calculate the CRC value of the frame including the corrupted payload. Host-B calculates that the CRC value of the frame is a hexadecimal value of 0xDEAD, which is different from the 0xABCD CRC value within the FCS field of the Ethernet frame. This difference in CRC values tells Host-B that the Ethernet frame was corrupted while the frame was transmitted to Host-B. As a result, Host-B cannot trust the contents of this Ethernet frame, so it will drop it. Host-B will usually increment some sort of error counter on its Network Interface Card (NIC) as well, such as the “input errors”, “CRC errors”, or “RX errors” counters.
Common Symptoms of CRC Errors
CRC errors typically manifest themselves in one of two ways:
- Incrementing or non-zero error counters on interfaces of network-connected devices.
- Packet/Frame loss for traffic traversing the network due to network-connected devices dropping corrupted frames.
These errors manifest themselves in slightly different ways depending on the device you are working with. These sub-sections go into detail for each type of device.
Received Errors on Windows Hosts
CRC errors on Windows hosts typically manifest as a non-zero Received Errors counter displayed in the output of the netstat -e command from the Command Prompt. An example of a non-zero Received Errors counter from the Command Prompt of a Windows host is here:
>netstat -e
Interface StatisticsReceived Sent
Bytes 1116139893 3374201234
Unicast packets 101276400 49751195
Non-unicast packets 0 0
Discards 0 0
Errors 47294 0
Unknown protocols 0
The NIC and its respective driver must support accounting of CRC errors received by the NIC in order for the number of Received Errors reported by the netstat -e command to be accurate. Most modern NICs and their respective drivers support accurate accounting of CRC errors received by the NIC.
RX Errors on Linux Hosts
CRC errors on Linux hosts typically manifest as a non-zero “RX errors” counter displayed in the output of the ifconfig command. An example of a non-zero RX errors counter from a Linux host is here:
$ ifconfig eth0
eth0: flags=4163<UP,BROADCAST,RUNNING,MULTICAST>  mtu 1500
        inet 192.0.2.10  netmask 255.255.255.128  broadcast 192.0.2.255
        inet6 fe80::10  prefixlen 64  scopeid 0x20<link>
        ether 08:62:66:be:48:9b  txqueuelen 1000  (Ethernet)
        RX packets 591511682  bytes 214790684016 (200.0 GiB)
        RX errors 478920  dropped 0  overruns 0  frame 0
        TX packets 85495109  bytes 288004112030 (268.2 GiB)
        TX errors 0  dropped 0 overruns 0  carrier 0  collisions 0
CRC errors on Linux hosts can also manifest as a non-zero “RX errors” counter displayed in the output of ip -s link show command. An example of a non-zero RX errors counter from a Linux host is here:
$ ip -s link show eth0
2: eth0: <BROADCAST,MULTICAST,UP,LOWER_UP> mtu 1500 qdisc mq state UP mode DEFAULT group default qlen 1000
    link/ether 08:62:66:84:8f:6d brd ff:ff:ff:ff:ff:ff
    RX: bytes  packets  errors  dropped overrun mcast
    32246366102 444908978 478920       647     0       419445867
    TX: bytes  packets  errors  dropped carrier collsns
    3352693923 30185715 0       0       0       0
    altname enp11s0
The NIC and its respective driver must support accounting of CRC errors received by the NIC in order for the number of RX Errors reported by the ifconfig or ip -s link show commands to be accurate. Most modern NICs and their respective drivers support accurate accounting of CRC errors received by the NIC.
CRC Errors on Network Devices
Network devices operate in one of two forwarding modes — Store-and-Forward forwarding mode, and Cut-Through forwarding mode. The way a network device handles a received CRC error differs depending on its forwarding modes. The subsections here will describe the specific behavior for each forwarding mode.
Input Errors on Store-and-Forward Network Devices
When a network device operating in a Store-and-Forward forwarding mode receives a frame, the network device will buffer the entire frame (“Store”) before you validate the frame’s CRC value, make a forwarding decision on the frame, and transmit the frame out of an interface (“Forward”). Therefore, when a network device operating in a Store-and-Forward forwarding mode receives a corrupted frame with an incorrect CRC value on a specific interface, it will drop the frame and increment the “Input Errors” counter on the interface.
In other words, corrupt Ethernet frames are not forwarded by network devices operating in a Store-and-Forward forwarding mode; they are dropped on ingress.
Cisco Nexus 7000 and 7700 Series switches operate in a Store-and-Forward forwarding mode. An example of a non-zero Input Errors counter and a non-zero CRC/FCS counter from a Nexus 7000 or 7700 Series switch is here:
switch# show interface
<snip>
Ethernet1/1 is up
  RX
    241052345 unicast packets  5236252 multicast packets  5 broadcast packets
    245794858 input packets  17901276787 bytes
    0 jumbo packets  0 storm suppression packets
    0 runts  0 giants  579204 CRC/FCS  0 no buffer
    579204 input error  0 short frame  0 overrun   0 underrun  0 ignored
    0 watchdog  0 bad etype drop  0 bad proto drop  0 if down drop
    0 input with dribble  0 input discard
    0 Rx pause
CRC errors can also manifest themselves as a non-zero “FCS-Err” counter in the output of show interface counters errors. The «Rcv-Err» counter in the output of this command will also have a non-zero value, which is the sum of all input errors (CRC or otherwise) received by the interface. An example of this is shown here:
switch# show interface counters errors
<snip>
--------------------------------------------------------------------------------
Port          Align-Err    FCS-Err   Xmit-Err    Rcv-Err  UnderSize OutDiscards
--------------------------------------------------------------------------------
Eth1/1                0     579204          0     579204          0           0
Input and Output Errors on Cut-Through Network Devices
When a network device operating in a Cut-Through forwarding mode starts to receive a frame, the network device will make a forwarding decision on the frame’s header and begin transmitting the frame out of an interface as soon as it receives enough of the frame to make a valid forwarding decision. As frame and packet headers are at the beginning of the frame, this forwarding decision is usually made before the payload of the frame is received.
The FCS field of an Ethernet frame is at the end of the frame, immediately after the frame’s payload. Therefore, a network device operating in a Cut-Through forwarding mode will already have started transmitting the frame out of another interface by the time it can calculate the CRC of the frame. If the CRC calculated by the network device for the frame does not match the CRC value present in the FCS field, that means the network device forwarded a corrupted frame into the network. When this happens, the network device will increment two counters:
- The “Input Errors” counter on the interface where the corrupted frame was originally received.
- The “Output Errors” counter on all interfaces where the corrupted frame was transmitted. For unicast traffic, this will typically be a single interface – however, for broadcast, multicast, or unknown unicast traffic, this could be one or more interfaces.
An example of this is shown here, where the output of the show interface command indicates multiple corrupted frames were received on Ethernet1/1 of the network device and transmitted out of Ethernet1/2 due to the Cut-Through forwarding mode of the network device:
switch# show interface
<snip>
Ethernet1/1 is up
RX
46739903 unicast packets 29596632 multicast packets 0 broadcast packets
76336535 input packets 6743810714 bytes
15 jumbo packets 0 storm suppression bytes
0 runts 0 giants 47294 CRC 0 no buffer
47294 input error 0 short frame 0 overrun 0 underrun 0 ignored
0 watchdog 0 bad etype drop 0 bad proto drop 0 if down drop
0 input with dribble 0 input discard
0 Rx pauseEthernet1/2 is up
TX
46091721 unicast packets 2852390 multicast packets 102619 broadcast packets
49046730 output packets 3859955290 bytes
50230 jumbo packets
47294 output error 0 collision 0 deferred 0 late collision
0 lost carrier 0 no carrier 0 babble 0 output discard
0 Tx pause
CRC errors can also manifest themselves as a non-zero “FCS-Err” counter on the ingress interface and non-zero «Xmit-Err» counters on egress interfaces in the output of show interface counters errors. The «Rcv-Err» counter on the ingress interface in the output of this command will also have a non-zero value, which is the sum of all input errors (CRC or otherwise) received by the interface. An example of this is shown here:
switch# show interface counters errors
<snip>
--------------------------------------------------------------------------------
Port          Align-Err    FCS-Err   Xmit-Err    Rcv-Err  UnderSize OutDiscards
--------------------------------------------------------------------------------
Eth1/1                0      47294          0      47294          0           0
Eth1/2                0          0      47294          0          0           0
The network device will also modify the CRC value in the frame’s FCS field in a specific manner that signifies to upstream network devices that this frame is corrupt. This behavior is known as “stomping” the CRC. The precise manner in which the CRC is modified varies from one platform to another, but generally, it involves inverting the current CRC value present in the frame’s FCS field. An example of this is here:
Original CRC: 0xABCD (1010101111001101)
Stomped CRC:  0x5432 (0101010000110010)
As a result of this behavior, network devices operating in a Cut-Through forwarding mode can propagate a corrupt frame throughout a network. If a network consists of multiple network devices operating in a Cut-Through forwarding mode, a single corrupt frame can cause input error and output error counters to increment on multiple network devices within your network.
Trace and Isolate CRC Errors
The first step in order to identify and resolve the root cause of CRC errors is isolating the source of the CRC errors to a specific link between two devices within your network. One device connected to this link will have an interface output errors counter with a value of zero or is not incrementing, while the other device connected to this link will have a non-zero or incrementing interface input errors counter. This suggests that traffic egresses the interface of one device intact is corrupted at the time of the transmission to the remote device, and is counted as an input error by the ingress interface of the other device on the link.
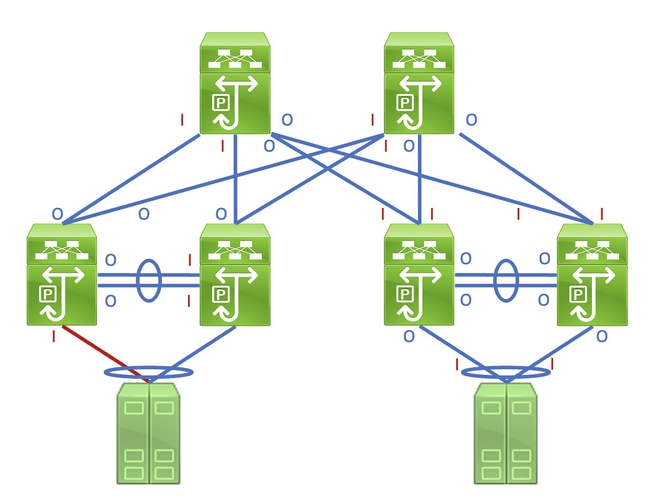
Identifying this link in a network consisting of network devices operating in a Store-and-Forward forwarding mode is a straightforward task. However, identifying this link in a network consisting of network devices operating in a Cut-Through forwarding mode is more difficult, as many network devices will have non-zero input and output error counters. An example of this phenomenon can be seen in the topology here, where the link highlighted in red is damaged such that traffic traversing the link is corrupted. Interfaces labeled with a red «I» indicate interfaces that could have non-zero input errors, while interfaces labeled with a blue «O» indicate interfaces that could have non-zero output errors.
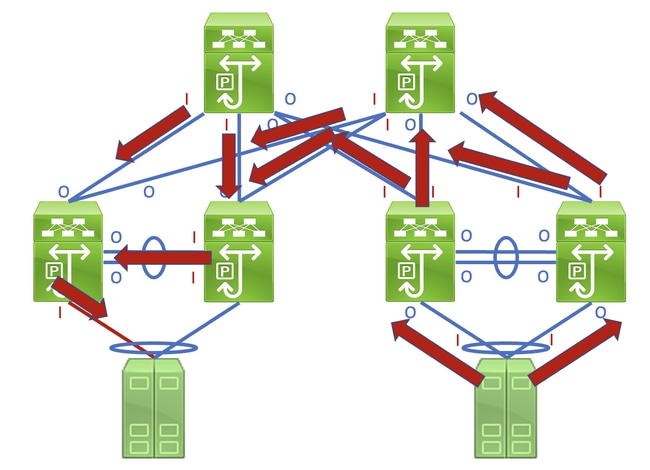
Identifying the faulty link requires you to recursively trace the «path» corrupted frames follow in the network through non-zero input and output error counters, with non-zero input errors pointing upstream towards the damaged link in the network. This is demonstrated in the diagram here.
A detailed process for tracing and identifying a damaged link is best demonstrated through an example. Consider the topology here:
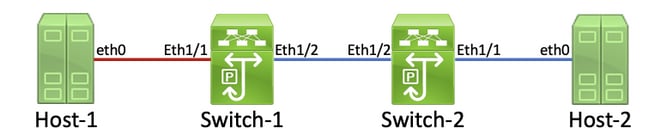
In this topology, interface Ethernet1/1 of a Nexus switch named Switch-1 is connected to a host named Host-1 through Host-1’s Network Interface Card (NIC) eth0. Interface Ethernet1/2 of Switch-1 is connected to a second Nexus switch, named Switch-2, through Switch-2’s interface Ethernet1/2. Interface Ethernet1/1 of Switch-2 is connected to a host named Host-2 through Host-2’s NIC eth0.
The link between Host-1 and Switch-1 through Switch-1’s Ethernet1/1 interface is damaged, causing traffic that traverses the link to be intermittently corrupted. However, we do not yet know that this link is damaged. We must trace the path the corrupted frames leave in the network through non-zero or incrementing input and output error counters to locate the damaged link in this network.
In this example, Host-2’s NIC reports that it is receiving CRC errors.
Host-2$ ip -s link show eth0
2: eth0: <BROADCAST,MULTICAST,UP,LOWER_UP> mtu 1500 qdisc mq state UP mode DEFAULT group default qlen 1000
    link/ether 00:50:56:84:8f:6d brd ff:ff:ff:ff:ff:ff
    RX: bytes  packets  errors  dropped overrun mcast
    32246366102 444908978 478920       647     0       419445867
    TX: bytes  packets  errors  dropped carrier collsns
    3352693923 30185715 0       0       0       0
    altname enp11s0
You know that Host-2’s NIC connects to Switch-2 via interface Ethernet1/1. You can confirm that interface Ethernet1/1 has a non-zero output errors counter with the show interface command.
Switch-2# show interface
<snip>
Ethernet1/1 is up
admin state is up, Dedicated Interface
    RX
      30184570 unicast packets  872 multicast packets  273 broadcast packets
      30185715 input packets  3352693923 bytes
      0 jumbo packets  0 storm suppression bytes
      0 runts  0 giants 0 CRC  0 no buffer
      0 input error  0 short frame  0 overrun   0 underrun  0 ignored
      0 watchdog  0 bad etype drop  0 bad proto drop  0 if down drop
      0 input with dribble  0 input discard
      0 Rx pause
    TX
      444907944 unicast packets  932 multicast packets  102 broadcast packets
      444908978 output packets  32246366102 bytes
      0 jumbo packets
      478920 output error  0 collision  0 deferred  0 late collision
      0 lost carrier  0 no carrier  0 babble  0 output discard
      0 Tx pause
Since the output errors counter of interface Ethernet1/1 is non-zero, there is most likely another interface of Switch-2 that has a non-zero input errors counter. You can use the show interface counters errors non-zero command in order to identify if any interfaces of Switch-2 have a non-zero input errors counter.
Switch-2# show interface counters errors non-zero
<snip>
--------------------------------------------------------------------------------
Port          Align-Err    FCS-Err   Xmit-Err    Rcv-Err  UnderSize OutDiscards
--------------------------------------------------------------------------------
Eth1/1                0          0     478920          0          0           0
Eth1/2                0     478920          0     478920          0           0

--------------------------------------------------------------------------------
Port         Single-Col  Multi-Col   Late-Col  Exces-Col  Carri-Sen       Runts
--------------------------------------------------------------------------------

--------------------------------------------------------------------------------
Port          Giants SQETest-Err Deferred-Tx IntMacTx-Er IntMacRx-Er Symbol-Err
--------------------------------------------------------------------------------

--------------------------------------------------------------------------------
Port         InDiscards
--------------------------------------------------------------------------------
You can see that Ethernet1/2 of Switch-2 has a non-zero input errors counter. This suggests that Switch-2 receives corrupted traffic on this interface. You can confirm which device is connected to Ethernet1/2 of Switch-2 through the Cisco Discovery Protocol (CDP) or Link Local Discovery Protocol (LLDP) features. An example of this is shown here with the show cdp neighbors command.
Switch-2# show cdp neighbors
<snip>
    Capability Codes: R - Router, T - Trans-Bridge, B - Source-Route-Bridge
    S - Switch, H - Host, I - IGMP, r - Repeater,
    V - VoIP-Phone, D - Remotely-Managed-Device,
    s - Supports-STP-Dispute

Device-ID          Local Intrfce  Hldtme Capability  Platform      Port ID
Switch-1(FDO12345678)
                    Eth1/2         125    R S I s   N9K-C93180YC- Eth1/2
You now know that Switch-2 is receiving corrupted traffic on its Ethernet1/2 interface from Switch-1’s Ethernet1/2 interface, but you do not yet know whether the link between Switch-1’s Ethernet1/2 and Switch-2’s Ethernet1/2 is damaged and causes the corruption, or if Switch-1 is a cut-through switch forwarding corrupted traffic it receives. You must log into Switch-1 to verify this.
You can confirm Switch-1’s Ethernet1/2 interface has a non-zero output errors counter with the show interfaces command.
Switch-1# show interface
<snip>
Ethernet1/2 is up
admin state is up, Dedicated Interface
    RX
      30581666 unicast packets  178 multicast packets  931 broadcast packets
      30582775 input packets  3352693923 bytes
      0 jumbo packets  0 storm suppression bytes
      0 runts  0 giants 0 CRC  0 no buffer
      0 input error  0 short frame  0 overrun   0 underrun  0 ignored
      0 watchdog  0 bad etype drop  0 bad proto drop  0 if down drop
      0 input with dribble  0 input discard
      0 Rx pause
    TX
      454301132 unicast packets  734 multicast packets  72 broadcast packets
      454301938 output packets  32246366102 bytes
      0 jumbo packets
      478920 output error  0 collision  0 deferred  0 late collision
      0 lost carrier  0 no carrier  0 babble  0 output discard
      0 Tx pause
You can see that Ethernet1/2 of Switch-1 has a non-zero output errors counter. This suggests that the link between Switch-1’s Ethernet1/2 and Switch-2’s Ethernet1/2 is not damaged — instead, Switch-1 is a cut-through switch forwarding corrupted traffic it receives on some other interface. As previously demonstrated with Switch-2, you can use the show interface counters errors non-zero command in order to identify if any interfaces of Switch-1 have a non-zero input errors counter.
Switch-1# show interface counters errors non-zero
<snip>
--------------------------------------------------------------------------------
Port          Align-Err    FCS-Err   Xmit-Err    Rcv-Err  UnderSize OutDiscards
--------------------------------------------------------------------------------
Eth1/1                0     478920          0     478920          0           0
Eth1/2                0          0     478920          0          0           0

--------------------------------------------------------------------------------
Port         Single-Col  Multi-Col   Late-Col  Exces-Col  Carri-Sen       Runts
--------------------------------------------------------------------------------

--------------------------------------------------------------------------------
Port          Giants SQETest-Err Deferred-Tx IntMacTx-Er IntMacRx-Er Symbol-Err
--------------------------------------------------------------------------------

--------------------------------------------------------------------------------
Port         InDiscards
--------------------------------------------------------------------------------
You can see that Ethernet1/1 of Switch-1 has a non-zero input errors counter. This suggests that Switch-1 is receiving corrupted traffic on this interface. We know that this interface connects to Host-1’s eth0 NIC. We can review Host-1’s eth0 NIC interface statistics to confirm whether Host-1 sends corrupted frames out of this interface.
Host-1$ ip -s link show eth0
2: eth0: <BROADCAST,MULTICAST,UP,LOWER_UP> mtu 1500 qdisc mq state UP mode DEFAULT group default qlen 1000
    link/ether 00:50:56:84:8f:6d brd ff:ff:ff:ff:ff:ff
    RX: bytes  packets  errors  dropped overrun mcast
    73146816142 423112898 0       0     0       437368817
    TX: bytes  packets  errors  dropped carrier collsns
    3312398924 37942624 0       0       0       0
    altname enp11s0
The eth0 NIC statistics of Host-1 suggest the host is not transmitting corrupted traffic. This suggests that the link between Host-1’s eth0 and Switch-1’s Ethernet1/1 is damaged and is the source of this traffic corruption. Further troubleshooting will need to be performed on this link to identify the faulty component causing this corruption and replace it.
Root Causes of CRC Errors
The most common root cause of CRC errors is a damaged or malfunctioning component of a physical link between two devices. Examples include:
- Failing or damaged physical medium (copper or fiber) or Direct Attach Cables (DACs).
- Failing or damaged transceivers/optics.
- Failing or damaged patch panel ports.
- Faulty network device hardware (including specific ports, line card Application-Specific Integrated Circuits [ASICs], Media Access Controls [MACs], fabric modules, etc.),
- Malfunctioning network interface card inserted in a host.
It is also possible for one or more misconfigured devices to inadvertently causes CRC errors within a network. One example of this is a Maximum Transmission Unit (MTU) configuration mismatch between two or more devices within the network causing large packets to be incorrectly truncated. Identifying and resolving this configuration issue can correct CRC errors within a network as well.
Resolve CRC Errors
You can identify the specific malfunctioning component through a process of elimination:
- Replace the physical medium (either copper or fiber) or DAC with a known-good physical medium of the same type.
- Replace the transceiver inserted in one device’s interface with a known-good transceiver of the same model. If this does not resolve the CRC errors, replace the transceiver inserted in the other device’s interface with a known-good transceiver of the same model.
- If any patch panels are used as part of the damaged link, move the link to a known-good port on the patch panel. Alternatively, eliminate the patch panel as a potential root cause by connecting the link without using the patch panel if possible.
- Move the damaged link to a different, known-good port on each device. You will need to test multiple different ports to isolate a MAC, ASIC, or line card failure.
- If the damaged link involves a host, move the link to a different NIC on the host. Alternatively, connect the damaged link to a known-good host to isolate a failure of the host’s NIC.
If the malfunctioning component is a Cisco product (such as a Cisco network device or transceiver) that is covered by an active support contract, you can open a support case with Cisco TAC detailing your troubleshooting to have the malfunctioning component replaced through a Return Material Authorization (RMA).
Related Information
- Nexus 9000 Cloud Scale ASIC CRC Identification & Tracing Procedure
- Technical Support & Documentation — Cisco Systems

RX (recive) — принимать пакеты приходящие от клиента
TX (transmit) передавать— пакеты приходящие к клиенту
Типы ошибок:
CRC Error — ошибки проверки контрольной суммы
Undersize — возникают при получение фрейма размером 61-64 байта.
Фрейм передается дальше, на работу не влияет
Oversize — возникают при получении пакета размером более 1518 байт и правильной контрольной суммой
Jabber — возникает при получении пакета размером более 1518 байт и имеющего ошибки в контрольной сумме
Drop Pkts — пакеты отброшенные в одном из трех случаев:
Какие пакеты входят в Drop Packets при выводе show error ports?
Переполнение входного буфера на порту
Пакеты, отброшенные ACL
Проверка по VLAN на входе
Fragment — количество принятых кадров длиной менее 64 байт (без преамбулы и начального ограничителя кадра, но включая байты FCS — контрольной суммы) и содержащих ошибки FCS или ошибки выравнивания.
Excessive Deferral — количество пакетов, первая попытка отправки которых была отложена по причине занятости среды передачи.
Collision — возникают, когда две станции одновременно пытаются передать кадр данных по общей сред
Late Collision — возникают, если коллизия была обнаружена после передачи первых 64 байт пакета
Excessive Collision — возникают, если после возникновения коллизии последующие 16 попыток передачи пакета окончались неудачей. данный пакет больше не передается
Single Collision — единичная коллизия
>Лечиться путём reset system и настройкой с нуля.
Не обязательно ресетить весь коммутатор, можно счетчики на портах обнулить (clear counters ports <portlist>)
Но эта проблема аппаратная, программно её не исправишь.
Небольшая статистика, откуда на клиентских портах CRC Err:
1. Самое распространенное: аппаратное отключение от сети интернет на стороне клиента (выдергивание вилки из сетевой карты) — как следствие плохой контакт между вилкой 8р8с и розеткой сетевой карты. Патчкорды никто не использует, а жесткий кабель обжатый в вилку 8р8с со временем теряет контакт.
Лечится не ресетом коммутатора, а тупо вынуть вилку из сетевой и снова воткнуть. Иногда клиент так задрачивает вилку, что приходится ехать переобжимать.
2. неисправность сетевой карты.
3. На стороне коммутатора. Сырость, пыль, грязь. Отсутствие гибких патчкордов. Кабель обжатый «двустволкой» после небольших телодвижений контакт в разъеме 8р8с лучше не становиться.
4. неисправность порта после грозы. Либо залило коммутатор водой (было такое: пинги ходят, а на IPerf порт виснет намертво)
5. По кабелю. Скрутки, боченки кат3. Кабель алюминиевый и/или стальной. Запредельная длина (больше 100метров), Толщина жилы AWG26 вместо положенных AWG24.
Последний раз редактировалось pvl Пт авг 26, 2011 10:12, всего редактировалось 2 раз(а).
Подскажите пожалуйста возможные причины сделующего:
Есть линк между dlink 3627g и catalist 3750-12s.
Расстояние по оптике 1.2 км. Трансиверы wdm 20км(noname)
Между точками имеется 2 волокна. Работа ведется по одному.
Три дня назад поперли RX ошибки на порту 3627.
Приехав на место(3627) обнаружили уровень сигнала -21 (замер сфп воткнутой в 3750 показал -5.7 )
Получается дикое затухание.
Перекидываемся на резервное волокно, таже картина.
Со места 3750 меряем трассу, картинка нормальная за исключением конца(для обоих волокон).
Идем и меряем трассу на месте 3627, трассы нет(для обоих волокон). Выкручиваем в кроссе пигтейл изнутри и вкручиваем заново в розетку(для обоих волокон).
После этой операции получаем уровень входного сиганала аж в районе -6 (по обеим волокнам).
После этого надеясь что проблема решена, узнаем что CRC ошибок по прежнему приличное количество(хотя заметно меньше чем раньше).
+ Менялись пачкорды, трансиверы и порты коммутаторов.
При этом проблема не решилась 
Изменено 8 октября, 2011 пользователем Inp
Introduction
This document describes details surrounding Cyclic Redundancy Check (CRC) errors observed on interface counters and statistics of Cisco Nexus switches.
Prerequisites
Requirements
Cisco recommends that you understand the basics of Ethernet switching and the Cisco NX-OS Command Line Interface (CLI). For more information, refer to one of these applicable documents:
- Cisco Nexus 9000 NX-OS Fundamentals Configuration Guide, Release 10.2(x)
- Cisco Nexus 9000 Series NX-OS Fundamentals Configuration Guide, Release 9.3(x)
- Cisco Nexus 9000 Series NX-OS Fundamentals Configuration Guide, Release 9.2(x)
- Cisco Nexus 9000 Series NX-OS Fundamentals Configuration Guide, Release 7.x
- Troubleshooting Ethernet
Components Used
The information in this document is based on these software and hardware versions:
- Nexus 9000 series switches starting from NX-OS software release 9.3(8)
- Nexus 3000 series switches starting from NX-OS software release 9.3(8)
The information in this document was created from devices in a specific lab environment. All of the devices used in this document started with a cleared (default) configuration. If your network is live, ensure that you understand the potential impact of any command.
The information in this document was created from the devices in a specific lab environment. All of the devices used in this document started with a cleared (default) configuration. If your network is live, ensure that you understand the potential impact of any command.
Background Information
This document describes details surrounding Cyclic Redundancy Check (CRC) errors observed on interface counters on Cisco Nexus series switches. This document describes what a CRC is, how it is used in the Frame Check Sequence (FCS) field of Ethernet frames, how CRC errors manifest on Nexus switches, how CRC errors interact in Store-and-Forward switching and Cut-Through switching scenarios, the most likely root causes of CRC errors, and how to troubleshoot and resolve CRC errors.
Applicable Hardware
The information in this document is applicable to all Cisco Nexus Series switches. Some of the information in this document can also be applicable to other Cisco routing and switching platforms, such as Cisco Catalyst routers and switches.
CRC Definition
A CRC is an error detection mechanism commonly used in computer and storage networks to identify data changed or corrupted during transmission. When a device connected to the network needs to transmit data, the device runs a computation algorithm based on cyclic codes against the data that results in a fixed-length number. This fixed-length number is called the CRC value, but colloquially, it is often called the CRC for short. This CRC value is appended to the data and transmitted through the network towards another device. This remote device runs the same cyclic code algorithm against the data and compares the resulting value with the CRC appended to the data. If both values match, then the remote device assumes the data was transmitted across the network without being corrupted. If the values do not match, then the remote device assumes the data was corrupted during transmission across the network. This corrupted data cannot be trusted and is discarded.
CRCs are used for error detection across multiple computer networking technologies, such as Ethernet (both wired and wireless variants), Token Ring, Asynchronous Transfer Mode (ATM), and Frame Relay. Ethernet frames have a 32-bit Frame Check Sequence (FCS) field at the end of the frame (immediately after the payload of the frame) where a 32-bit CRC value is inserted.
For example, consider a scenario where two hosts named Host-A and Host-B are directly connected to each other through their Network Interface Cards (NICs). Host-A needs to send the sentence “This is an example” to Host-B over the network. Host-A crafts an Ethernet frame destined to Host-B with a payload of “This is an example” and calculates that the CRC value of the frame is a hexadecimal value of 0xABCD. Host-A inserts the CRC value of 0xABCD into the FCS field of the Ethernet frame, then transmits the Ethernet frame out of Host-A’s NIC towards Host-B.
When Host-B receives this frame, it will calculate the CRC value of the frame with the use of the exact same algorithm as Host-A. Host-B calculates that the CRC value of the frame is a hexadecimal value of 0xABCD, which indicates to Host-B that the Ethernet frame was not corrupted while the frame was transmitted to Host-B.
CRC Error Definition
A CRC error occurs when a device (either a network device or a host connected to the network) receives an Ethernet frame with a CRC value in the FCS field of the frame that does not match the CRC value calculated by the device for the frame.
This concept is best demonstrated through an example. Consider a scenario where two hosts named Host-A and Host-B are directly connected to each other through their Network Interface Cards (NICs). Host-A needs to send the sentence “This is an example” to Host-B over the network. Host-A crafts an Ethernet frame destined to Host-B with a payload of “This is an example” and calculates that the CRC value of the frame is the hexadecimal value 0xABCD. Host-A inserts the CRC value of 0xABCD into the FCS field of the Ethernet frame, then transmits the Ethernet frame out of Host-A’s NIC towards Host-B.
However, damage on the physical media connecting Host-A to Host-B corrupts the contents of the frame such that the sentence within the frame changes to “This was an example” instead of the desired payload of “This is an example”.
When Host-B receives this frame, it will calculate the CRC value of the frame including the corrupted payload. Host-B calculates that the CRC value of the frame is a hexadecimal value of 0xDEAD, which is different from the 0xABCD CRC value within the FCS field of the Ethernet frame. This difference in CRC values tells Host-B that the Ethernet frame was corrupted while the frame was transmitted to Host-B. As a result, Host-B cannot trust the contents of this Ethernet frame, so it will drop it. Host-B will usually increment some sort of error counter on its Network Interface Card (NIC) as well, such as the “input errors”, “CRC errors”, or “RX errors” counters.
Common Symptoms of CRC Errors
CRC errors typically manifest themselves in one of two ways:
- Incrementing or non-zero error counters on interfaces of network-connected devices.
- Packet/Frame loss for traffic traversing the network due to network-connected devices dropping corrupted frames.
These errors manifest themselves in slightly different ways depending on the device you are working with. These sub-sections go into detail for each type of device.
Received Errors on Windows Hosts
CRC errors on Windows hosts typically manifest as a non-zero Received Errors counter displayed in the output of the netstat -e command from the Command Prompt. An example of a non-zero Received Errors counter from the Command Prompt of a Windows host is here:
>netstat -e
Interface StatisticsReceived Sent
Bytes 1116139893 3374201234
Unicast packets 101276400 49751195
Non-unicast packets 0 0
Discards 0 0
Errors 47294 0
Unknown protocols 0
The NIC and its respective driver must support accounting of CRC errors received by the NIC in order for the number of Received Errors reported by the netstat -e command to be accurate. Most modern NICs and their respective drivers support accurate accounting of CRC errors received by the NIC.
RX Errors on Linux Hosts
CRC errors on Linux hosts typically manifest as a non-zero “RX errors” counter displayed in the output of the ifconfig command. An example of a non-zero RX errors counter from a Linux host is here:
$ ifconfig eth0
eth0: flags=4163<UP,BROADCAST,RUNNING,MULTICAST>  mtu 1500
        inet 192.0.2.10  netmask 255.255.255.128  broadcast 192.0.2.255
        inet6 fe80::10  prefixlen 64  scopeid 0x20<link>
        ether 08:62:66:be:48:9b  txqueuelen 1000  (Ethernet)
        RX packets 591511682  bytes 214790684016 (200.0 GiB)
        RX errors 478920  dropped 0  overruns 0  frame 0
        TX packets 85495109  bytes 288004112030 (268.2 GiB)
        TX errors 0  dropped 0 overruns 0  carrier 0  collisions 0
CRC errors on Linux hosts can also manifest as a non-zero “RX errors” counter displayed in the output of ip -s link show command. An example of a non-zero RX errors counter from a Linux host is here:
$ ip -s link show eth0
2: eth0: <BROADCAST,MULTICAST,UP,LOWER_UP> mtu 1500 qdisc mq state UP mode DEFAULT group default qlen 1000
    link/ether 08:62:66:84:8f:6d brd ff:ff:ff:ff:ff:ff
    RX: bytes  packets  errors  dropped overrun mcast
    32246366102 444908978 478920       647     0       419445867
    TX: bytes  packets  errors  dropped carrier collsns
    3352693923 30185715 0       0       0       0
    altname enp11s0
The NIC and its respective driver must support accounting of CRC errors received by the NIC in order for the number of RX Errors reported by the ifconfig or ip -s link show commands to be accurate. Most modern NICs and their respective drivers support accurate accounting of CRC errors received by the NIC.
CRC Errors on Network Devices
Network devices operate in one of two forwarding modes — Store-and-Forward forwarding mode, and Cut-Through forwarding mode. The way a network device handles a received CRC error differs depending on its forwarding modes. The subsections here will describe the specific behavior for each forwarding mode.
Input Errors on Store-and-Forward Network Devices
When a network device operating in a Store-and-Forward forwarding mode receives a frame, the network device will buffer the entire frame (“Store”) before you validate the frame’s CRC value, make a forwarding decision on the frame, and transmit the frame out of an interface (“Forward”). Therefore, when a network device operating in a Store-and-Forward forwarding mode receives a corrupted frame with an incorrect CRC value on a specific interface, it will drop the frame and increment the “Input Errors” counter on the interface.
In other words, corrupt Ethernet frames are not forwarded by network devices operating in a Store-and-Forward forwarding mode; they are dropped on ingress.
Cisco Nexus 7000 and 7700 Series switches operate in a Store-and-Forward forwarding mode. An example of a non-zero Input Errors counter and a non-zero CRC/FCS counter from a Nexus 7000 or 7700 Series switch is here:
switch# show interface
<snip>
Ethernet1/1 is up
  RX
    241052345 unicast packets  5236252 multicast packets  5 broadcast packets
    245794858 input packets  17901276787 bytes
    0 jumbo packets  0 storm suppression packets
    0 runts  0 giants  579204 CRC/FCS  0 no buffer
    579204 input error  0 short frame  0 overrun   0 underrun  0 ignored
    0 watchdog  0 bad etype drop  0 bad proto drop  0 if down drop
    0 input with dribble  0 input discard
    0 Rx pause
CRC errors can also manifest themselves as a non-zero “FCS-Err” counter in the output of show interface counters errors. The «Rcv-Err» counter in the output of this command will also have a non-zero value, which is the sum of all input errors (CRC or otherwise) received by the interface. An example of this is shown here:
switch# show interface counters errors
<snip>
--------------------------------------------------------------------------------
Port          Align-Err    FCS-Err   Xmit-Err    Rcv-Err  UnderSize OutDiscards
--------------------------------------------------------------------------------
Eth1/1                0     579204          0     579204          0           0
Input and Output Errors on Cut-Through Network Devices
When a network device operating in a Cut-Through forwarding mode starts to receive a frame, the network device will make a forwarding decision on the frame’s header and begin transmitting the frame out of an interface as soon as it receives enough of the frame to make a valid forwarding decision. As frame and packet headers are at the beginning of the frame, this forwarding decision is usually made before the payload of the frame is received.
The FCS field of an Ethernet frame is at the end of the frame, immediately after the frame’s payload. Therefore, a network device operating in a Cut-Through forwarding mode will already have started transmitting the frame out of another interface by the time it can calculate the CRC of the frame. If the CRC calculated by the network device for the frame does not match the CRC value present in the FCS field, that means the network device forwarded a corrupted frame into the network. When this happens, the network device will increment two counters:
- The “Input Errors” counter on the interface where the corrupted frame was originally received.
- The “Output Errors” counter on all interfaces where the corrupted frame was transmitted. For unicast traffic, this will typically be a single interface – however, for broadcast, multicast, or unknown unicast traffic, this could be one or more interfaces.
An example of this is shown here, where the output of the show interface command indicates multiple corrupted frames were received on Ethernet1/1 of the network device and transmitted out of Ethernet1/2 due to the Cut-Through forwarding mode of the network device:
switch# show interface
<snip>
Ethernet1/1 is up
RX
46739903 unicast packets 29596632 multicast packets 0 broadcast packets
76336535 input packets 6743810714 bytes
15 jumbo packets 0 storm suppression bytes
0 runts 0 giants 47294 CRC 0 no buffer
47294 input error 0 short frame 0 overrun 0 underrun 0 ignored
0 watchdog 0 bad etype drop 0 bad proto drop 0 if down drop
0 input with dribble 0 input discard
0 Rx pauseEthernet1/2 is up
TX
46091721 unicast packets 2852390 multicast packets 102619 broadcast packets
49046730 output packets 3859955290 bytes
50230 jumbo packets
47294 output error 0 collision 0 deferred 0 late collision
0 lost carrier 0 no carrier 0 babble 0 output discard
0 Tx pause
CRC errors can also manifest themselves as a non-zero “FCS-Err” counter on the ingress interface and non-zero «Xmit-Err» counters on egress interfaces in the output of show interface counters errors. The «Rcv-Err» counter on the ingress interface in the output of this command will also have a non-zero value, which is the sum of all input errors (CRC or otherwise) received by the interface. An example of this is shown here:
switch# show interface counters errors
<snip>
--------------------------------------------------------------------------------
Port          Align-Err    FCS-Err   Xmit-Err    Rcv-Err  UnderSize OutDiscards
--------------------------------------------------------------------------------
Eth1/1                0      47294          0      47294          0           0
Eth1/2                0          0      47294          0          0           0
The network device will also modify the CRC value in the frame’s FCS field in a specific manner that signifies to upstream network devices that this frame is corrupt. This behavior is known as “stomping” the CRC. The precise manner in which the CRC is modified varies from one platform to another, but generally, it involves inverting the current CRC value present in the frame’s FCS field. An example of this is here:
Original CRC: 0xABCD (1010101111001101)
Stomped CRC:  0x5432 (0101010000110010)
As a result of this behavior, network devices operating in a Cut-Through forwarding mode can propagate a corrupt frame throughout a network. If a network consists of multiple network devices operating in a Cut-Through forwarding mode, a single corrupt frame can cause input error and output error counters to increment on multiple network devices within your network.
Trace and Isolate CRC Errors
The first step in order to identify and resolve the root cause of CRC errors is isolating the source of the CRC errors to a specific link between two devices within your network. One device connected to this link will have an interface output errors counter with a value of zero or is not incrementing, while the other device connected to this link will have a non-zero or incrementing interface input errors counter. This suggests that traffic egresses the interface of one device intact is corrupted at the time of the transmission to the remote device, and is counted as an input error by the ingress interface of the other device on the link.
Identifying this link in a network consisting of network devices operating in a Store-and-Forward forwarding mode is a straightforward task. However, identifying this link in a network consisting of network devices operating in a Cut-Through forwarding mode is more difficult, as many network devices will have non-zero input and output error counters. An example of this phenomenon can be seen in the topology here, where the link highlighted in red is damaged such that traffic traversing the link is corrupted. Interfaces labeled with a red «I» indicate interfaces that could have non-zero input errors, while interfaces labeled with a blue «O» indicate interfaces that could have non-zero output errors.
Identifying the faulty link requires you to recursively trace the «path» corrupted frames follow in the network through non-zero input and output error counters, with non-zero input errors pointing upstream towards the damaged link in the network. This is demonstrated in the diagram here.
A detailed process for tracing and identifying a damaged link is best demonstrated through an example. Consider the topology here:
In this topology, interface Ethernet1/1 of a Nexus switch named Switch-1 is connected to a host named Host-1 through Host-1’s Network Interface Card (NIC) eth0. Interface Ethernet1/2 of Switch-1 is connected to a second Nexus switch, named Switch-2, through Switch-2’s interface Ethernet1/2. Interface Ethernet1/1 of Switch-2 is connected to a host named Host-2 through Host-2’s NIC eth0.
The link between Host-1 and Switch-1 through Switch-1’s Ethernet1/1 interface is damaged, causing traffic that traverses the link to be intermittently corrupted. However, we do not yet know that this link is damaged. We must trace the path the corrupted frames leave in the network through non-zero or incrementing input and output error counters to locate the damaged link in this network.
In this example, Host-2’s NIC reports that it is receiving CRC errors.
Host-2$ ip -s link show eth0
2: eth0: <BROADCAST,MULTICAST,UP,LOWER_UP> mtu 1500 qdisc mq state UP mode DEFAULT group default qlen 1000
    link/ether 00:50:56:84:8f:6d brd ff:ff:ff:ff:ff:ff
    RX: bytes  packets  errors  dropped overrun mcast
    32246366102 444908978 478920       647     0       419445867
    TX: bytes  packets  errors  dropped carrier collsns
    3352693923 30185715 0       0       0       0
    altname enp11s0
You know that Host-2’s NIC connects to Switch-2 via interface Ethernet1/1. You can confirm that interface Ethernet1/1 has a non-zero output errors counter with the show interface command.
Switch-2# show interface
<snip>
Ethernet1/1 is up
admin state is up, Dedicated Interface
    RX
      30184570 unicast packets  872 multicast packets  273 broadcast packets
      30185715 input packets  3352693923 bytes
      0 jumbo packets  0 storm suppression bytes
      0 runts  0 giants 0 CRC  0 no buffer
      0 input error  0 short frame  0 overrun   0 underrun  0 ignored
      0 watchdog  0 bad etype drop  0 bad proto drop  0 if down drop
      0 input with dribble  0 input discard
      0 Rx pause
    TX
      444907944 unicast packets  932 multicast packets  102 broadcast packets
      444908978 output packets  32246366102 bytes
      0 jumbo packets
      478920 output error  0 collision  0 deferred  0 late collision
      0 lost carrier  0 no carrier  0 babble  0 output discard
      0 Tx pause
Since the output errors counter of interface Ethernet1/1 is non-zero, there is most likely another interface of Switch-2 that has a non-zero input errors counter. You can use the show interface counters errors non-zero command in order to identify if any interfaces of Switch-2 have a non-zero input errors counter.
Switch-2# show interface counters errors non-zero
<snip>
--------------------------------------------------------------------------------
Port          Align-Err    FCS-Err   Xmit-Err    Rcv-Err  UnderSize OutDiscards
--------------------------------------------------------------------------------
Eth1/1                0          0     478920          0          0           0
Eth1/2                0     478920          0     478920          0           0

--------------------------------------------------------------------------------
Port         Single-Col  Multi-Col   Late-Col  Exces-Col  Carri-Sen       Runts
--------------------------------------------------------------------------------

--------------------------------------------------------------------------------
Port          Giants SQETest-Err Deferred-Tx IntMacTx-Er IntMacRx-Er Symbol-Err
--------------------------------------------------------------------------------

--------------------------------------------------------------------------------
Port         InDiscards
--------------------------------------------------------------------------------
You can see that Ethernet1/2 of Switch-2 has a non-zero input errors counter. This suggests that Switch-2 receives corrupted traffic on this interface. You can confirm which device is connected to Ethernet1/2 of Switch-2 through the Cisco Discovery Protocol (CDP) or Link Local Discovery Protocol (LLDP) features. An example of this is shown here with the show cdp neighbors command.
Switch-2# show cdp neighbors
<snip>
    Capability Codes: R - Router, T - Trans-Bridge, B - Source-Route-Bridge
    S - Switch, H - Host, I - IGMP, r - Repeater,
    V - VoIP-Phone, D - Remotely-Managed-Device,
    s - Supports-STP-Dispute

Device-ID          Local Intrfce  Hldtme Capability  Platform      Port ID
Switch-1(FDO12345678)
                    Eth1/2         125    R S I s   N9K-C93180YC- Eth1/2
You now know that Switch-2 is receiving corrupted traffic on its Ethernet1/2 interface from Switch-1’s Ethernet1/2 interface, but you do not yet know whether the link between Switch-1’s Ethernet1/2 and Switch-2’s Ethernet1/2 is damaged and causes the corruption, or if Switch-1 is a cut-through switch forwarding corrupted traffic it receives. You must log into Switch-1 to verify this.
You can confirm Switch-1’s Ethernet1/2 interface has a non-zero output errors counter with the show interfaces command.
Switch-1# show interface
<snip>
Ethernet1/2 is up
admin state is up, Dedicated Interface
    RX
      30581666 unicast packets  178 multicast packets  931 broadcast packets
      30582775 input packets  3352693923 bytes
      0 jumbo packets  0 storm suppression bytes
      0 runts  0 giants 0 CRC  0 no buffer
      0 input error  0 short frame  0 overrun   0 underrun  0 ignored
      0 watchdog  0 bad etype drop  0 bad proto drop  0 if down drop
      0 input with dribble  0 input discard
      0 Rx pause
    TX
      454301132 unicast packets  734 multicast packets  72 broadcast packets
      454301938 output packets  32246366102 bytes
      0 jumbo packets
      478920 output error  0 collision  0 deferred  0 late collision
      0 lost carrier  0 no carrier  0 babble  0 output discard
      0 Tx pause
You can see that Ethernet1/2 of Switch-1 has a non-zero output errors counter. This suggests that the link between Switch-1’s Ethernet1/2 and Switch-2’s Ethernet1/2 is not damaged — instead, Switch-1 is a cut-through switch forwarding corrupted traffic it receives on some other interface. As previously demonstrated with Switch-2, you can use the show interface counters errors non-zero command in order to identify if any interfaces of Switch-1 have a non-zero input errors counter.
Switch-1# show interface counters errors non-zero
<snip>
--------------------------------------------------------------------------------
Port          Align-Err    FCS-Err   Xmit-Err    Rcv-Err  UnderSize OutDiscards
--------------------------------------------------------------------------------
Eth1/1                0     478920          0     478920          0           0
Eth1/2                0          0     478920          0          0           0

--------------------------------------------------------------------------------
Port         Single-Col  Multi-Col   Late-Col  Exces-Col  Carri-Sen       Runts
--------------------------------------------------------------------------------

--------------------------------------------------------------------------------
Port          Giants SQETest-Err Deferred-Tx IntMacTx-Er IntMacRx-Er Symbol-Err
--------------------------------------------------------------------------------

--------------------------------------------------------------------------------
Port         InDiscards
--------------------------------------------------------------------------------
You can see that Ethernet1/1 of Switch-1 has a non-zero input errors counter. This suggests that Switch-1 is receiving corrupted traffic on this interface. We know that this interface connects to Host-1’s eth0 NIC. We can review Host-1’s eth0 NIC interface statistics to confirm whether Host-1 sends corrupted frames out of this interface.
Host-1$ ip -s link show eth0
2: eth0: <BROADCAST,MULTICAST,UP,LOWER_UP> mtu 1500 qdisc mq state UP mode DEFAULT group default qlen 1000
    link/ether 00:50:56:84:8f:6d brd ff:ff:ff:ff:ff:ff
    RX: bytes  packets  errors  dropped overrun mcast
    73146816142 423112898 0       0     0       437368817
    TX: bytes  packets  errors  dropped carrier collsns
    3312398924 37942624 0       0       0       0
    altname enp11s0
The eth0 NIC statistics of Host-1 suggest the host is not transmitting corrupted traffic. This suggests that the link between Host-1’s eth0 and Switch-1’s Ethernet1/1 is damaged and is the source of this traffic corruption. Further troubleshooting will need to be performed on this link to identify the faulty component causing this corruption and replace it.
Root Causes of CRC Errors
The most common root cause of CRC errors is a damaged or malfunctioning component of a physical link between two devices. Examples include:
- Failing or damaged physical medium (copper or fiber) or Direct Attach Cables (DACs).
- Failing or damaged transceivers/optics.
- Failing or damaged patch panel ports.
- Faulty network device hardware (including specific ports, line card Application-Specific Integrated Circuits [ASICs], Media Access Controls [MACs], fabric modules, etc.),
- Malfunctioning network interface card inserted in a host.
It is also possible for one or more misconfigured devices to inadvertently causes CRC errors within a network. One example of this is a Maximum Transmission Unit (MTU) configuration mismatch between two or more devices within the network causing large packets to be incorrectly truncated. Identifying and resolving this configuration issue can correct CRC errors within a network as well.
Resolve CRC Errors
You can identify the specific malfunctioning component through a process of elimination:
- Replace the physical medium (either copper or fiber) or DAC with a known-good physical medium of the same type.
- Replace the transceiver inserted in one device’s interface with a known-good transceiver of the same model. If this does not resolve the CRC errors, replace the transceiver inserted in the other device’s interface with a known-good transceiver of the same model.
- If any patch panels are used as part of the damaged link, move the link to a known-good port on the patch panel. Alternatively, eliminate the patch panel as a potential root cause by connecting the link without using the patch panel if possible.
- Move the damaged link to a different, known-good port on each device. You will need to test multiple different ports to isolate a MAC, ASIC, or line card failure.
- If the damaged link involves a host, move the link to a different NIC on the host. Alternatively, connect the damaged link to a known-good host to isolate a failure of the host’s NIC.
If the malfunctioning component is a Cisco product (such as a Cisco network device or transceiver) that is covered by an active support contract, you can open a support case with Cisco TAC detailing your troubleshooting to have the malfunctioning component replaced through a Return Material Authorization (RMA).
Related Information
- Nexus 9000 Cloud Scale ASIC CRC Identification & Tracing Procedure
- Technical Support & Documentation — Cisco Systems
Часть 1 Часть 2
Содержание
Самые распространенные команды по устранению неполадок портов и интерфейсов для CatOS и Cisco IOS
Основные сведения о выходных данных счетчиков портов и интерфейсов для CatOS и Cisco IOS
Команды Show Port для CatOS и Show Interfaces для Cisco IOS
Команды Show Mac для CatOS и Show Interfaces Counters для Cisco IOS
Команды Show Counters для CatOS и Show Counters Interface для Cisco IOS
Команда Show Controller Ethernet-Controller для Cisco IOS
Команда Show Top для CatOS
Распространенные сообщения о системных ошибках
Сообщения об ошибках в модулях WS-X6348
%PAGP-5-PORTTO / FROMSTP и %ETHC-5-PORTTO / FROMSTP
%SPANTREE-3-PORTDEL_FAILNOTFOUND
%SYS-4-PORT_GBICBADEEPROM: / %SYS-4-PORT_GBICNOTSUPP
Команда отклонена: [интерфейс] не является коммутационным портом
Основные сведения о выходных данных счетчиков портов и интерфейсов для CatOS и Cisco IOS
На большинстве коммутаторов имеется механизм отслеживания пакетов и ошибок, происходящих в интерфейсах и портах. Распространенные команды, используемые для нахождения сведений этого типа, описываются в разделе Самые распространенные команды по устранению неполадок портов и интерфейсов для CatOS и Cisco IOS данного документа.
Примечание: На различных платформах и выпусках счетчики могут быть реализованы по-разному. Хотя значения счетчиков весьма точны, однако конструктивно они не являются очень точными. Для сбора точных статистических данных о трафике предлагается использовать анализатор сетевых пакетов для мониторинга нужных входящих и исходящих интерфейсов.
Чрезмерное количество ошибок обычно указывает на проблему. В полудуплексном режиме нормальной является регистрация некоторого количества ошибок соединения в счетчиках FCS, выравнивания, пакетов с недопустимо малой длиной и конфликтов. Обычно один процент ошибок по отношению ко всему трафику является приемлемым для полудуплексных соединений. Если количество ошибок по отношению к входящим пакетам превысило два или три процента, может стать заметным спад производительности.
В полудуплексных средах коммутатор и подключенное устройство могут одновременно обнаружить канал и начать передачу, что приводит к конфликту. Конфликты могут вызвать появление пакетов с недопустимо малой длиной, последовательности FCS и ошибки выравнивания, так как кадр не полностью копируется в канал, что приводит к фрагментации кадра.
В дуплексном режиме значение счетчиков ошибок последовательности FCS, контрольной суммы CRC, выравнивания и пакетов с недопустимо малой длиной должно быть минимальным. Если соединение работает в режиме полного дуплекса, счетчик конфликтов неактивен. Если показания счетчиков ошибок последовательности FCS, контрольной суммы CRC, выравнивания или пакетов с недопустимо малой длиной увеличиваются, проверьте соответствие дуплексных режимов. Для определения дуплексного режима вы можете обратиться в компанию выполняющую регулярное обслуживание сетевых устройств и компьютеров вашей организации. Несоответствие дуплексных режимов возникает, когда коммутатор работает в дуплексном режиме, а подключенное устройство — в полудуплексном, или наоборот. Следствиями несоответствия дуплексных режимов являются чрезвычайно медленная передача, периодические сбои подключения и потеря связи. Другие возможные причины ошибок канала передачи данных в полнодуплексном режиме — дефекты кабелей, неисправные порты коммутатора, программные или аппаратные неполадки сетевой платы. Дополнительные сведения см. в разделе Распространенные проблемы портов и интерфейсов данного документа.
Команды Show Port для CatOS и Show Interfaces для Cisco IOS
Команда show port {mod/port} используется в ОС CatOS в модуле Supervisor. Альтернатива этой команды — команда show port counters {mod/port}, которая отображает только счетчики ошибок портов. Описание выходных данных счетчиков ошибок см. в таблице 1.
   Switch> (enable) sh port counters 3/1
   Port  Align-Err  FCS-Err    Xmit-Err   Rcv-Err    UnderSize
  ----- ---------- ---------- ---------- ---------- ---------
   3/1           0          0          0          0         0
   Port  Single-Col Multi-Coll Late-Coll  Excess-Col Carri-Sen Runts     Giants
  ----- ---------- ---------- ---------- ---------- --------- --------- ---------
   3/1          0         0         0           0            0         0         0
Команда show interfaces card-type {slot/port} — эквивалентная команда для Cisco IOS в модуле Supervisor. Альтернативой данной команды (для коммутаторов серии Catalyst 6000, 4000, 3550, 2970 2950/2955 и 3750) является команда show interfaces card-type {slot/port} counters errors , которая отображает счетчики ошибок интерфейсов.
Примечание: Для коммутаторов серии 2900/3500XL используйте только команду show interfaces card-type {slot/port} с командной show controllers Ethernet-controller .
 Router#sh interfaces fastEthernet 6/1
FastEthernet6/1 is up, line protocol is up (connected)
Hardware is C6k 100Mb 802.3, address is 0009.11f3.8848 (bia 0009.11f3.8848)
MTU 1500 bytes, BW 100000 Kbit, DLY 100 usec,
reliability 255/255, txload 1/255, rxload 1/255
Encapsulation ARPA, loopback not set    Full-duplex, 100Mb/s
input flow-control is off, output flow-control is off
ARP type: ARPA, ARP Timeout 04:00:00
Last input 00:00:14, output 00:00:36, output hang never
Last clearing of "show interface" counters never
Input queue: 0/2000/0/0 (size/max/drops/flushes);
Total output drops: 0    Queueing strategy: fifo
Output queue :0/40 (size/max)
5 minute input rate 0 bits/sec, 0 packets/sec
5 minute output rate 0 bits/sec, 0 packets/sec
Команда show interfaces выдает на экран выходные данные до описанной здесь точки (по порядку):
-
up, line protocol is up (connected) — Первое «up» относится к состоянию физического уровня интерфейса. Сообщение «line protocol up» показывает состояние уровня канала передачи данных для данного интерфейса и означает, что интерфейс может отправлять и принимать запросы keepalive.
-
MTU – максимальный размер передаваемого блока данных (MTU) составляет 1500 байт для Ethernet по умолчанию (максимальный размер блока данных кадра).
-
Full-duplex, 100Mb/s (полнодуплексный, 100 Мбит/с) — текущая скорость и режим дуплексирования для данного интерфейса. Но это не позволяет узнать, использовалось ли для этого автоматическое согласование.
-
Последние входные, выходные данные — число часов, минут и секунд с момента последнего успешного приема или передачи интерфейсом пакета. Полезно знать время отказа заблокированного интерфейса.
-
Последнее обнуление счетчиков «show interface» — время последнего применения команды clear counters после последней перезагрузки коммутатора. Команда clear counters используется для сброса статистики интерфейса.
Примечание: Переменные, которые могут повлиять на маршрутизацию (например, на загрузку и надежность), не очищаются вместе со счетчиками.
-
Очередь входа — число пакетов в очереди входа. Size/max/drops = текущее число кадров в очереди/максимальное число кадров в очереди (до начала потерь кадров)/фактическое число потерянных кадров из-за превышения максимального числа кадров. Сбросы используется для подсчета выборочного отбрасывания пакетов на коммутаторах серии Catalyst 6000 с ОС Cisco IOS. (Счетчик сбросов может использоваться, но его показания не увеличиваются на коммутаторах серии Catalyst 4000 с Cisco IOS.) Выборочное отбрасывание пакетов — механизм быстрого отбрасывания пакетов с низким приоритетом в случае перегрузки ЦПУ, чтобы сохранить некоторые вычислительные ресурсы для пакетов с высоким приоритетом.
-
Общее число выходных сбросов – количество пакетов, сброшенных из-за заполнения очереди выхода. Типичной причиной этого может быть коммутация трафика из канала с высокой пропускной способностью в канал с меньшей пропускной способностью, либо коммутация трафика из нескольких входных каналов в один выходной канал. Например, если большой объем пульсирующего трафика поступает в гигабитный интерфейс и переключается на интерфейс 100 Мбит/с, это может вызвать увеличение отбрасывания исходящего трафика на интерфейсе 100 Мбит/с. Это происходит потому, что очередь выхода на указанном интерфейсе переполняется избыточным трафиком из-за несоответствия скорости входящей и исходящей полосы пропускания.
-
Очередь выхода — число пакетов в очереди выхода. Size/max означает текущее число кадров в очереди/максимальное количество кадров, которое может находиться в очереди до заполнения, после чего начинается отбрасывание кадров.
-
Пятиминутная скорость ввода/вывода – средняя скорость ввода и вывода, которая наблюдалась интерфейсом за последние пять минут. Чтобы получить более точные показания за счет указания более короткого периода времени (например, для улучшения обнаружения всплесков трафика), выполните команду интерфейса load-interval <секунды>.
В остальной части выходных данных команды show interfaces отображаются показания счетчиков ошибок, которые аналогичны или эквивалентны показаниям счетчиков ошибок в CatOS.
Команда show interfaces card-type {slot/port} counters errors эквивалентна команде Cisco IOS для отображения счетчиков портов для CatOS. Описание выходных данных счетчиков ошибок см. в таблице 1.
Router#sh interfaces fastEthernet 6/1 counters errors
Port        Align-Err    FCS-Err   Xmit-Err    Rcv-Err   UnderSize    OutDiscards  Fa6/1
                 0           0        0          0            0          0
Port      Single-Col Multi-Col  Late-Col Excess-Col Carri-Sen     Runts    Giants  Fa6/1
                 0        0        0         0           0         0       0
Таблица 1.
Сведения о счетчиках ошибок CatOS содержатся в выходных данных команды show port или show port counters для коммутаторов серии Cisco Catalyst 6000, 5000 и 4000. Сведения о счетчиках ошибок Cisco IOS содержатся в выходных данных команды show interfaces или show interfaces card-type x/y counters errors для коммутаторов серии Catalyst 6000 и 4000
|
Счетчики (в алфавитном порядке) |
Описание и распространенные причины увеличения значений счетчиков ошибок |
|---|---|
|
Align-Err |
Описание: CatOS sh port и Cisco IOS sh interfaces counters errors. Количество ошибок выравнивания определяется числом полученных кадров, которые не заканчиваются четным числом октетов и имеют неверную контрольную сумму CRC. Распространенные причины: они обычно являются результатом несоответствия дуплексных режимов или физической проблемы (такой как прокладка кабелей, неисправный порт или сетевая плата). При первом подключении кабеля к порту могут возникнуть некоторые из этих ошибок. Кроме того, если к порту подключен концентратор, ошибки могут вызвать конфликты между другими устройствами концентратора. Исключения для платформы: ошибки выравнивания не подсчитываются в Catalyst 4000 Series Supervisor I (WS-X4012) или Supervisor II (WS-X4013). |
|
Перекрестные помехи |
Описание: Cisco IOS sh interfaces счетчик. Счетчик CatOS, указывающий на истечение срока таймера передачи сбойных пакетов. Сбойный пакет — это кадр длиной свыше 1518 октетов (без кадрирующих битов, но с октетами FCS), который не заканчивается четным числом октетов (ошибка выравнивания) или содержит серьезную ошибку FCS). |
|
Carri-Sen |
Описание: CatOS sh port и Cisco IOS sh interfaces counters errors. Значение счетчика Carri-Sen (контроль несущей) увеличивается каждый раз, когда контроллер Ethernet собирается отослать данные по полудуплексному соединению. Контроллер обнаруживает провод и перед передачей проверяет, не занят ли он. Распространенные причины: это нормально для полудуплексного сегмента Ethernet. |
|
конфликты |
Описание: Cisco IOS sh interfaces счетчик. Число конфликтов, произошедших до того, как интерфейс успешно передал кадр носителю. Распространенные причины: это нормальное явление для полудуплексных интерфейсов, но не для полнодуплексных интерфейсов. Быстрый рост числа конфликтов указывает на высокую загрузку соединения или возможное несоответствие дуплексных режимов с присоединенным устройством. |
|
CRC |
Описание: Cisco IOS sh interfaces счетчик. Значение данного счетчика увеличивается, когда контрольная сумма CRC, сгенерированная исходящей станцией ЛВС или устройством на дальнем конце, не соответствует контрольной сумме, рассчитанной по принятым данным. Распространенные причины: обычно это означает проблемы с шумами или передачей в интерфейсе ЛВС или самой ЛВС. Большое значение счетчика CRC обычно является результатом конфликтов, но может указывать на физическую неполадку (такую как проводка кабелей, неправильный интерфейс или неисправная сетевая плата) или несоответствие дуплексных режимов. |
|
deferred |
Описание: Cisco IOS sh interfaces счетчик. Число кадров, успешно переданных после ожидания освобождения носителя. Распространенные причины: они обычно наблюдаются в полудуплексных средах, в которых несущая уже используется при попытке передачи кадра. |
|
pause input |
Описание: Cisco IOS show interfaces счетчик. Приращение значения счетчика «pause input» означает, что подключенное устройство запрашивает приостановку трафика, когда его буфер приема почти заполнен. Распространенные причины: приращение показаний этого счетчика служит в информационных целях, так как коммутатор принимает данный кадр. Передача пакетов с запросом приостановки прекращается, когда подключенное устройство способно принимать трафик. |
|
input packetswith dribble condition |
Описание: Cisco IOS sh interfaces счетчик. Битовая ошибка указывает, что кадр слишком длинный. Распространенные причины: приращение показаний счетчика ошибок в кадрах служит в информационных целях, так как коммутатор принимает данный кадр. |
|
Excess-Col |
Описание: CatOS sh port и Cisco IOS sh interfaces counters errors. Количество кадров, для которых передача через отдельный интерфейс завершилась с ошибкой из-за чрезмерного числа конфликтов. Избыточный конфликт возникает, когда для некоторого пакета конфликт регистрируется 16 раз подряд. Затем пакет отбрасывается. Распространенные причины: чрезмерное количество конфликтов обычно обозначает, что нагрузку на данный сегмент необходимо разделить между несколькими сегментами, но может также указывать на несоответствие дуплексных режимов с присоединенным устройством. На интерфейсах, сконфигурированных в качестве полнодуплексных, конфликты наблюдаться не должны. |
|
FCS-Err |
Описание: CatOS sh port и Cisco IOS sh interfaces counters errors. Число кадров допустимого размера с ошибками контрольной последовательности кадров (FCS), но без ошибок кадрирования. Распространенные причины: обычно это указывает на физическую проблему (такую как прокладка кабелей, неисправный порт или сетевая плата), однако также может означать несоответствие дуплексных режимов. |
|
кадр |
Описание: Cisco IOS sh interfaces счетчик. Число неправильно принятых пакетов с ошибками контрольной суммы CRC и нецелым числом октетов (ошибка выравнивания). Распространенные причины: обычно это вызвано конфликтами или физической проблемой (например, проводкой кабелей, неисправным портом или сетевой платой), а также может указывать на несоответствие дуплексных режимов. |
|
Кадры с недопустимо большой длиной |
Описание: CatOS sh port и Cisco IOS sh interfaces и sh interfaces counters errors. Полученные кадры, размеры которых превышают максимально допускаемые стандартом IEEE 802.3 (1518 байт для сетей Ethernet без поддержки jumbo-кадров) и обладают неверной последовательностью FCS. Распространенные причины: во многих случаях это следствие поврежденной сетевой интерфейсной платы. Попробуйте найти проблемное устройство и удалить его из сети. Исключения для платформ: коммутаторы серии Catalyst Cat4000 с Cisco IOS версии, предшествующей 12.1(19)EW, показания счетчика кадров с недопустимо большой величиной увеличиваются в случае кадра размером > 1518 байтов. После версии 12.1(19)EW кадры giant в выходных данных команды show interfaces учитываются только в случае приема кадра размером > 1518 байтов с неверной последовательностью FCS. |
|
ignored |
Описание: Cisco IOS sh interfaces счетчик. Количество полученных пакетов, проигнорированных интерфейсом из-за недостатка места во внутренних буферах оборудования интерфейса. Распространенные причины: широковещательный шторм и всплески помех могут вызвать рост показаний данного счетчика. |
|
Ошибки ввода |
Описание: Cisco IOS sh interfaces счетчик. Распространенные причины: в счетчике учитываются ошибки кадров, кадры с недопустимо маленькой или недопустимо большой величиной, кадры, отброшенные из-за переполнения буфера, несоответствия значения контрольной суммы CRC или перегрузки, а также проигнорированные пакеты. Другие ошибки, относящиеся к входным данным, также могут увеличивать количество ошибок ввода; некоторые датаграммы могут содержать несколько ошибок. Поэтому эта сумма может не совпадать с суммой перечисленных ошибок ввода. Также см. раздел Ошибки ввода в интерфейсе уровня 3, подключенном к порту коммутатора уровня 2. |
|
Late-Col |
Описание: CatOS sh port и Cisco IOS sh interfaces и sh interfaces counters errors. Количество обнаруженных конфликтов в определенном интерфейсе на последних этапах процесса передачи. Для порта со скоростью 10 Мбит/с это позднее, чем время передачи 512 битов для пакета. В системе со скоростью передачи данных 10 Мбит/с 512 битовых интервалов соответствуют 51,2 микросекунды. Распространенные причины: это ошибка, в частности, может указывать на несоответствие дуплексных режимов. В сценарии с несоответствием дуплексных режимов на стороне с полудуплексным режимом наблюдается поздний конфликт. Во время передачи со стороны с полудуплексным режимом на стороне с дуплексным режимом выполняется одновременная передача без ожидания своей очереди, что приводит к возникновению позднего конфликта. Поздние конфликты также могут указывать на слишком большую длину кабеля или сегмента Ethernet. На интерфейсах, сконфигурированных в качестве полнодуплексных, конфликты наблюдаться не должны. |
|
lost carrier |
Описание: Cisco IOS sh interfaces счетчик. Число потерь несущей во время передачи. Распространенные причины: проверьте исправность кабеля. Проверьте физическое соединение на обеих сторонах. |
|
Multi-Col |
Описание: CatOS sh port и Cisco IOS sh interfaces counters errors. Число множественных конфликтов произошедших до того, как порт успешно передал кадр носителю. Распространенные причины: это нормальное явление для полудуплексных интерфейсов, но не для полнодуплексных интерфейсов. Быстрый рост числа конфликтов указывает на высокую загрузку соединения или возможное несоответствие дуплексных режимов с присоединенным устройством. |
|
no buffer |
Описание: Cisco IOS sh interfaces счетчик. Число принятых пакетов, которые отвергнуты из-за отсутствия буферного пространства. Распространенные причины: сравните со счетчиком пропущенных пакетов. Часто такие ошибки вызываются широковещательными штормами. |
|
Отсутствует несущая |
Описание: Cisco IOS sh interfaces счетчик. Сколько раз несущая отсутствовала во время передачи. Распространенные причины: проверьте исправность кабеля. Проверьте физическое соединение на обеих сторонах. |
|
Out-Discard |
Описание: количество исходящих пакетов, которые выбраны для отбрасывания несмотря на отсутствие ошибок Распространенные причины: одна возможная причина отбрасывания таких пакетов — освобождение буферного пространства. |
|
output buffer failuresoutput buffers swapped out |
Описание: Cisco IOS sh interfaces счетчик. Число буферов с ошибками и число выгруженных буферов. Распространенные причины: порт размещает пакеты в буфере Tx, когда скорость поступающего в порт трафика высока и порт не может обработать такой объем трафика. Порт начинает пропускать пакеты в случае заполнения буфера Tx, при этом увеличиваются значения счетчиков недогрузок и сбоев выходных буферов. Увеличение значений счетчиков сбоев выходных буферов может означать, что порты работают с минимальными настройками скорости и/или дуплексного режима, или через порт проходит слишком большой объем трафика. Например, рассмотрите сценарий, в котором гигабайтный многоадресный поток пересылается 24 портам с пропускной способностью 100 Мбит/с. Если выходной интерфейс перегружен, обычно наблюдаются сбои выходного буфера, число которых растет вместе с числом выходящих отброшенных пакетов (Out-Discards). Сведения об устранении неполадок см. в разделе Отложенные кадры (Out-Lost или Out-Discard) данного документа. |
|
output errors |
Описание: Cisco IOS sh interfaces счетчик. Сумма всех ошибок, препятствовавших целевой передаче датаграмм от заданного интерфейса. |
|
overrun (переполнение) |
Описание: сколько раз аппаратному оборудованию приемника не удалось поместить принятые данные в аппаратный буфер. Распространенные причины: входящая скорость трафика превысила способность приемника к обработке данных. |
|
packets input/output |
Описание: Cisco IOS sh interfaces счетчик. Общее количество безошибочных пакетов, полученных и переданных на данном интерфейсе. Мониторинг приращений показаний этих счетчиков полезен при проверке правильного прохождения трафика через интерфейс. Счетчик байтов включает эти данные и инкапсуляцию MAC-адресов в безошибочные пакеты, принятые и переданные системой. |
|
Rcv-Err |
Описание: CatOS show port или show port counters и Cisco IOS (только для коммутаторов серии Catalyst 6000) «sh interfaces counters error». Распространенные причины: см. исключения для платформ. Исключения для платформ: коммутаторы серии Catalyst 5000 rcv-err = сбои буферов приема. Например, кадры недопустимо маленькой или недопустимо большой величины или ошибки последовательности FCS (FCS-Err) не приводят к увеличению значения счетчика rcv-err. Значение счетчика rcv-err для 5K увеличивается только в случае избыточного трафика. В отличие от коммутаторов серии Catalyst 5000 на коммутаторах серии Catalyst 4000 значение rcv-err равно сумме всех ошибок приема, т.е. значение счетчика rcv-err увеличивается в случае регистрации таких ошибок, как прием интерфейсом кадров с недопустимо маленькой или недопустимо большой величиной или ошибки последовательности FCS. |
|
Кадры с недопустимо маленькой величиной |
Описание: CatOS sh port и Cisco IOS sh interfaces и sh interfaces counters errors. Принятые кадры с размером меньше минимального размера кадра IEEE 802.3 (64 байта для Ethernet) и неверной контрольной суммой CRC. Распространенные причины: это может быть вызвано несоответствием дуплексных режимов и физическими проблемами, такими как неисправный кабель, порт или сетевая плата на присоединенном устройстве. Исключения для платформ: на коммутаторах серии Catalyst 4000 с Cisco IOS версии, предшествующей версии 12.1(19)EW, кадры с недопустимо маленькой величиной — это кадры размера undersize. Undersize = кадр < 64 байтов. Значение счетчика кадров с недопустимо маленькой величиной увеличивается при получении кадра размером менее 64 байтов. После версии 12.1(19)EW кадр с недопустимо маленькой величиной = фрагмент. Фрагмент — это кадр < 64 байта с неверной контрольной суммой CRC. В результате значение счетчика кадров с недопустимо маленькой величиной увеличивается в show interfacesвместе со счетчиком фрагментов в show interfaces counters errors при получении кадра < 64 байтов с неверной контрольной суммой CRC. |
|
Single-Col |
Описание: CatOS sh port и Cisco IOS sh interfaces counters errors. Число конфликтов, произошедших до того, как интерфейс успешно передал кадр носителю. Распространенные причины: это нормальное явление для полудуплексных интерфейсов, но не для полнодуплексных интерфейсов. Быстрый рост числа конфликтов указывает на высокую загрузку соединения или возможное несоответствие дуплексных режимов с присоединенным устройством. |
|
underruns |
Описание: сколько раз скорость передатчика превышала возможности коммутатора. Распространенные причины: это может происходить в случае высокой пропускной способности, когда через интерфейс проходит большой объем пульсирующего трафика от многих других интерфейсов одновременно. В случае недогрузки возможен сброс интерфейса. |
|
Undersize |
Описание: CatOS sh port и Cisco IOS sh interfaces counters errors. Полученные фреймы с размером меньше минимального размера фрейма в стандарте IEEE 802.3, равного 64 байтам (без битов кадрирования, но с октетами FCS), но хорошо сформированных во всем остальном. Распространенные причины: проверьте устройство, отправляющее такие кадры. |
|
Xmit-Err |
Описание: CatOS sh port и Cisco IOS sh interfaces counters errors. Это указывает на заполнение внутреннего буфера отправки (Tx). Распространенные причины: часто ошибки Xmit-Err возникают из-за передачи трафика из канала с высокой пропускной способностью в канал с меньшей пропускной способностью или трафика из нескольких входящих каналов в один исходящий. Например, если большой объем пульсирующего трафика поступает в гигабитный интерфейс и переключается на интерфейс на 100 Мбит/с, на 100-мегабитном интерфейсе это может вызывать приращение значения счетчика Xmit-Err. Это происходит потому, что выходной буфер заданного интерфейса переполняется избыточным трафиком из-за несоответствия скорости входящей и исходящей полосы пропускания. |
Команды Show Mac для CatOS и Show Interfaces Counters для Cisco IOS
Команда show mac {mod/port} полезна при использовании CatOS в модуле Supervisor для отслеживания входящего и исходящего трафика данного порта в соответствии с показаниями счетчиков приема (Rcv) и передачи (Xmit) для трафика одноадресной, многоадресной и широковещательной рассылки. Эти выходные данные получены от Catalyst 6000, использующего CatOS:
Console> (enable) sh mac 3/1 Port Rcv-Unicast Rcv-Multicast Rcv-Broadcast-------- -------------------- -------------------- --------------------3/1 177 256272 3694Port Xmit-Unicast Xmit-Multicast Xmit-Broadcast-------- -------------------- -------------------- --------------------3/1 30 680377 153Port Rcv-Octet Xmit-Octet-------- -------------------- --------------------3/1 22303565 48381168 MACDely-Exced MTU-Exced In-Discard Out-Discard-------- ---------- ---------- ---------- -----------3/1 0 0 233043 17Port Last-Time-Cleared----- --------------------------3/1 Sun Jun 1 2003, 12:22:47
В данной команде также используются следующие счетчики ошибок: Dely-Exced, MTU-Exced, In-Discard и Out-Discard.
-
Dely-Exced — количество кадров, отклоненных данным портом из-за чрезмерной задержки передачи данных через коммутатор. Показания данного счетчика растут только при очень интенсивном использовании порта.
-
MTU Exceed — это показатель того, что одно из устройств на данном порту или сегменте передает объем данных больше, чем разрешено размером кадра (1518 байт для сети Ethernet без поддержки jumbo-кадров).
-
In-Discard – результат обработки допустимых входящих кадров, которые были отброшены, поскольку их коммутация не требовалась. Это может быть нормальным, если концентратор подключен к порту и два устройства на данном концентраторе обмениваются данными. Порт коммутатора продолжает видеть данные, но не переключает его (так как в таблице CAM отображается MAC-адрес обоих устройств, связанных с одним и тем же портом). Поэтому трафик отбрасывается. Значение данного счетчика также увеличивается в случае порта, настроенного в качестве магистрали, если данная магистраль блокирует некоторые сети VLAN, или в случае порта, который является единственным членом некоторой сети VLAN.
-
Out-Discard (Число отбрасываемых исходящих пакетов) – число исходящих пакетов, которые выбраны для отбрасывания несмотря на отсутствие ошибок. Одна из возможных причин отбрасывания таких пакетов — освобождение буферного пространства.
-
In-Lost — на коммутаторах серии Catalyst 4000; этот счетчик представляет собой сумму всех пакетов с ошибками, полученных данным портом. С другой стороны на коммутаторах серии Catalyst 5000 счетчик In-Lost отслеживает сумму всех сбоев буферов приема.
-
Out-Lost — на коммутаторах серии Catalyst 4000 и 5000 учитываются исходящие кадры, которые были потеряны до пересылки (из-за недостатка буферного пространства). Обычно это вызывается перегрузкой порта.
Команда show interfaces card-type {slot/port} counters используется при выполнении Cisco IOS в модуле Supervisor.
Команда show counters [mod/port] предоставляет еще более подробную статистику для портов и интерфейсов. Эта команда доступна для CatOS, а эквивалентная ей команда show counters interface card-type {slot/port} была введена в Cisco IOS версии 12.1(13)E только для коммутаторов серии Catalyst 6000. Эти команды отображают 32- и 64-разрядные счетчики ошибок для каждого порта или интерфейса. Дополнительные сведения см. в документации по командам CatOS show counters.
Команда Show Controller Ethernet-Controller для Cisco IOS
На коммутаторах серии Catalyst 3750, 3550, 2970, 2950/2955, 2940 и 2900/3500XL используйте команду «show controller ethernet-controller» для отображения выходных данных счетчика трафика и счетчика ошибок, которые аналогичны выходным данным команд sh port, sh interface, sh mac и show counters для коммутаторов серии Catalyst 6000, 5000 и 4000.
|
Счетчик |
Описание |
Возможные причины |
|---|---|---|
|
Переданные кадры |
||
|
Отброшенные кадры |
Общее количество кадров, попытка передачи которых прекращена из-за недостатка ресурсов. В это общее количество входят кадры всех типов назначения. |
Отбрасывание кадров вызвано чрезмерной нагрузкой трафиком данного интерфейса. Если в этом поле наблюдается рост числа пакетов, уменьшите нагрузку на данный интерфейс. |
|
Устаревшие кадры |
Число кадров, передача которых через коммутатор заняла более двух секунд. По этой причине они были отброшены коммутатором. Это случается только в условиях экстремально высокой нагрузки. |
Отбрасывание кадров вызвано чрезмерной нагрузкой трафиком данного коммутатора. Если в этом поле наблюдается рост числа пакетов, уменьшите нагрузку на данный коммутатор. Может потребоваться изменение топологии сети, чтобы снизить нагрузку трафиком данного коммутатора. |
|
Deferred frames (отложенные кадры) |
Общее число кадров, первая попытка передачи которых была отложена из-за трафика в сетевом носителе. В это общее число входят только кадры, которые в последствии передаются без ошибок и конфликтов. |
Отбрасывание кадров вызвано чрезмерной нагрузкой трафика, направленного к данному коммутатору. Если в этом поле наблюдается рост числа пакетов, уменьшите нагрузку на данный коммутатор. Может потребоваться изменение топологии сети, чтобы снизить нагрузку трафика на данный коммутатор. |
|
Collision frames (кадры с конфликтами) |
В счетчиках кадров с конфликтами содержится число пакетов, одна попытка передачи которых была неудачной, а следующая — успешной. Это означает, что в случае увеличения значения счетчика кадров с конфликтами на 2, коммутатор дважды неудачно пытался передать пакет, но третья попытка была успешной. |
Отбрасывание кадров вызвано чрезмерной нагрузкой трафиком данного интерфейса. Если в этих полях наблюдается рост числа пакетов, уменьшите нагрузку на данный интерфейс. |
|
Excessive collisions (частые конфликты) |
Значение счетчика частых конфликтов возрастает после возникновения 16 последовательных поздних конфликтов. Через 16 попыток отправки пакета, он отбрасывается, а значение счетчика возрастает. |
Увеличение значения этого счетчика указывает на проблему с проводкой, чрезмерно загруженную сеть или несоответствие дуплексных режимов. Чрезмерная загрузка сети может быть вызвана совместным использованием сети Ethernet слишком большим числом устройств. |
|
Late collisions (поздние конфликты) |
Поздний конфликт возникает, когда два устройства передают одновременно, но конфликт не обнаруживается ни одной из сторон соединения. Причина этого заключается в том, что время передачи сигнала с одного конца сети к другому превышает время, необходимое, чтобы поместить целый пакет в сеть. Два устройства, вызвавшие поздний конфликт, никогда не видят пакет, отправляемый другим устройством, пока он не будет полностью помещен в сеть. Поздние конфликты обнаруживаются передатчиком только после истечения первого временного интервала для передачи 64 байтов. Это связано с тем, что конфликты обнаруживаются только при передаче пакетов длиннее 64 байтов. |
Поздние конфликты являются следствием неправильной прокладки кабелей или несовместимого числа концентраторов в сети. Неисправные сетевые платы также могут вызывать поздние конфликты. |
|
Хорошие кадры (1 конфликт) |
Общее число кадров, которые испытали только один конфликт, а затем были успешно переданы. |
Конфликты в полудуплексной среде — обычное ожидаемое поведение. |
|
Хорошие кадры (> 1 конфликта) |
Общее число кадров, которые испытали от 2 до 15 конфликтов включительно, а затем были успешно переданы. |
Конфликты в полудуплексной среде — обычное ожидаемое поведение. По мере приближения к верхнему пределу данного счетчика для таких кадров возрастает риск превышения 15 конфликтов и причисления к частым конфликтам. |
|
Отброшенные кадры сети VLAN |
Число кадров, отброшенных интерфейсом из-за задания бита CFI. |
Биту Canonical Format Indicator (CFI) в TCI кадра 802.1q задается значение 0 для канонического формата кадра Ethernet. Если биту CFI задано значение 1, это указывает на наличие поля сведений о маршрутизации (RIF) или неканонического кадра Token Ring, который отброшен. |
|
Received Frames (принятые кадры) |
||
|
No bandwidth frames (кадры с недостатком пропускной способности) |
Только 2900/3500XL. Количество раз, которое порт принимал пакеты из сети, но у коммутатора не было ресурсов для его принятия. Это случается только в условиях высокой нагрузки, но может произойти и в случае всплесков трафика на нескольких портах. Таким образом, небольшое число в поле «No bandwidth frames» – не повод для беспокойства. (Оно должно оставаться намного меньше одного процента принятых кадров.) |
Отбрасывание кадров вызвано чрезмерной нагрузкой трафиком данного интерфейса. Если в этом поле наблюдается рост числа пакетов, уменьшите нагрузку на данный интерфейс. |
|
No buffers frames (кадры без буфера) |
Только 2900/3500XL. Количество раз, которое порт принимал пакеты из сети, но у коммутатора не было ресурсов для его принятия. Это случается только в условиях высокой нагрузки, но может произойти и в случае всплесков трафика на нескольких портах. Таким образом, небольшое число в поле «No buffers frames» – не повод для беспокойства. (Оно должно оставаться намного меньше одного процента принятых кадров.) |
Отбрасывание кадров вызвано чрезмерной нагрузкой трафиком данного интерфейса. Если в этом поле наблюдается рост числа пакетов, уменьшите нагрузку на данный интерфейс. |
|
No dest, unicast (одноадресные пакеты без назначения) |
Это число одноадресных пакетов, которые не были пересланы данным портом другим портам. |
Ниже дается краткое описание случаев, когда значение счетчиков «No dest» (unicast, multicast и broadcast) может возрастать.
|
|
No dest, multicast (многоадресные пакеты без назначения) |
Это число многоадресных пакетов, которые не были пересланы данным портом другим портам. |
|
|
No dest,broadcast (широковещательные пакеты без назначения) |
Это число широковещательных пакетов, которые не были пересланы данным портом другим портам. |
|
|
Alignment errors (ошибки выравнивания) |
Ошибки выравнивания определяются числом полученных кадров, которые не заканчиваются четным количеством октетов и имеют неверную контрольную сумму CRC. |
Ошибки выравнивания вызываются неполным копированием кадра в канал, что приводит к фрагментированным кадрам. Ошибки выравнивания являются результатом конфликтов при несоответствии дуплексных режимов, неисправном оборудовании (сетевой плате, кабеле или порте), или подключенное устройство генерирует кадры, не завершающиеся октетом, или с неверной последовательностью FCS. |
|
FCS errors (ошибки FCS) |
Число ошибок последовательности FCS соответствует числу кадров, принятых с неверной контрольной суммой (CRC) в кадре Ethernet. Такие кадры отбрасываются и не передаются на другие порты. |
Ошибки FCS являются результатом конфликтов в случае несоответствия дуплексных режимов, неисправного оборудования (сетевая плата, кабель или порт) или кадров с неверной последовательностью FCS, формируемых подключенным устройством. |
|
Undersize frames (неполномерные кадры) |
Это общее число принятых пакетов с длиной менее 64 октетов (без битов кадрирования, но с октетами FCS) и допустимым значением FCS. |
Это указывает на поврежденный кадр, сформированный подключенным устройством. Убедитесь, что подключенное устройство функционирует правильно. |
|
Oversize frames (кадры избыточного размера) |
Число принятых портом из сети пакетов с длиной более 1514 байтов. |
Это может указывать на сбой оборудования либо проблемы конфигурации режима магистрального соединения для dot1q или ISL. |
|
Collision fragments (фрагменты с конфликтами) |
Общее число кадров с длиной менее 64 октетов (без битов кадрирования, но с октетами FCS) и неверным значением FCS. |
Увеличение значения этого счетчика указывает на то, что порты настроены на полудуплексный режим. Установите в настройках дуплексный режим. |
|
Overrun frames (кадры с переполнением) |
Количество раз, которое оборудованию приемника не удалось поместить принятые данные в аппаратный буфер. |
Входящая скорость трафика превысила способность приемника к обработке данных. |
|
VLAN filtered frames (кадры, отфильтрованные по сети VLAN) |
Общее число кадров, отфильтрованных по типу содержащейся в них информации о сети VLAN. |
Порт можно настроить на фильтрацию кадров с тегами 802.1Q. При получении кадра с тегом 802.1Q он фильтруется, а значение счетчика увеличивается. |
|
Source routed frames (кадры с маршрутом источника) |
Общее число полученных кадров, которые были отброшены из-за задания бита маршрута источника в адресе источника собственного кадра. |
Этот тип маршрутизации источников определен только для Token Ring и FDDI. Спецификация IEEE Ethernet запрещает задание этого бита в кадрах Ethernet. Поэтому коммутатор отбрасывает такие кадры. |
|
Valid oversize frames (допустимые кадры избыточного размера) |
Общее число полученных кадров с длиной, превышающей значение параметра System MTU, но с правильными значениями FCS. |
В данном случае собирается статистика о кадрах с длиной превышающей настроенное значение параметра System MTU, размер которых можно увеличить с 1518 байтов до размера, разрешенного для инкапсуляции Q-in-Q или MPLS. |
|
Symbol error frames (кадры с ошибками символа) |
В Gigabit Ethernet (1000 Base-X) используется кодирование 8B/10B для преобразования 8-битных данных из MAC-подуровня (уровень 2) в 10-битный символ для отправки по проводу. Когда порт получает символ, он извлекает 8-битные данные из данного символа (10 битов). |
Символьная ошибка означает, что интерфейс обнаружил прием неопределенного (недопустимого) символа. Небольшое число символьных ошибок можно игнорировать. Большое число символьных ошибок может указывать на неисправность устройства, кабеля или оборудования. |
|
Invalid frames, too large (недопустимые кадры, слишком большие) |
Кадры с недопустимо большой величиной или полученные кадры с неверной последовательностью FCS, размер которых превышает размер максимального кадра в IEEE 802.3 (1518 байт для сетей Ethernet без поддержки jumbo-кадров). |
В большинстве случаев это является следствием поврежденной сетевой интерфейсной платы. Попробуйте найти проблемное устройство и удалить его из сети. |
|
Invalid frames, too small (недопустимые кадры, слишком маленькие) |
Кадры с недопустимо маленькой величиной или кадры, размером менее 64 байта (с битами FCS, но без заголовка кадра) и недопустимым значением FCS или ошибкой выравнивания. |
Это может произойти из-за несоответствия дуплексных режимов и физических проблем, таких как неисправный кабель, порт или сетевая плата на подключенном устройстве. |
Команда Show Top для CatOS
Команда show top позволяет собирать и анализировать данные о каждом физическом порте коммутатора. Данная команда для каждого физического порта отображает следующие данные:
-
уровень загрузки порта (Uti %)
-
число входящих и исходящих байтов (Bytes)
-
число входящих и исходящих пакетов (Pkts)
-
число входящих и исходящих пакетов широковещательной рассылки (Bcst)
-
число входящих и исходящих пакетов многоадресной рассылки (Mcst)
-
число ошибок (Error)
-
число ошибок переполнения буфера (Overflow)
Примечание: При вычислении уровня загрузки порта данная команда объединяет строки Tx и Rx в один счетчик, а также определяет пропускную способность в дуплексном режиме при вычислении процента загруженности. Например, порт Gigabit Ethernet работает в дуплексном режиме с пропускной способностью 2000 Мбит/с.
Число ошибок (in Errors) представляет сумму всех пакетов с ошибками, полученных данным портом.
Переполнение буфера означает, что порт принимает больше трафика, чем может быть сохранено в его буфере. Это может быть вызвано пульсирующим трафиком, а также переполнением буферов. Предлагаемое действие — уменьшить скорость передачи исходного устройства.
Также см. значения счетчиков «In-Lost» и «Out-Lost» в выходных данных команды show mac .
Распространенные сообщения о системных ошибках
В Cisco IOS иногда используется различный формат для системных сообщений. Для сравнения можно проверить системные сообщения CatOS и Cisco IOS. Описание выпусков используемого программного обеспечения см. в руководстве Сообщения и процедуры восстановления. Например, можно прочитать документ Сообщения и процедуры восстановления для ПО CatOS версии 7.6 и сравнить его с содержимым документа Сообщения и процедуры восстановления для выпусков Cisco IOS 12.1 E.
Сообщения об ошибках в модулях WS-X6348
Просмотите следующие сообщения об ошибках.
-
Coil Pinnacle Header Checksum (контрольная сумма заголовка Coil/Pinnacle)
-
Ошибка состояния компьютера Coil Mdtif
-
Ошибка контрольной суммы пакета Coil Mdtif.
-
Ошибка «Coil Pb Rx Underflow»
-
Ошибка четности Coil Pb Rx
Можно проверить наличие в сообщениях системного журнала одной из описанных ниже ошибок.
%SYS-5-SYS_LCPERR5:Module 9: Coil Pinnacle Header Checksum Error - Port #37
При появлении этого типа сообщений или в случае сбоя группы портов 10/100 в модулях WS-X6348 см. в следующих документах дальнейшие советы по устранению неполадок в зависимости от используемой операционной системы.
%PAGP-5-PORTTO / FROMSTP и %ETHC-5-PORTTO / FROMSTP
В CatOS используйте команду show logging buffer для просмотра сохраненных сообщений журнала. Для Cisco IOS используйте команду show logging .
Протокол PAgP выполняет согласование каналов EtherChannel между коммутаторами. Если устройство присоединяется или покидает порт моста, на консоли отображается информационное сообщение. В большинстве случае появление этого сообщение совершенно нормально, однако при появлении таких сообщений на портах, которые по каким-то причинам не участвуют в переброске, требуется дополнительное изучение. Для изучения консольных сообщений всегда можно обратиться в IT-аутсорсинговую компанию, которая специализируется на обслуживании сетевого оборудования.
В программном обеспечении CatOS версии 7.x или выше «PAGP-5» изменено на «ETHC-5», чтобы сделать данное сообщение более понятным.
Это сообщение характерно для коммутаторов серии Catalyst 4000, 5000 и 6000 с ПО CatOS. Для коммутаторов с ПО Cisco IOS нет сообщений об ошибках, эквивалентных данному.
%SPANTREE-3-PORTDEL_FAILNOTFOUND
Это сообщение не указывает на проблему с коммутатором. Оно обычно возникает вместе с сообщениями %PAGP-5-PORTFROMSTP.
Протокол PAgP выполняет согласование каналов EtherChannel между коммутаторами. Если устройство присоединяется или покидает порт моста, на консоли отображается информационное сообщение. В большинстве случае появление этого сообщение совершенно нормально и не требует, каких-либо действий вроде аудита IT-инфраструктуры, однако при появлении таких сообщений на портах, которые по каким-то причинам не участвуют в переброске, требуется дополнительное изучение.
Это сообщение характерно для коммутаторов серии Catalyst 4000, 5000 и 6000 с ПО CatOS. Для коммутаторов с ПО Cisco IOS нет сообщений об ошибках, эквивалентных данному.
%SYS-4-PORT_GBICBADEEPROM: / %SYS-4-PORT_GBICNOTSUPP
Наиболее распространенная причина появления этого сообщения заключается в установке несертифицированного стороннего (не Cisco) конвертера GBIC в модуль Gigabit Ethernet. У такого конвертера GBIC нет памяти Cisco SEEPROM, что приводит к созданию сообщения об ошибке.
GBIC-модули WS-G5484, WS-G5486 и WS-G5487, используемые с WS-X6408-GBIC, также могут вызвать появление таких сообщений об ошибках, однако реальных проблем с данными платами и GBIC-модулями нет, а для программного обеспечения есть обновленное исправление.
Команда отклонена: [интерфейс] не является коммутационным портом
В коммутаторах, поддерживающих и интерфейсы L3, и коммутационные порты L2, сообщение Команда отклонена: [интерфейс] не является коммутационным портом отображается при попытке ввода команды, относящейся к уровню2, для порта, который настроен в качестве интерфейса уровня 3.
Чтобы преобразовать данный интерфейс из режима уровня 3 в режим уровня 2, выполните команду настройки интерфейса switchport. После применения этой команды настройте для данного порта требуемые свойства уровня 2.
Часть 4
RX (recive) — принимать пакеты приходящие от клиента
TX (transmit) передавать— пакеты приходящие к клиенту
Типы ошибок:
CRC Error — ошибки проверки контрольной суммы
Undersize — возникают при получение фрейма размером 61-64 байта.
Фрейм передается дальше, на работу не влияет
Oversize — возникают при получении пакета размером более 1518 байт и правильной контрольной суммой
Jabber — возникает при получении пакета размером более 1518 байт и имеющего ошибки в контрольной сумме
Drop Pkts — пакеты отброшенные в одном из трех случаев:
Какие пакеты входят в Drop Packets при выводе show error ports?
Переполнение входного буфера на порту
Пакеты, отброшенные ACL
Проверка по VLAN на входе
Fragment — количество принятых кадров длиной менее 64 байт (без преамбулы и начального ограничителя кадра, но включая байты FCS — контрольной суммы) и содержащих ошибки FCS или ошибки выравнивания.
Excessive Deferral — количество пакетов, первая попытка отправки которых была отложена по причине занятости среды передачи.
Collision — возникают, когда две станции одновременно пытаются передать кадр данных по общей сред
Late Collision — возникают, если коллизия была обнаружена после передачи первых 64 байт пакета
Excessive Collision — возникают, если после возникновения коллизии последующие 16 попыток передачи пакета окончались неудачей. данный пакет больше не передается
Single Collision — единичная коллизия
The counter is increasing because your frames are being corrupted.
CRC is a polynomial function on the frame which returns a 4B number in Ethernet. It will catch all single bit errors and a good percentage of double bit errors. It is thus meant to ensure that the frame was not corrupted in transit. If your CRC error counter is increasing it means that when your hardware ran the polynomial function on the frame, the result was a 4B number which differed from the 4B number found on the frame itself.
Ethernet frame CRC (FCS) is usually understood to be on OSI layer 2, many people claim it is layer 1 on Ethernet, but that is incorrect (only preamble, SFD and IFG are layer 1 on Ethernet).
I recommend a book called Computer Networks — A systems approach on this and many other subjects. It discusses CRC in-depth around page 92 through 102.
As Daniel pointed out, frames can get corrupted due to several reasons such as: duplex mismatch, faulty cabling and broken hardware. However, some level of CRC errors should be expected and the standard allows up-to 10-12 bit-error-rate on Ethernet (1 bit out of 1012 can flip) and it’s acceptable according to the standard.
In copper the signal travels by transferring state between electrons (electrons themselves are not traveling very much) and in fiber the signal travels by the photons reflecting off the walls of the fiber. There is a non-zero chance that the photon will simply change due to heat on the walls or the state of the electrons will flip itself. So even in perfect situations some errors will always happen. It should be known that a bit is not a single photon or single state change of an electron; today you need many photons or electron state changes to express a single bit, so a single incorrect ‘state’ will not yield an error as a bit is the average state of many of these.
Introduction
This document describes details surrounding Cyclic Redundancy Check (CRC) errors observed on interface counters and statistics of Cisco Nexus switches.
Prerequisites
Requirements
Cisco recommends that you understand the basics of Ethernet switching and the Cisco NX-OS Command Line Interface (CLI). For more information, refer to one of these applicable documents:
- Cisco Nexus 9000 NX-OS Fundamentals Configuration Guide, Release 10.2(x)
- Cisco Nexus 9000 Series NX-OS Fundamentals Configuration Guide, Release 9.3(x)
- Cisco Nexus 9000 Series NX-OS Fundamentals Configuration Guide, Release 9.2(x)
- Cisco Nexus 9000 Series NX-OS Fundamentals Configuration Guide, Release 7.x
- Troubleshooting Ethernet
Components Used
The information in this document is based on these software and hardware versions:
- Nexus 9000 series switches starting from NX-OS software release 9.3(8)
- Nexus 3000 series switches starting from NX-OS software release 9.3(8)
The information in this document was created from devices in a specific lab environment. All of the devices used in this document started with a cleared (default) configuration. If your network is live, ensure that you understand the potential impact of any command.
The information in this document was created from the devices in a specific lab environment. All of the devices used in this document started with a cleared (default) configuration. If your network is live, ensure that you understand the potential impact of any command.
Background Information
This document describes details surrounding Cyclic Redundancy Check (CRC) errors observed on interface counters on Cisco Nexus series switches. This document describes what a CRC is, how it is used in the Frame Check Sequence (FCS) field of Ethernet frames, how CRC errors manifest on Nexus switches, how CRC errors interact in Store-and-Forward switching and Cut-Through switching scenarios, the most likely root causes of CRC errors, and how to troubleshoot and resolve CRC errors.
Applicable Hardware
The information in this document is applicable to all Cisco Nexus Series switches. Some of the information in this document can also be applicable to other Cisco routing and switching platforms, such as Cisco Catalyst routers and switches.
CRC Definition
A CRC is an error detection mechanism commonly used in computer and storage networks to identify data changed or corrupted during transmission. When a device connected to the network needs to transmit data, the device runs a computation algorithm based on cyclic codes against the data that results in a fixed-length number. This fixed-length number is called the CRC value, but colloquially, it is often called the CRC for short. This CRC value is appended to the data and transmitted through the network towards another device. This remote device runs the same cyclic code algorithm against the data and compares the resulting value with the CRC appended to the data. If both values match, then the remote device assumes the data was transmitted across the network without being corrupted. If the values do not match, then the remote device assumes the data was corrupted during transmission across the network. This corrupted data cannot be trusted and is discarded.
CRCs are used for error detection across multiple computer networking technologies, such as Ethernet (both wired and wireless variants), Token Ring, Asynchronous Transfer Mode (ATM), and Frame Relay. Ethernet frames have a 32-bit Frame Check Sequence (FCS) field at the end of the frame (immediately after the payload of the frame) where a 32-bit CRC value is inserted.
For example, consider a scenario where two hosts named Host-A and Host-B are directly connected to each other through their Network Interface Cards (NICs). Host-A needs to send the sentence “This is an example” to Host-B over the network. Host-A crafts an Ethernet frame destined to Host-B with a payload of “This is an example” and calculates that the CRC value of the frame is a hexadecimal value of 0xABCD. Host-A inserts the CRC value of 0xABCD into the FCS field of the Ethernet frame, then transmits the Ethernet frame out of Host-A’s NIC towards Host-B.
When Host-B receives this frame, it will calculate the CRC value of the frame with the use of the exact same algorithm as Host-A. Host-B calculates that the CRC value of the frame is a hexadecimal value of 0xABCD, which indicates to Host-B that the Ethernet frame was not corrupted while the frame was transmitted to Host-B.
CRC Error Definition
A CRC error occurs when a device (either a network device or a host connected to the network) receives an Ethernet frame with a CRC value in the FCS field of the frame that does not match the CRC value calculated by the device for the frame.
This concept is best demonstrated through an example. Consider a scenario where two hosts named Host-A and Host-B are directly connected to each other through their Network Interface Cards (NICs). Host-A needs to send the sentence “This is an example” to Host-B over the network. Host-A crafts an Ethernet frame destined to Host-B with a payload of “This is an example” and calculates that the CRC value of the frame is the hexadecimal value 0xABCD. Host-A inserts the CRC value of 0xABCD into the FCS field of the Ethernet frame, then transmits the Ethernet frame out of Host-A’s NIC towards Host-B.
However, damage on the physical media connecting Host-A to Host-B corrupts the contents of the frame such that the sentence within the frame changes to “This was an example” instead of the desired payload of “This is an example”.
When Host-B receives this frame, it will calculate the CRC value of the frame including the corrupted payload. Host-B calculates that the CRC value of the frame is a hexadecimal value of 0xDEAD, which is different from the 0xABCD CRC value within the FCS field of the Ethernet frame. This difference in CRC values tells Host-B that the Ethernet frame was corrupted while the frame was transmitted to Host-B. As a result, Host-B cannot trust the contents of this Ethernet frame, so it will drop it. Host-B will usually increment some sort of error counter on its Network Interface Card (NIC) as well, such as the “input errors”, “CRC errors”, or “RX errors” counters.
Common Symptoms of CRC Errors
CRC errors typically manifest themselves in one of two ways:
- Incrementing or non-zero error counters on interfaces of network-connected devices.
- Packet/Frame loss for traffic traversing the network due to network-connected devices dropping corrupted frames.
These errors manifest themselves in slightly different ways depending on the device you are working with. These sub-sections go into detail for each type of device.
Received Errors on Windows Hosts
CRC errors on Windows hosts typically manifest as a non-zero Received Errors counter displayed in the output of the netstat -e command from the Command Prompt. An example of a non-zero Received Errors counter from the Command Prompt of a Windows host is here:
>netstat -e
Interface StatisticsReceived Sent
Bytes 1116139893 3374201234
Unicast packets 101276400 49751195
Non-unicast packets 0 0
Discards 0 0
Errors 47294 0
Unknown protocols 0
The NIC and its respective driver must support accounting of CRC errors received by the NIC in order for the number of Received Errors reported by the netstat -e command to be accurate. Most modern NICs and their respective drivers support accurate accounting of CRC errors received by the NIC.
RX Errors on Linux Hosts
CRC errors on Linux hosts typically manifest as a non-zero “RX errors” counter displayed in the output of the ifconfig command. An example of a non-zero RX errors counter from a Linux host is here:
$ ifconfig eth0
eth0: flags=4163<UP,BROADCAST,RUNNING,MULTICAST>  mtu 1500
        inet 192.0.2.10  netmask 255.255.255.128  broadcast 192.0.2.255
        inet6 fe80::10  prefixlen 64  scopeid 0x20<link>
        ether 08:62:66:be:48:9b  txqueuelen 1000  (Ethernet)
        RX packets 591511682  bytes 214790684016 (200.0 GiB)
        RX errors 478920  dropped 0  overruns 0  frame 0
        TX packets 85495109  bytes 288004112030 (268.2 GiB)
        TX errors 0  dropped 0 overruns 0  carrier 0  collisions 0
CRC errors on Linux hosts can also manifest as a non-zero “RX errors” counter displayed in the output of ip -s link show command. An example of a non-zero RX errors counter from a Linux host is here:
$ ip -s link show eth0
2: eth0: <BROADCAST,MULTICAST,UP,LOWER_UP> mtu 1500 qdisc mq state UP mode DEFAULT group default qlen 1000
    link/ether 08:62:66:84:8f:6d brd ff:ff:ff:ff:ff:ff
    RX: bytes  packets  errors  dropped overrun mcast
    32246366102 444908978 478920       647     0       419445867
    TX: bytes  packets  errors  dropped carrier collsns
    3352693923 30185715 0       0       0       0
    altname enp11s0
The NIC and its respective driver must support accounting of CRC errors received by the NIC in order for the number of RX Errors reported by the ifconfig or ip -s link show commands to be accurate. Most modern NICs and their respective drivers support accurate accounting of CRC errors received by the NIC.
CRC Errors on Network Devices
Network devices operate in one of two forwarding modes — Store-and-Forward forwarding mode, and Cut-Through forwarding mode. The way a network device handles a received CRC error differs depending on its forwarding modes. The subsections here will describe the specific behavior for each forwarding mode.
Input Errors on Store-and-Forward Network Devices
When a network device operating in a Store-and-Forward forwarding mode receives a frame, the network device will buffer the entire frame (“Store”) before you validate the frame’s CRC value, make a forwarding decision on the frame, and transmit the frame out of an interface (“Forward”). Therefore, when a network device operating in a Store-and-Forward forwarding mode receives a corrupted frame with an incorrect CRC value on a specific interface, it will drop the frame and increment the “Input Errors” counter on the interface.
In other words, corrupt Ethernet frames are not forwarded by network devices operating in a Store-and-Forward forwarding mode; they are dropped on ingress.
Cisco Nexus 7000 and 7700 Series switches operate in a Store-and-Forward forwarding mode. An example of a non-zero Input Errors counter and a non-zero CRC/FCS counter from a Nexus 7000 or 7700 Series switch is here:
switch# show interface
<snip>
Ethernet1/1 is up
  RX
    241052345 unicast packets  5236252 multicast packets  5 broadcast packets
    245794858 input packets  17901276787 bytes
    0 jumbo packets  0 storm suppression packets
    0 runts  0 giants  579204 CRC/FCS  0 no buffer
    579204 input error  0 short frame  0 overrun   0 underrun  0 ignored
    0 watchdog  0 bad etype drop  0 bad proto drop  0 if down drop
    0 input with dribble  0 input discard
    0 Rx pause
CRC errors can also manifest themselves as a non-zero “FCS-Err” counter in the output of show interface counters errors. The «Rcv-Err» counter in the output of this command will also have a non-zero value, which is the sum of all input errors (CRC or otherwise) received by the interface. An example of this is shown here:
switch# show interface counters errors
<snip>
--------------------------------------------------------------------------------
Port          Align-Err    FCS-Err   Xmit-Err    Rcv-Err  UnderSize OutDiscards
--------------------------------------------------------------------------------
Eth1/1                0     579204          0     579204          0           0
Input and Output Errors on Cut-Through Network Devices
When a network device operating in a Cut-Through forwarding mode starts to receive a frame, the network device will make a forwarding decision on the frame’s header and begin transmitting the frame out of an interface as soon as it receives enough of the frame to make a valid forwarding decision. As frame and packet headers are at the beginning of the frame, this forwarding decision is usually made before the payload of the frame is received.
The FCS field of an Ethernet frame is at the end of the frame, immediately after the frame’s payload. Therefore, a network device operating in a Cut-Through forwarding mode will already have started transmitting the frame out of another interface by the time it can calculate the CRC of the frame. If the CRC calculated by the network device for the frame does not match the CRC value present in the FCS field, that means the network device forwarded a corrupted frame into the network. When this happens, the network device will increment two counters:
- The “Input Errors” counter on the interface where the corrupted frame was originally received.
- The “Output Errors” counter on all interfaces where the corrupted frame was transmitted. For unicast traffic, this will typically be a single interface – however, for broadcast, multicast, or unknown unicast traffic, this could be one or more interfaces.
An example of this is shown here, where the output of the show interface command indicates multiple corrupted frames were received on Ethernet1/1 of the network device and transmitted out of Ethernet1/2 due to the Cut-Through forwarding mode of the network device:
switch# show interface
<snip>
Ethernet1/1 is up
RX
46739903 unicast packets 29596632 multicast packets 0 broadcast packets
76336535 input packets 6743810714 bytes
15 jumbo packets 0 storm suppression bytes
0 runts 0 giants 47294 CRC 0 no buffer
47294 input error 0 short frame 0 overrun 0 underrun 0 ignored
0 watchdog 0 bad etype drop 0 bad proto drop 0 if down drop
0 input with dribble 0 input discard
0 Rx pauseEthernet1/2 is up
TX
46091721 unicast packets 2852390 multicast packets 102619 broadcast packets
49046730 output packets 3859955290 bytes
50230 jumbo packets
47294 output error 0 collision 0 deferred 0 late collision
0 lost carrier 0 no carrier 0 babble 0 output discard
0 Tx pause
CRC errors can also manifest themselves as a non-zero “FCS-Err” counter on the ingress interface and non-zero «Xmit-Err» counters on egress interfaces in the output of show interface counters errors. The «Rcv-Err» counter on the ingress interface in the output of this command will also have a non-zero value, which is the sum of all input errors (CRC or otherwise) received by the interface. An example of this is shown here:
switch# show interface counters errors
<snip>
--------------------------------------------------------------------------------
Port          Align-Err    FCS-Err   Xmit-Err    Rcv-Err  UnderSize OutDiscards
--------------------------------------------------------------------------------
Eth1/1                0      47294          0      47294          0           0
Eth1/2                0          0      47294          0          0           0
The network device will also modify the CRC value in the frame’s FCS field in a specific manner that signifies to upstream network devices that this frame is corrupt. This behavior is known as “stomping” the CRC. The precise manner in which the CRC is modified varies from one platform to another, but generally, it involves inverting the current CRC value present in the frame’s FCS field. An example of this is here:
Original CRC: 0xABCD (1010101111001101)
Stomped CRC:  0x5432 (0101010000110010)
As a result of this behavior, network devices operating in a Cut-Through forwarding mode can propagate a corrupt frame throughout a network. If a network consists of multiple network devices operating in a Cut-Through forwarding mode, a single corrupt frame can cause input error and output error counters to increment on multiple network devices within your network.
Trace and Isolate CRC Errors
The first step in order to identify and resolve the root cause of CRC errors is isolating the source of the CRC errors to a specific link between two devices within your network. One device connected to this link will have an interface output errors counter with a value of zero or is not incrementing, while the other device connected to this link will have a non-zero or incrementing interface input errors counter. This suggests that traffic egresses the interface of one device intact is corrupted at the time of the transmission to the remote device, and is counted as an input error by the ingress interface of the other device on the link.
Identifying this link in a network consisting of network devices operating in a Store-and-Forward forwarding mode is a straightforward task. However, identifying this link in a network consisting of network devices operating in a Cut-Through forwarding mode is more difficult, as many network devices will have non-zero input and output error counters. An example of this phenomenon can be seen in the topology here, where the link highlighted in red is damaged such that traffic traversing the link is corrupted. Interfaces labeled with a red «I» indicate interfaces that could have non-zero input errors, while interfaces labeled with a blue «O» indicate interfaces that could have non-zero output errors.
Identifying the faulty link requires you to recursively trace the «path» corrupted frames follow in the network through non-zero input and output error counters, with non-zero input errors pointing upstream towards the damaged link in the network. This is demonstrated in the diagram here.
A detailed process for tracing and identifying a damaged link is best demonstrated through an example. Consider the topology here:
In this topology, interface Ethernet1/1 of a Nexus switch named Switch-1 is connected to a host named Host-1 through Host-1’s Network Interface Card (NIC) eth0. Interface Ethernet1/2 of Switch-1 is connected to a second Nexus switch, named Switch-2, through Switch-2’s interface Ethernet1/2. Interface Ethernet1/1 of Switch-2 is connected to a host named Host-2 through Host-2’s NIC eth0.
The link between Host-1 and Switch-1 through Switch-1’s Ethernet1/1 interface is damaged, causing traffic that traverses the link to be intermittently corrupted. However, we do not yet know that this link is damaged. We must trace the path the corrupted frames leave in the network through non-zero or incrementing input and output error counters to locate the damaged link in this network.
In this example, Host-2’s NIC reports that it is receiving CRC errors.
Host-2$ ip -s link show eth0
2: eth0: <BROADCAST,MULTICAST,UP,LOWER_UP> mtu 1500 qdisc mq state UP mode DEFAULT group default qlen 1000
    link/ether 00:50:56:84:8f:6d brd ff:ff:ff:ff:ff:ff
    RX: bytes  packets  errors  dropped overrun mcast
    32246366102 444908978 478920       647     0       419445867
    TX: bytes  packets  errors  dropped carrier collsns
    3352693923 30185715 0       0       0       0
    altname enp11s0
You know that Host-2’s NIC connects to Switch-2 via interface Ethernet1/1. You can confirm that interface Ethernet1/1 has a non-zero output errors counter with the show interface command.
Switch-2# show interface
<snip>
Ethernet1/1 is up
admin state is up, Dedicated Interface
    RX
      30184570 unicast packets  872 multicast packets  273 broadcast packets
      30185715 input packets  3352693923 bytes
      0 jumbo packets  0 storm suppression bytes
      0 runts  0 giants 0 CRC  0 no buffer
      0 input error  0 short frame  0 overrun   0 underrun  0 ignored
      0 watchdog  0 bad etype drop  0 bad proto drop  0 if down drop
      0 input with dribble  0 input discard
      0 Rx pause
    TX
      444907944 unicast packets  932 multicast packets  102 broadcast packets
      444908978 output packets  32246366102 bytes
      0 jumbo packets
      478920 output error  0 collision  0 deferred  0 late collision
      0 lost carrier  0 no carrier  0 babble  0 output discard
      0 Tx pause
Since the output errors counter of interface Ethernet1/1 is non-zero, there is most likely another interface of Switch-2 that has a non-zero input errors counter. You can use the show interface counters errors non-zero command in order to identify if any interfaces of Switch-2 have a non-zero input errors counter.
Switch-2# show interface counters errors non-zero
<snip>
--------------------------------------------------------------------------------
Port          Align-Err    FCS-Err   Xmit-Err    Rcv-Err  UnderSize OutDiscards
--------------------------------------------------------------------------------
Eth1/1                0          0     478920          0          0           0
Eth1/2                0     478920          0     478920          0           0

--------------------------------------------------------------------------------
Port         Single-Col  Multi-Col   Late-Col  Exces-Col  Carri-Sen       Runts
--------------------------------------------------------------------------------

--------------------------------------------------------------------------------
Port          Giants SQETest-Err Deferred-Tx IntMacTx-Er IntMacRx-Er Symbol-Err
--------------------------------------------------------------------------------

--------------------------------------------------------------------------------
Port         InDiscards
--------------------------------------------------------------------------------
You can see that Ethernet1/2 of Switch-2 has a non-zero input errors counter. This suggests that Switch-2 receives corrupted traffic on this interface. You can confirm which device is connected to Ethernet1/2 of Switch-2 through the Cisco Discovery Protocol (CDP) or Link Local Discovery Protocol (LLDP) features. An example of this is shown here with the show cdp neighbors command.
Switch-2# show cdp neighbors
<snip>
    Capability Codes: R - Router, T - Trans-Bridge, B - Source-Route-Bridge
    S - Switch, H - Host, I - IGMP, r - Repeater,
    V - VoIP-Phone, D - Remotely-Managed-Device,
    s - Supports-STP-Dispute

Device-ID          Local Intrfce  Hldtme Capability  Platform      Port ID
Switch-1(FDO12345678)
                    Eth1/2         125    R S I s   N9K-C93180YC- Eth1/2
You now know that Switch-2 is receiving corrupted traffic on its Ethernet1/2 interface from Switch-1’s Ethernet1/2 interface, but you do not yet know whether the link between Switch-1’s Ethernet1/2 and Switch-2’s Ethernet1/2 is damaged and causes the corruption, or if Switch-1 is a cut-through switch forwarding corrupted traffic it receives. You must log into Switch-1 to verify this.
You can confirm Switch-1’s Ethernet1/2 interface has a non-zero output errors counter with the show interfaces command.
Switch-1# show interface
<snip>
Ethernet1/2 is up
admin state is up, Dedicated Interface
    RX
      30581666 unicast packets  178 multicast packets  931 broadcast packets
      30582775 input packets  3352693923 bytes
      0 jumbo packets  0 storm suppression bytes
      0 runts  0 giants 0 CRC  0 no buffer
      0 input error  0 short frame  0 overrun   0 underrun  0 ignored
      0 watchdog  0 bad etype drop  0 bad proto drop  0 if down drop
      0 input with dribble  0 input discard
      0 Rx pause
    TX
      454301132 unicast packets  734 multicast packets  72 broadcast packets
      454301938 output packets  32246366102 bytes
      0 jumbo packets
      478920 output error  0 collision  0 deferred  0 late collision
      0 lost carrier  0 no carrier  0 babble  0 output discard
      0 Tx pause
You can see that Ethernet1/2 of Switch-1 has a non-zero output errors counter. This suggests that the link between Switch-1’s Ethernet1/2 and Switch-2’s Ethernet1/2 is not damaged — instead, Switch-1 is a cut-through switch forwarding corrupted traffic it receives on some other interface. As previously demonstrated with Switch-2, you can use the show interface counters errors non-zero command in order to identify if any interfaces of Switch-1 have a non-zero input errors counter.
Switch-1# show interface counters errors non-zero
<snip>
--------------------------------------------------------------------------------
Port          Align-Err    FCS-Err   Xmit-Err    Rcv-Err  UnderSize OutDiscards
--------------------------------------------------------------------------------
Eth1/1                0     478920          0     478920          0           0
Eth1/2                0          0     478920          0          0           0

--------------------------------------------------------------------------------
Port         Single-Col  Multi-Col   Late-Col  Exces-Col  Carri-Sen       Runts
--------------------------------------------------------------------------------

--------------------------------------------------------------------------------
Port          Giants SQETest-Err Deferred-Tx IntMacTx-Er IntMacRx-Er Symbol-Err
--------------------------------------------------------------------------------

--------------------------------------------------------------------------------
Port         InDiscards
--------------------------------------------------------------------------------
You can see that Ethernet1/1 of Switch-1 has a non-zero input errors counter. This suggests that Switch-1 is receiving corrupted traffic on this interface. We know that this interface connects to Host-1’s eth0 NIC. We can review Host-1’s eth0 NIC interface statistics to confirm whether Host-1 sends corrupted frames out of this interface.
Host-1$ ip -s link show eth0
2: eth0: <BROADCAST,MULTICAST,UP,LOWER_UP> mtu 1500 qdisc mq state UP mode DEFAULT group default qlen 1000
    link/ether 00:50:56:84:8f:6d brd ff:ff:ff:ff:ff:ff
    RX: bytes  packets  errors  dropped overrun mcast
    73146816142 423112898 0       0     0       437368817
    TX: bytes  packets  errors  dropped carrier collsns
    3312398924 37942624 0       0       0       0
    altname enp11s0
The eth0 NIC statistics of Host-1 suggest the host is not transmitting corrupted traffic. This suggests that the link between Host-1’s eth0 and Switch-1’s Ethernet1/1 is damaged and is the source of this traffic corruption. Further troubleshooting will need to be performed on this link to identify the faulty component causing this corruption and replace it.
Root Causes of CRC Errors
The most common root cause of CRC errors is a damaged or malfunctioning component of a physical link between two devices. Examples include:
- Failing or damaged physical medium (copper or fiber) or Direct Attach Cables (DACs).
- Failing or damaged transceivers/optics.
- Failing or damaged patch panel ports.
- Faulty network device hardware (including specific ports, line card Application-Specific Integrated Circuits [ASICs], Media Access Controls [MACs], fabric modules, etc.),
- Malfunctioning network interface card inserted in a host.
It is also possible for one or more misconfigured devices to inadvertently causes CRC errors within a network. One example of this is a Maximum Transmission Unit (MTU) configuration mismatch between two or more devices within the network causing large packets to be incorrectly truncated. Identifying and resolving this configuration issue can correct CRC errors within a network as well.
Resolve CRC Errors
You can identify the specific malfunctioning component through a process of elimination:
- Replace the physical medium (either copper or fiber) or DAC with a known-good physical medium of the same type.
- Replace the transceiver inserted in one device’s interface with a known-good transceiver of the same model. If this does not resolve the CRC errors, replace the transceiver inserted in the other device’s interface with a known-good transceiver of the same model.
- If any patch panels are used as part of the damaged link, move the link to a known-good port on the patch panel. Alternatively, eliminate the patch panel as a potential root cause by connecting the link without using the patch panel if possible.
- Move the damaged link to a different, known-good port on each device. You will need to test multiple different ports to isolate a MAC, ASIC, or line card failure.
- If the damaged link involves a host, move the link to a different NIC on the host. Alternatively, connect the damaged link to a known-good host to isolate a failure of the host’s NIC.
If the malfunctioning component is a Cisco product (such as a Cisco network device or transceiver) that is covered by an active support contract, you can open a support case with Cisco TAC detailing your troubleshooting to have the malfunctioning component replaced through a Return Material Authorization (RMA).
Related Information
- Nexus 9000 Cloud Scale ASIC CRC Identification & Tracing Procedure
- Technical Support & Documentation — Cisco Systems
![]() Re: Ошибки на портах типа: input errors, CRC
Re: Ошибки на портах типа: input errors, CRC
Mr_skvish писал(а):
cable-diagnostics используем встроенный в Cisco. Да и отдельно lan-tester’ом прозванивали (ерунда конечно, но что есть). Линия в норме. Линию мерили от и до. Что касается кабеля, он точно не говеный)
Если бы вы флюком промеряли я бы не усомнился, а так ошибка в линии 99%. Я не сильно разбирался в этом тестере, но не думаю что встроенный в Cisco умеет мерять всякие наводки типа next/fext и т.д. Вдруг где кабель силовой рядом?
Может быть ошибка конкретного порта, но элементарно проверяется же, втыкаете в порт с ошибками CRC напрямую комп и смотрите есть ли ошибки, желательно прогнать чем нибудь типо iperf, иногда ошибки вылезают только на высоких скоростях ( но это скорее в случае линии). Если ошибок нет на конкретном порту, то точно ошибка в линии. Согласование портов проверили по скоростям и дуплексу?
Вот Cisco troubleshooting ethernet guide, в котором четко написано почему могут быть CRC ошибки.
http://www.cisco.com/en/US/docs/interne … r1904.html
Indicates that the cyclic redundancy checksum generated by the originating LAN station or far-end device does not match the checksum calculated from the data received. On a LAN, this usually indicates noise or transmission problems on the LAN interface or the LAN bus itself. A high number of CRCs is usually the result of collisions or a station transmitting bad data.
Так что другой причины быть не может, и почему такие ошибки возникают в официальном гайде четко описано, раз моим словам не верите. Так что не разделяю вашей уверенности в том, что с линией все ок, ошибку надо искать именно там.