Recently upgraded to Android Studio 4.2.1
I can launch my app successfully but when I try to attach the debugger I get the error in the question title (see screenshot below).
The app just gets stuck on the «Waiting For Debugger» screen.
Everything worked as expected prior to upgrade.
This is the output from the debug log
$ adb shell am start -n "com.*.*/com.*.*.MainActivity" -a android.intent.action.MAIN -c android.intent.category.LAUNCHER -D
Waiting for application to come online: com.*.* | com.*.*.test
Waiting for application to come online: com.*.* | com.*.*.test
Connected to process 9869 on device 'amazon-kfmuwi-G0W0X8089256FRU1'.
Capturing and displaying logcat messages from application. This behavior can be disabled in the "Logcat output" section of the "Debugger" settings page.
W/ActivityThread: Application com.*.* is waiting for the debugger on port 8100...
I/System.out: Sending WAIT chunk
Connecting to com.*.*
Now Launching Native Debug Session
com.intellij.execution.ExecutionFinishedException: Execution finished

Process finished with exit code 0
In logcat I also see
2021-05-19 12:55:32.855 10394-10394/? E/azon.kindle.cm: Not starting debugger since process cannot load the jdwp agent.
I have tried:
Restarting Android device
Restarting development device
Invalidating and Restarting Android Studio
Reinstalling Android Studio
My system is running Pop!_OS 20.10
Debug error
asked May 19, 2021 at 12:00
![]()
1
I’ve solved this by installing ‘libncurses5’ only
sudo apt install libncurses5
Thanks to Max Elkin
answered Jul 6, 2021 at 13:58
![]()
1
I eventually solved this by rolling back to Android Studio 4.1.
answered May 19, 2021 at 14:43
![]()
4
I rolled back AS from 4.2 to 4.1.3 which solved the error
answered May 24, 2021 at 13:18
![]()
In case the accepted answer doesn’t help, here’s how to find the root cause:
- Search for the
Debug log settingsaction (viaCTRL + SHIFT + A) - Set
#com.jetbrains.cidr.execution.debugger:tracein the dialog (source) - Try run or attach the debbuger
- Search for the
Collect Logs and Diagnostic Dataaction (viaCTRL + SHIFT + A) - Inspect the
idea.logfile inside the zip. It should show why the debugger fails.
For example, I saw this error brains.cidr.execution.debugger - LLDBFrontend: Fatal Python error: config_get_locale_encoding: failed to get the locale encoding: nl_langinfo(CODESET) failed
Which was fixed by setting this in ~/.zshrc (source)
export LC_ALL="en_US.UTF-8"
export LC_CTYPE="en_US.UTF-8"
answered Mar 31, 2022 at 11:19
![]()
AsaphaAsapha
6638 silver badges14 bronze badges
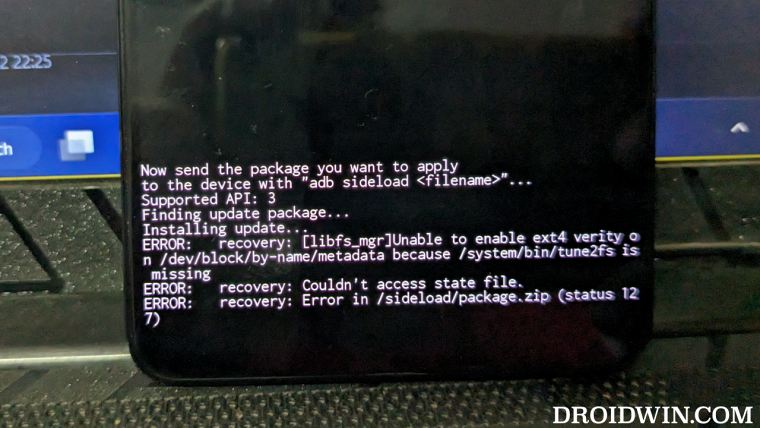
In this guide, we will show you the steps to fix Error 127 when sideloading ZIP in custom recovery. When it comes to rooting a custom ROM, then there are quite a lot of methods that you could opt for. Among them, sideloading the Magisk ZIP file via the AOSP Recovery that came with your ROM is the preferred one for many. This is because the entire process takes only a few seconds and moreover, there aren’t many additional tweaks to carry out as the AOSP Recovery comes preinstalled with the ROM itself.
However, there’s just one major issue with this- not every AOSP Recovery supports flashing the Magisk ZIP. Some of them will straightaway give out Error 127 when sideloading the Magisk ZIP in custom recovery. So if you are also currently getting bugged by this issue, then this guide will make you aware of a couple of nifty workarounds to rectify this error. Follow along.
Since you are unable to sideload Magisk, there are a couple of additional tweaks that you could opt for when it comes to rooting a custom ROM. If your device supports TWRP Recovery, then you could directly flash the Magisk ZIP/APK and obtain the root. However, if your device doesn’t have a working TWRP, then you could extract the payload.bin from the ROM > get the boot.img > Patch it via Magisk and flash it via the Fastboot command to get the root.
How to Root any Custom ROM via Magisk [Video]
To know more about any of these two methods to fix Error 127 when sideloading ZIP in custom recovery. you could refer to our above-linked guide and get started right away. Moreover, if you have any queries concerning the aforementioned steps, do let us know in the comments. We will get back to you with a solution at the earliest.
Video Guide
- How to Switch from OrangeFox to TWRP Recovery
- How to Switch from TWRP Recovery to OrangeFox
- Replace AOSP Recovery [Lineage/Pixel] with TWRP
- How to Replace TWRP with AOSP Recovery
About Chief Editor

Sadique Hassan
administrator
A technical geek by birth, he always has a keen interest in the Android platform right since the birth of the HTC Dream. The open-source environment always seems to intrigue him with the plethora of options available at his fingertips. “MBA by profession, blogger by choice!”
Comments
![]()
Godot version:
3.2.4-beta5 & 3.2.4-beta6
OS/device including version:
Zorin OS 15
Redmi note 9
Issue description:
Since 3.2.4-beta5 exporting to android doesn’t work.
I set up the new required sdk path on editor settings.
but wen I export to android I get this error

Godot complains about the sdk sometimes, seems to be random.
This is my editor setting config.

I tried with jdk 8 and 11 and the one in android studio with no avail.
In 3.2.4-beta4 exports perfectly fine.
Steps to reproduce:
Try to export to android
Minimal reproduction project:
Virtual Analog.zip
![]()
![]()
Still the same. I’ll try to reinstall Android Studio (since I have a somewhat old version).
EDIT: Nothing, did a fresh install of Android studio, same error.
![]()
Janders1800
changed the title
Android export broken; jarsigner error #127
Android export broken; apksigner error #127
Jan 21, 2021
![]()
OK, I’m retarded, forgot to generate a new keystore (the old one will not work). Feel free to close.
![]()
![]()
Maybe we should document that if apksigner adds new requirements on the debug keystone @m4gr3d.
The error about needing a valid Android SDK path when there’s one is also weird.
![]()
No need, the Android SDK error was a mistaken on my part. Since the log screen doesn’t get cleared wen you make a new export, that was the old error wen I didn’t had it configured.
Everything seems to work OK. Tho it would be nice to comment in the docs that old keystores will not work and you need to generate a new one, and also a more intuitive error message (couldn’t find any info on Google about ‘apksigner error 127’).
![]()
ADDING: lib/armeabi-v7a/libc++_shared.so
ADDING: res/mipmap-xhdpi-v4/icon.png
ADDING: res/layout/notification_template_media.xml
ADDING: res/drawable-hdpi-v4/notification_bg_low_pressed.9.png
ADDING: res/layout/notification_template_big_media_narrow.xml
ADDING: res/drawable-hdpi-v4/notification_bg_normal.9.png
ADDING: classes.dex
ADDING: lib/armeabi-v7a/libgodot_android.so
Exception in thread «main» java.lang.OutOfMemoryError
at sun.misc.Unsafe.allocateMemory(Native Method)
at java.nio.DirectByteBuffer.(DirectByteBuffer.java:127)
at java.nio.ByteBuffer.allocateDirect(ByteBuffer.java:311)
at com.android.apksig.internal.util.RandomAccessFileDataSource.feed(RandomAccessFileDataSource.java:106)
at com.android.apksig.internal.apk.ApkSigningBlockUtils$ChunkDigester.run(ApkSigningBlockUtils.java:637)
at com.android.apksig.util.RunnablesExecutor.lambda$static$0(RunnablesExecutor.java:20)
at com.android.apksig.internal.apk.ApkSigningBlockUtils.computeOneMbChunkContentDigests(ApkSigningBlockUtils.java:559)
at com.android.apksig.internal.apk.ApkSigningBlockUtils.computeContentDigests(ApkSigningBlockUtils.java:422)
at com.android.apksig.internal.apk.ApkSigningBlockUtils.computeContentDigests(ApkSigningBlockUtils.java:1035)
at com.android.apksig.internal.apk.v2.V2SchemeSigner.generateApkSignatureSchemeV2Block(V2SchemeSigner.java:152)
at com.android.apksig.DefaultApkSignerEngine.outputZipSectionsInternal(DefaultApkSignerEngine.java:786)
at com.android.apksig.DefaultApkSignerEngine.outputZipSections2(DefaultApkSignerEngine.java:752)
at com.android.apksig.ApkSigner.sign(ApkSigner.java:543)
at com.android.apksig.ApkSigner.sign(ApkSigner.java:193)
at com.android.apksigner.ApkSignerTool.sign(ApkSignerTool.java:340)
at com.android.apksigner.ApkSignerTool.main(ApkSignerTool.java:83)
![]()
‘apksigner’ returned with error #1
‘apksigner’ returned with error #1
‘apksigner’ returned with error #1
‘apksigner’ returned with error #1
![]()
Godot version:
3.2.4-beta6
OS/device including version:
win10
Issue description:
I don’t know why I tried almost everything, but I couldn’t solve this problem. I also regenerated the keystore
![]()
@cjmxp The error is Exception in thread "main" java.lang.OutOfMemoryError, it sounds like you are running out of RAM. How much RAM do you have on that system? Can you monitor its usage while exporting the APK to see if it reaches 100% and eventually fails?
![]()
@akien-mga 3.2.4-beta 4 can be exported. My memory is 16g to use 30%
![]()
Could you open a new issue for this OutOfMemoryError? It’s also related to the switch to apksigner but it’s unrelated to @Janders1800’s issue, so we should treat it separately.
![]()
The apksigner parameter should modify the memory size of the JVM
![]()
@akien-mga
Is it possible to reopen it ? because, I still have same issue on godot 3.3 RC8. (https://downloads.tuxfamily.org/godotengine/3.3/rc8/).
When I try to export for android, getting the error message below:
‘apksigner’ returned with error #127
but in 3.2.3 stable release, exports perfectly fine.
OS : Ubuntu 18.04
Build target : oculus quest 2 (Android)
![]()
![]()
![]()
![]()
![]()
![]()
@tqm-dev Can you enable verbose stdout in your project settings. That should provide more information about why the signing step is failing.
Also, can you try building your apk after enabling custom build and let us know if that succeeds.
![]()
@m4gr3d
I have got some messages on log window:
Starting signing of the APK binary using /home/tqm-dev/Android/sdk/build-tools/30.0.1/apksigner
Signing debug binary using:
/home/tqm-dev/Android/sdk/build-tools/30.0.1/apksigner sign —verbose —ks /home/tqm-dev/.android/debug.keystore —ks-pass pass:android —ks-key-alias androiddebugkey /home/tqm-dev/.cache/godot/tmpexport.apk
but I could not get additional error messages.
I think that Oculus quest need v2 scheme for signing but it is not v2 explicitly.
![]()
@tqm-dev Could you try to run the last command in a terminal window and see what happens (you may need to check that the tmpexport.apk file is still there first):
/home/tqm-dev/Android/sdk/build-tools/30.0.1/apksigner sign --verbose --ks /home/tqm-dev/.android/debug.keystore --ks-pass pass:android --ks-key-alias androiddebugkey /home/tqm-dev/.cache/godot/tmpexport.apk
![]()
@tqm-dev In addition can you enable custom build in your Android export settings and try building and signing your apk again.
![]()
@tqm-dev Could you try to run the last command in a terminal window and see what happens (you may need to check that the
tmpexport.apkfile is still there first):
/home/tqm-dev/Android/sdk/build-tools/30.0.1/apksigner sign --verbose --ks /home/tqm-dev/.android/debug.keystore --ks-pass pass:android --ks-key-alias androiddebugkey /home/tqm-dev/.cache/godot/tmpexport.apk
I got the error message below:
Error: A JNI error has occurred, please check your installation and try again
Exception in thread "main" java.lang.UnsupportedClassVersionError: JVMCFRE003 bad major version; class=com/android/apksigner/ApkSignerTool, offset=6
	at java.lang.ClassLoader.defineClassImpl(Native Method)
	at java.lang.ClassLoader.defineClassInternal(ClassLoader.java:398)
	at java.lang.ClassLoader.defineClass(ClassLoader.java:359)
	at java.security.SecureClassLoader.defineClass(SecureClassLoader.java:142)
	at java.net.URLClassLoader.defineClass(URLClassLoader.java:682)
	at java.net.URLClassLoader.access$400(URLClassLoader.java:89)
	at java.net.URLClassLoader$ClassFinder.run(URLClassLoader.java:1086)
	at java.security.AccessController.doPrivileged(AccessController.java:774)
	at java.net.URLClassLoader.findClass(URLClassLoader.java:589)
	at java.lang.ClassLoader.loadClassHelper(ClassLoader.java:953)
	at java.lang.ClassLoader.loadClass(ClassLoader.java:898)
	at sun.misc.Launcher$AppClassLoader.loadClass(Launcher.java:352)
	at java.lang.ClassLoader.loadClass(ClassLoader.java:881)
	at sun.launcher.LauncherHelper.checkAndLoadMain(LauncherHelper.java:601)
I seems that java would not be found but
$ java -version
works fine for me.
Then /home/tqm-dev/.cache/godot/tmpexport.apk does not exist because of the above error.
![]()
@tqm-dev In addition can you enable
custom buildin your Android export settings and try building and signing your apk again.
I am going to try but still struggling to set it up for custom build yet .
![]()
Once I switched java runtime OpenJ9 to HotSpot (both are OpenJDK 
is giving me the error:
Error: A JNI error has occurred, please check your installation and try again
Exception in thread "main" java.lang.UnsupportedClassVersionError: com/android/apksigner/ApkSignerTool has been compiled by a more recent version of the Java Runtime (class file version 53.0), this version of the Java Runtime only recognizes class file versions up to 52.0
Then I installed OpenJDK 11 HotSpot and tried again, the result is different than before:
Exception in thread "main" java.io.FileNotFoundException: /home/takuma/.cache/godot/tmpexport.apk (No such file or directory)
	at java.base/java.io.RandomAccessFile.open0(Native Method)
	at java.base/java.io.RandomAccessFile.open(RandomAccessFile.java:345)
	at java.base/java.io.RandomAccessFile.<init>(RandomAccessFile.java:259)
	at java.base/java.io.RandomAccessFile.<init>(RandomAccessFile.java:214)
	at com.android.apksig.ApkSigner.sign(ApkSigner.java:183)
	at com.android.apksigner.ApkSignerTool.sign(ApkSignerTool.java:344)
	at com.android.apksigner.ApkSignerTool.main(ApkSignerTool.java:84)
![]()
@m4gr3d
I tried signing my godot_quest_example.apk file with apksigner(OpenJDK 11 HotSpot) was succeeded by manually.
And installed apk by adb command, then launched my app using SideQuest or adb shell.
I think the reason why I failed signing is related for signing on godot, not apksigner problems that I thought about v2 scheme.
![]()
@tqm-dev Does it work if you delete ~/.cache/godot/tmpexport*?
![]()
@akien-mga
@tqm-dev Does it work if you delete
~/.cache/godot/tmpexport*?
It does not exist when I try to delete it.
tmpexport.apk.tmp, tmpexport-unaligned.apk only appeared at one click deploy, then immediately removed.
![]()
@akien-mga
I solved .
The way that solved the issue for me is that launch godot from command line with using OpenJDK 11.
also using OpenGL ES3 is fine for me.
I do not know the problem is only for my environment.
If it is not, the documentation should be maintained with more details for exporting to Oculus Quest 2.
Thank you.
![]()
I had the same problem with error #127 and no matter what I did it was still there.
Fixed it by downloading Godot from official website. The one that I had before was from Elementary OS App Center (I guess it is a flatpack) and reinstalling it did not help, but the version from the website works just fine
![]()
The one that I had before was from Elementary OS App Center (I guess it is a flatpack) and reinstalling it did not help, but the version from the website works just fine
Exporting to Android isn’t supported in Snap/Flatpak versions because of sandboxing limitations.
![]()
Ok, makes sense. But it’s pretty hard to understand it from the error message
![]()
Ok, makes sense. But it’s pretty hard to understand it from the error message
To improve this, we can prevent exporting to Android from the Flatpak/Snap versions, either by patching those versions downstream or by detecting the presence of a /.flatpak-info file and triggering an error in that case.
Edit: Pull request opened: flathub/org.godotengine.Godot#72
![]()
I just ran into this and want to throw my solution onto this discussion in case anyone else ends up here with the same problem as me.
My problem was that I never added openjdk’s bin folder to my PATH. This wasn’t an issue in earlier versions since we told godot where to find jarsigner, but the new version assumes it (or some other openjdk component) is in your PATH.
If you’re in the same situation I was, you can fix it by adding this line to your ~/.profile file and then rebooting:
PATH="WHEREVER_YOU_PUT_OPENJDK/openjdk8/bin:$PATH"
![]()
Also encountering this problem on Linux (Ubuntu 20.04 MATE), and found a quirk:
Oddly, if I launch godot manually from a terminal, the apksigner error doesn’t appear, and it exports normally.
If I launch godot from a desktop shortcut, then the apksigner error occurs.
Edit: this is a Linux PATH issue, but I wanted to mention because I had this problem when upgrading from 3.2 to 3.3 and it might help someone else wondering why they are getting this error. 
![]()
Have you tried the solution I posted above? It sounds like you might be
adding something to your PATH variable in either your terminal or .bashrc
file when you need to set it in .profile if you want stuff launched outside
the terminal to see it.
…
On Sun, May 9, 2021, 8:35 AM Dave Kerr ***@***.***> wrote:
Also encountering this problem on Linux (Ubuntu 20.04 MATE), and seem to
have a solution:
Oddly, if I launch godot manually from a terminal, the apksigner error
doesn’t appear, and it exports normally.
If I launch godot from a desktop shortcut, then the apksigner error occurs.
—
You are receiving this because you commented.
Reply to this email directly, view it on GitHub
<#45341 (comment)>,
or unsubscribe
<https://github.com/notifications/unsubscribe-auth/AD5NZWK45FZELO53WB24WSLTM2TSXANCNFSM4WL7QSVA>
.
![]()
I just ran into this and want to throw my solution onto this discussion in case anyone else ends up here with the same problem as me.
My problem was that I never added openjdk’s bin folder to my PATH. This wasn’t an issue in earlier versions since we told godot where to find jarsigner, but the new version assumes it (or some other openjdk component) is in your PATH.
If you’re in the same situation I was, you can fix it by adding this line to your ~/.profile file and then rebooting:
PATH="WHEREVER_YOU_PUT_OPENJDK/openjdk8/bin:$PATH"
I ended up adding openjdk path to .bashrc !
Adding the path to .profile works fine.
But, exporting to Oculus Quest 2, it does not work with OpenJDK8 but OpenJDK11 works fine.
![]()
OK, I’m retarded, forgot to generate a new keystore (the old one will not work). Feel free to close.
For me this solution didnt work. I unticked the ‘signed’ box under package section and export was successful …. bt that causes another apk running issue. certificate
![]()
I just ran into this and want to throw my solution onto this discussion in case anyone else ends up here with the same problem as me.
My problem was that I never added openjdk’s bin folder to my PATH. This wasn’t an issue in earlier versions since we told godot where to find jarsigner, but the new version assumes it (or some other openjdk component) is in your PATH.
If you’re in the same situation I was, you can fix it by adding this line to your ~/.profile file and then rebooting:
PATH="WHEREVER_YOU_PUT_OPENJDK/openjdk8/bin:$PATH"
Thank you very much the solution also worked pramin. But for some reason I had already added it to ~/.bashrc and ~/.zshrc, and just to export to android I got the signature error (#127). To be able to avoid this error I had to open it through the terminal.
OS: POP_OS 21.10
GODOT: v3.4.4.stable.official [419e713] (download from official site)
![]()
But for some reason I had already added it to ~/.bashrc and ~/.zshrc, and just to export to android I got the signature error (#127). To be able to avoid this error I had to open it through the terminal.
.bashrc and .zshrc are not read by your desktop environment when you log in. To have environment variables that work with your basic GUI session (when not starting applications from a terminal), you need to add them to the system-wide /etc/environment. This file needs to be edited as root, and it cannot expand environment variables. Therefore, paths must be written in their full, absolute form, instead of using variables such as $HOME.
![]()
Check $PATH and $JAVA_HOME, it solved the issue for me.
![]()
I was seeing the same issues as I also use .zshrc. Once I opened Godot through the terminal, it shows the little android icon in the top right and I can «install» it.
The problem for me is that the app never actually loads. It just shows the 3 dots forever.
Any ideas why that might be happening?
![]()
I was seeing the same issues as I also use
.zshrc. Once I opened Godot through the terminal, it shows the little android icon in the top right and I can «install» it.The problem for me is that the app never actually loads. It just shows the 3 dots forever.
Any ideas why that might be happening?
You could run «adb» in another terminal to try and see what’s happening. There might be a better way tho
Recently upgraded to Android Studio 4.2.1
I can launch my app successfully but when I try to attach the debugger I get the error in the question title (see screenshot below).
The app just gets stuck on the «Waiting For Debugger» screen.
Everything worked as expected prior to upgrade.
This is the output from the debug log
$ adb shell am start -n "com.*.*/com.*.*.MainActivity" -a android.intent.action.MAIN -c android.intent.category.LAUNCHER -D
Waiting for application to come online: com.*.* | com.*.*.test
Waiting for application to come online: com.*.* | com.*.*.test
Connected to process 9869 on device 'amazon-kfmuwi-G0W0X8089256FRU1'.
Capturing and displaying logcat messages from application. This behavior can be disabled in the "Logcat output" section of the "Debugger" settings page.
W/ActivityThread: Application com.*.* is waiting for the debugger on port 8100...
I/System.out: Sending WAIT chunk
Connecting to com.*.*
Now Launching Native Debug Session
com.intellij.execution.ExecutionFinishedException: Execution finished

Process finished with exit code 0
In logcat I also see
2021-05-19 12:55:32.855 10394-10394/? E/azon.kindle.cm: Not starting debugger since process cannot load the jdwp agent.
I have tried:
Restarting Android device
Restarting development device
Invalidating and Restarting Android Studio
Reinstalling Android Studio
My system is running Pop!_OS 20.10
Debug error
asked May 19, 2021 at 12:00
![]()
1
I’ve solved this by installing ‘libncurses5’ only
sudo apt install libncurses5
Thanks to Max Elkin
answered Jul 6, 2021 at 13:58
![]()
1
I eventually solved this by rolling back to Android Studio 4.1.
answered May 19, 2021 at 14:43
![]()
4
I rolled back AS from 4.2 to 4.1.3 which solved the error
answered May 24, 2021 at 13:18
![]()
In case the accepted answer doesn’t help, here’s how to find the root cause:
- Search for the
Debug log settingsaction (viaCTRL + SHIFT + A) - Set
#com.jetbrains.cidr.execution.debugger:tracein the dialog (source) - Try run or attach the debbuger
- Search for the
Collect Logs and Diagnostic Dataaction (viaCTRL + SHIFT + A) - Inspect the
idea.logfile inside the zip. It should show why the debugger fails.
For example, I saw this error brains.cidr.execution.debugger - LLDBFrontend: Fatal Python error: config_get_locale_encoding: failed to get the locale encoding: nl_langinfo(CODESET) failed
Which was fixed by setting this in ~/.zshrc (source)
export LC_ALL="en_US.UTF-8"
export LC_CTYPE="en_US.UTF-8"
answered Mar 31, 2022 at 11:19
![]()
AsaphaAsapha
6638 silver badges14 bronze badges
The debug log output and logcat both show the same issue. I have attempted to fix it by restarting my Android and development devices, invalidating and restarting Android Studio, and even reinstalling the latter. My system is running Pop!_OS 20.10. To solve the problem, I followed Solution 1, which involves installing the ‘libncurses5’ and ‘ia32-libs’ packages. This solution is listed on the Android developer’s official page. Additionally, to generate a token, I logged into my GitHub account, went to Settings > Developer Settings > Personal Access Tokens, clicked «Generate new token», added a note specifying that the token is for Android Studio, checked the boxes for repo, read:org, and gist, and clicked «Generate token». Finally, I copied the generated token and returned to Android Studio.
Table of contents
- Android Studio Debugger process finished with exit code 127
- Failed to login Github for Android Studio
- R system functions always returns error 127
- LoadLibrary() fails with Error code 127
Android Studio Debugger process finished with exit code 127
Question:
Just now, the version of
Android Studio
has been updated to 4.2.1.
My app launches without any issues, but attempting to attach the debugger results in an error as stated in the question title (refer to the screenshot provided).
The application is unable to proceed from the screen labeled »
waiting for debugger
«.
All operations functioned as intended before the upgrade.
The following is the result obtained from the debug log.
$ adb shell am start -n "com.*.*/com.*.*.MainActivity" -a android.intent.action.MAIN -c android.intent.category.LAUNCHER -D
Waiting for application to come online: com.*.* | com.*.*.test
Waiting for application to come online: com.*.* | com.*.*.test
Connected to process 9869 on device 'amazon-kfmuwi-G0W0X8089256FRU1'.
Capturing and displaying logcat messages from application. This behavior can be disabled in the "Logcat output" section of the "Debugger" settings page.
W/ActivityThread: Application com.*.* is waiting for the debugger on port 8100...
I/System.out: Sending WAIT chunk
Connecting to com.*.*
Now Launching Native Debug Session
com.intellij.execution.ExecutionFinishedException: Execution finished
Process finished with exit code 0
In logcat I also see
2021-05-19 12:55:32.855 10394-10394/? E/azon.kindle.cm: Not starting debugger since process cannot load the jdwp agent.
Various troubleshooting steps have been attempted, including restarting both the Android device and development device, invalidating and restarting Android Studio, and reinstalling Android Studio.
My system is running Pop!_OS 20.10
Debug error
Solution 1:
I’ve resolved the issue by installing the ‘ia32-libs’ package along with the ‘
libncurses5
‘ package.
The Android developer’s official page has a link to address a common problem. The issue pertains to native debugger crashes with the debugger process finishing with exit code 127. You can access the link here: https://developer.android.com/studio/known-issues?hl=de#native_debugger_crashes_with_debugger_process_finished_with_exit_code_127.
The problem is specific to Linux and caused by the use of a newer version of ‘libncurses6’ instead of the ‘libncurses5’ that android studio needs to run the debugger.
Solution 2:
The solution was to solely install ‘libncurses5’.
sudo apt install libncurses5
Thanks to Max Elkin
Solution 3:
The solution to the problem was found by reverting to Android Studio version 4.1.
Solution 4:
By downgrading AS to 4.1.3, the error was resolved.
Flicker problem when panels switched, Hi all, We depeloped Point-Of-Sale system (C# .NET 2.0) that, as many other POS systems, have different states and have to switch screens very …
Studio 127 — Official Trailer
Studio
127Starring: Tori ShultzPaige HooverXzavior CoxFilmed and Produced By: SpareTime FootageEdited By:Justin Jean Tom Angeletti Coming May 8th. At …
Transformers Studio Series B127 Cybertronian
Transformers
Studio
Series B-
127
Cybertronian Bumblebee ReviewBe sure to follow me on all social media to keep up to date with my latests posts and …
Studio Series Deluxe B-127: EmGo’s Transformers
Just the Transformation — https://
youtu
.be/R01p1AHHkdkStudio Series Playlist — https://
www
.youtube.
com
/playlist?list=PLszc8VRCv6OentakCkyjtYkxL_yCxUD1OGet …
Failed to login Github for Android Studio
Question:
Upon attempting to share my
Android Studio project
on Github, I encountered an issue where the share option did not function.
The URL for GitHub OAuth authorization code is http://127.0.0.1:63342/api/github/oauth/authorization_code, and the code to be used is 14c943d3435fe66a54f7.
Upon requesting for login credentials, I attempted to use my
github username and password
but was unsuccessful.
*Have only been programming for a couple of weeks
Solution 1:
Check out the thread
intellij android studio opens localhost page to login on github
for clarification, as this does not appear to be a
phishing attack
.
According to Intellij support, an Android Studio bug can be resolved by using a token as a workaround.
Creating the authentication key.
Access your GitHub account and go to Settings followed by Developer Settings, then locate the section labeled as
Personal Access Token
.
Click «Generate new token»
Include a reminder specifying that the token is intended for use with Android Studio. Afterwards, select the repo, read:org, and gist options.
Click «Generate token»
Take the
generated token
and go back to Android Studio.
Use Android Studio Token to Sign In
Go to GitHub settings by clicking on
Version Control
under File menu in Android Studio.
Click on the ‘+’ symbol and opt for «Log In using token».
Insert the token that was copied and select the option to «Add Account».
Solution 2:
If you have entered your GitHub access credentials into the apparent
ssl tunnel
, your GitHub account may have been compromised by a
Phishing Attack
. It is important to urgently log in on the web and change your account password. Afterwards, regenerate all
Personal Access Tokens
, replace all SSH keys, and check if any other changes have been made. Additionally, it is recommended to check your local PC for malware infection as this may be the root of the issue.
Consider the scenario where a rogue Gradle plugin modifies local configuration files, such as the one used in the GitHub login dialog, or installs an SSL tunnel as a backdoor. These backdoors can work in both directions. As a result, a person who is unaware of this may accidentally enter their access credentials and then become confused when things don’t work as expected. This often leads to the individual turning to the internet to express their frustration.
The IP address
140.82.121.4
is making headlines despite being in the year 2020.
To support my statement, I would like to refer you to the vulnerabilities in OAuth 2.0 authentication.
Solution 3:
There is a glitch in the current version 2020.3.1 of Android Studio, which has yet to be resolved.
The issue in question can be found on the bugtracker at https://issuetracker.google.com/issues/174787515.
One solution is to generate a token on Github and utilize it for logging in, as explained in their documentation on account and data security: https://docs.github.com/en/authentication/keeping-your-account-and-data-secure/creating-a-
personal-access-token
.
In order to grant access to the token, it is necessary to enable the read:org, repo, and gist scopes in your account permissions.
Solution 4:
I attempted to access my account utilizing my Github login credentials, but was unsuccessful.
It seems that the git version installed on your system is outdated. If it was current, a window with
username
and
personal access token
would appear.
Begin by updating your git to the latest version, then proceed to create a
personal access token
as demonstrated in
support for password authentication was removed
. Lastly, refer to
please use a personal access token instead
.
Failed to login Github for Android Studio, Generating the token. Log in to you GitHub account and navigate to Settings > Developer Settings > Personal Access Tokens. Click «Generate new …
R system functions always returns error 127
Question:
To achieve my goal, I must launch an external tool through
R
and handle any errors that may arise. I am aware of three similar functions that could potentially assist me in this process.
shell, system and system2.
Upon attempting to evaluate them, I notice the existence of that directive.
shell("notepad")
Accessing notepad through shell does not provide any means to examine errors, as there is no interface to review the
stderr
.
When I call
system("notepad")
or
system2("notepad")
R
encounters a freeze while attempting to execute those commands.
Calling
system("start notepad")
or
system2("start notepad")
returns warning
Warning message:
running command '"start notepad"' had status 127
Solution 1:
I’ll use @DavidTseng’s response as a reference (my apologies for not being able to upvote it due to my low reputation).
system("cmd.exe", input = "notepad")
worked for me in Windows.
Solution 2:
As previously stated, the R documentation discloses that when used in Windows, the
system()
function fails to initiate a detached shell (if required). Therefore, while command line commands work with
system()
, programs like Notepad that require a separate window fail to run.
According to the
system()
documentation:
The key contrast lies in the fact that on Unix-like systems, a shell is launched first and then the command is executed. Conversely, on Windows, the command runs directly without launching a shell. To use a shell as an interface that executes commands via a shell, the default Windows shell cmd.exe (which has several deviations from a POSIX shell) can be utilized.
Solution 3:
system("bash -l", input = "notepad")
Solution 4:
It is uncertain whether the option was available when the question was posted four years ago, but I have found that
\

\ \ \ \ system\("\"C:\path\to\exe\.exe\"\ args",\ intern\ =\ T\)\

\ \ \
effectively launches a distinct child window on Windows 10 with R 3.6 and RStudio.
The process did not run and returned a code of 127 when ‘intern = T’ was not utilized.
Get Pixel Studio from the Microsoft Store, Pixel Studio is a new pixel art editor for artists and game developers. Simple, fast and portable. No matter whether you are a beginner or a professional. Create …
LoadLibrary() fails with Error code 127
Question:
Hi,
We possess codes for a dll and an exe, which have been shifted from VC++6.0 to VC++ 2005.
It is essential to upgrade from VC++ 2005 to VC++ 2010 (VS 2010) in order to benefit from the advanced MFC libraries available in the latest version.
The codes were transformed to 2010 version. However, while attempting to upload the updated compiled dll to the new compiled exe, the LoadLibrary Function encountered an issue.
failed with
Error code 127
.
The same process is functional in VS 2008.
When
loadlibraryex
was called, the loaded option for the DLL was DONT_RESOLVE_DLL_REFERENCES. However, the attempt to call GetProcAddress was unsuccessful.
127.
Is there a requirement for us to configure something specific in order to ensure its functionality?
Thank you.
Regards,
Jignesh
Solution 1:
Jigs Patel wrote:
After converting both codes to 2010, attempting to load the newly compiled DLL into the corresponding EXE using the LoadLibrary function resulted in a failure with error code 127.
Your DLL relies on another DLL to export a specific function, but it is not present, resulting in an error. To identify the missing dependencies, you can use Dependency Walker (http://dependencywalker.com).
Igor Tandetnik
Solution 2:
Hi Jignesh,
Welcome to the MSDN Forum.
After researching on the issue for a while, I found that
error 127
indicates that there is an appropriate DLL found but a required procedure export is missing. To find more information about this issue, I would like to suggest you have a try on
Dependency Walker and
DUMPBIN.exe
. You can use Dependency Walker tool to scan the Visual C++ application to find out which DLL was not loaded. And
dumpbin.exe
can help you check whether there are symbols output
from your DLL.
In addition, C++ compiler generally change the
function names
in a DLL, and extern «C» can ensure the names not be changed. And if we want to export a function or class from a DLL, we should put «_declspec (dllexport)» before the name. Please take a look at
this line:
extern "C" _declspec(dllexport) int add(int a,int b);
I trust that my response has been informative. Should you have any inquiries, do not hesitate to inform us.
Sincerely,
Helen Zhao [MSFT]
MSDN Community Support | Feedback to us
Studio 127 — Official Trailer, Studio
127Starring: Tori ShultzPaige HooverXzavior CoxFilmed and Produced By: SpareTime FootageEdited By:Justin Jean Tom Angeletti Coming May 8th. At …