Время на прочтение
3 мин
Количество просмотров 6.8K

Вы используете Nginx? А как у вас организован мониторинг логов Nginx?
Знаете ли вы, что мониторя логи nginx, вы можете значительно повысить стабильность и надежность своего веб-приложения?
В этой статье я покажу вам, как организовать мониторинг логов Nginx, использовать их в качестве метрик и что вообще можно из них выжать.
Зачем мониторить логи Nginx?
Чтобы обеспечить доступность нашей системы — Система считается доступной при отсутствии сбоев или когда количество сбоев не превышает определенный порог. Анализируя статус-коды HTTP, мы можем определить допустимый процент сбоев и следить за доступностью нашей системы.

Для оценки показателей задержки — Доступность, конечно, очень важная метрика, но не менее важны и показатели задержки. Мы потеряем всех клиентов, если наша система будет слишком долго реагировать на их запросы.
Чтобы своевременно удалять устаревшие конечные точки — В идеале мы бы хотели сразу удалять устаревшие конечные точки. Но мы не можем просто взять и сделать это, так как некоторые из наших клиентов могут еще использовать их. Мы могли бы проанализировать использование интересующих нас конечных точек, просмотрев историю, и принимать решение об их удалении, опираясь на реальные данные.
Базовый рабочий процесс
Базовый рабочий процесс решения выглядит следующим образом.
-
Мы собираем метрики Nginx с помощью модуля filebeat [1].
-
Filebeat публикует собранные метрики в elasticsearch.
-
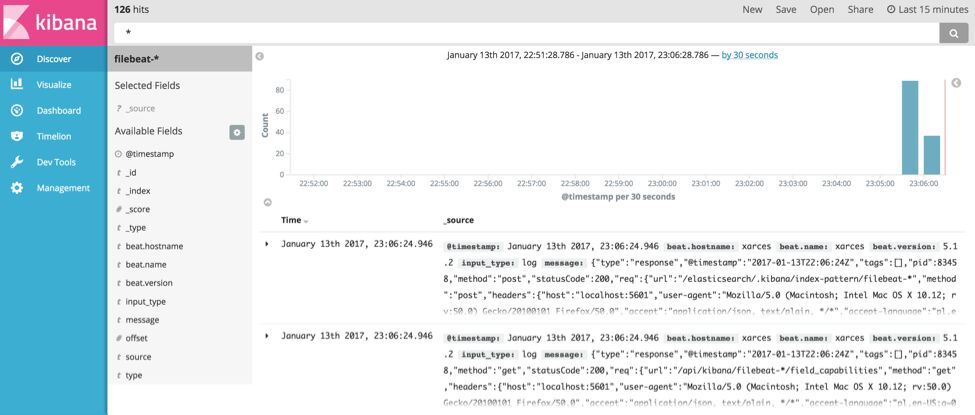
Мы можем визуализировать собранные метрики с помощью Kibana.
-
Мы можем информировать нашу команду с помощью наблюдателей (watchers) [2].

Реализация решения
Весь код можно найти здесь: monitor-nginx-logs
Сбор метрик Nginx
Мы собираем метрики Nginx, используя следующий код:
filebeat.modules:
- module: nginx
  access:
    var.paths: ["/var/log/nginx/host.access.log"]
Метрики публикуются в elasticsearch с помощью следующего кода:
output.elasticsearch:
  hosts: ["http://elasticsearch:9200"]
Вы можете просмотреть собранные метрики, используя Discover в Kibana по адресу localhost:5601. http.response.status_code — интересующая вас метрика.

Визуализация статус-кодов HTTP в Kibana
Выберите Visualize Library и создайте визуализацию


Выберите TSVB.

Сгруппируйте статус-коды HTTP, как показано на следующей диаграмме.

Сразу приношу свои извинения за слабую читабельность текста на изображении. Я попытался увеличить масштаб, но он все равно не читался. Поэтому я выпишу текст ниже:
Часть слева: http.response.status_code>= 200 and http.response.status_code<= 299

Часть справа: 200

По аналогии прописываем это для всех остальных статус-кодов
Наконец, мы можем посмотреть красивую инфографику со статус-кодами HTTP за все время.

Информирование команды о неудачных запросах
Информирование нашей команды мы можем реализовать с помощью специального API наблюдателя [3]. Наблюдатель будет регулярно извлекать данные через определенные промежутки времени и информировать нашу команду, если будет выполняться заданное нами условие. Своевременное получение уведомлений позволит нашей команде действовать наиболее эффективным образом.
Предположим, мы хотим запускать наблюдателя каждый час:
"trigger": {
  "schedule": {
    "interval": "1h"
  }
}
Так как мы храним метрики в индексе filebeat:
"indices": [
  "<filebeat-*-{now/d}>"
]
мы можем определить неудачные запросы, используя следующую конфигурацию:
{
 "size": 0,
 "query": {
  "bool": {
   "must": [
    {
     "range": {
      "@timestamp": {
       "gte": "now-1h"
      }
     }
    },
    {
     "exists": {
      "field": "http.response.status_code"
     }
    }
   ]
  }
 },
 "aggs": {
  "response_code_ranges": {
   "range": {
    "field": "http.response.status_code",
    "keyed": true,
    "ranges": [
     {
      "key": "server_errors",
      "from": 500,
      "to": 599
     }
    ]
   }
  }
 }
}
Следующее условие триггерит наш наблюдатель и сообщит нашей команде, когда процент неудачных запросов превысит 0,3%. Вы можете настроить этот порог в соответствии с вашими соображениями:
"condition": {
  "script": {
    "source": "(double) ctx.payload.aggregations.response_code_ranges.buckets.server_errors.doc_count/(double) ctx.payload.hits.total > params.threshold",
    "lang": "painless",
    "params": {
      "threshold": 0.003
    }
  }
}
Мы можем информировать команду через slack:
-- copied from https://www.elastic.co/guide/en/elasticsearch/reference/7.17/actions-slack.html

"actions" : {
  "notify-slack" : {
    "transform" : { ... },
    "throttle_period" : "5m",
    "slack" : {
      "message" : {
        "to" : [ "#admins", "@chief-admin" ],
        "text" : "..."
      }
    }
  }
}
Спасибо за внимание.
Ресурсы:
[1] filebeat-module-nginx.html
[2] watcher-ui.html
[3] watcher-api-put-watch.html
Материал подготовлен в преддверии старта курса «Observability: мониторинг, логирование, трейсинг». Ознакомиться подробнее с программой обучения и пройти вступительный тест для определения уровня знаний можно по ссылке.
Capture detailed information about errors and request processing in log files, either locally or via syslog.
This article describes how to configure logging of errors and processed requests in NGINX Open Source and NGINX Plus.
Setting Up the Error Log
NGINX writes information about encountered issues of different severity levels to the error log. The error_log directive sets up logging to a particular file, stderr, or syslog and specifies the minimal severity level of messages to log. By default, the error log is located at logs/error.log (the absolute path depends on the operating system and installation), and messages from all severity levels above the one specified are logged.
The configuration below changes the minimal severity level of error messages to log from error to warn:
error_log logs/error.log warn;
In this case, messages of warn, error crit, alert, and emerg levels are logged.
The default setting of the error log works globally. To override it, place the error_log directive in the main (top-level) configuration context. Settings in the main context are always inherited by other configuration levels (http, server, location). The error_log directive can be also specified at the http, stream, server and location levels and overrides the setting inherited from the higher levels. In case of an error, the message is written to only one error log, the one closest to the level where the error has occurred. However, if several error_log directives are specified on the same level, the message are written to all specified logs.
Note: The ability to specify multiple
error_logdirectives on the same configuration level was added in NGINX Open Source version 1.5.2.
Setting Up the Access Log
NGINX writes information about client requests in the access log right after the request is processed. By default, the access log is located at logs/access.log, and the information is written to the log in the predefined combined format. To override the default setting, use the log_format directive to change the format of logged messages, as well as the access_log directive to specify the location of the log and its format. The log format is defined using variables.
The following examples define the log format that extends the predefined combined format with the value indicating the ratio of gzip compression of the response. The format is then applied to a virtual server that enables compression.
http {
    log_format compression '$remote_addr - $remote_user [$time_local] '
                           '"$request" $status $body_bytes_sent '
                           '"$http_referer" "$http_user_agent" "$gzip_ratio"';

    server {
        gzip on;
        access_log /spool/logs/nginx-access.log compression;
        ...
    }
}
Another example of the log format enables tracking different time values between NGINX and an upstream server that may help to diagnose a problem if your website experience slowdowns. You can use the following variables to log the indicated time values:
$upstream_connect_time– The time spent on establishing a connection with an upstream server$upstream_header_time– The time between establishing a connection and receiving the first byte of the response header from the upstream server$upstream_response_time– The time between establishing a connection and receiving the last byte of the response body from the upstream server$request_time– The total time spent processing a request
All time values are measured in seconds with millisecond resolution.
http {
    log_format upstream_time '$remote_addr - $remote_user [$time_local] '
                             '"$request" $status $body_bytes_sent '
                             '"$http_referer" "$http_user_agent"'
                             'rt=$request_time uct="$upstream_connect_time" uht="$upstream_header_time" urt="$upstream_response_time"';

    server {
        access_log /spool/logs/nginx-access.log upstream_time;
        ...
    }
}
When reading the resulting time values, keep the following in mind:
- When a request is processed through several servers, the variable contains several values separated by commas
- When there is an internal redirect from one upstream group to another, the values are separated by semicolons
- When a request is unable to reach an upstream server or a full header cannot be received, the variable contains
0(zero) - In case of internal error while connecting to an upstream or when a reply is taken from the cache, the variable contains
-(hyphen)
Logging can be optimized by enabling the buffer for log messages and the cache of descriptors of frequently used log files whose names contain variables. To enable buffering use the buffer parameter of the access_log directive to specify the size of the buffer. The buffered messages are then written to the log file when the next log message does not fit into the buffer as well as in some other cases.
To enable caching of log file descriptors, use the open_log_file_cache directive.
Similar to the error_log directive, the access_log directive defined on a particular configuration level overrides the settings from the previous levels. When processing of a request is completed, the message is written to the log that is configured on the current level, or inherited from the previous levels. If one level defines multiple access logs, the message is written to all of them.
Enabling Conditional Logging
Conditional logging allows excluding trivial or unimportant log entries from the access log. In NGINX, conditional logging is enabled by the if parameter to the access_log directive.
This example excludes requests with HTTP status codes 2xx (Success) and 3xx (Redirection):
map $status $loggable {
    ~^[23]  0;
    default 1;
}

access_log /path/to/access.log combined if=$loggable;
Usecase: Sampling TLS Parameters
Many clients use TLS versions older than TLS 1.3. Though many ciphers are declared insecure, older implementations still use them; ECC certificates offer greater performance than RSA, but not all clients can accept ECC. Many TLS attacks rely on a “man in the middle” who intercepts the cipher negotiation handshake and forces the client and server to select a less secure cipher. Therefore, it’s important to configure NGINX Plus to not support weak or legacy ciphers, but doing so may exclude legacy clients.
You can evaluate the SSL data obtained from the client and determine what proportion of clients get excluded if support for older SSL protocols and ciphers is removed.
The following configuration example logs the SSL protocol, cipher, and User-Agent header of any connected TLS client, assuming that each client selects the most recent protocol and most secure ciphers it supports.
In this example, each client is identified by its unique combination of IP address and User-Agent.
-
Define the custom log format
sslparamsthat includes the version of the SSL protocol ($ssl_protocol), ciphers used in the connection ($ssl_cipher), the client IP address ($remote_addr), and the value of standardUser AgentHTTP request field ($http_user_agent):log_format sslparams '$ssl_protocol $ssl_cipher ' '$remote_addr "$http_user_agent"'; -
Define a key-value storage that will keep the IP address of the client and its User Agent, for example,
clients:keyval_zone zone=clients:80m timeout=3600s; -
Create a variable, for example,
$seenfor each unique combination of$remote_addrandUser-Agentheader:keyval $remote_addr:$http_user_agent $seen zone=clients; server { listen 443 ssl; ssl_protocols TLSv1 TLSv1.1 TLSv1.2; ssl_ciphers HIGH:!aNULL:!MD5; if ($seen = "") { set $seen 1; set $logme 1; } access_log /tmp/sslparams.log sslparams if=$logme; # ... } -
View the log file generated with this configuration:
TLSv1.2 AES128-SHA 1.1.1.1 "Mozilla/5.0 (X11; Linux x86_64; rv:45.0) Gecko/20100101 Firefox/45.0" TLSv1.2 ECDHE-RSA-AES128-GCM-SHA256 2.2.2.2 "Mozilla/5.0 (iPhone; CPU iPhone OS 9_1 like Mac OS X) AppleWebKit/601.1.46 (KHTML, like Gecko) Version/9.0 Mobile/13B143 Safari/601.1" TLSv1.2 ECDHE-RSA-AES128-GCM-SHA256 3.3.3.3 "Mozilla/5.0 (Windows NT 6.1; WOW64; rv:58.0) Gecko/20100101 Firefox/58.0" TLSv1.2 ECDHE-RSA-AES128-GCM-SHA256 4.4.4.4 "Mozilla/5.0 (Android 4.4.2; Tablet; rv:65.0) Gecko/65.0 Firefox/65.0" TLSv1 AES128-SHA 5.5.5.5 "Mozilla/5.0 (Android 4.4.2; Tablet; rv:65.0) Gecko/65.0 Firefox/65.0" TLSv1.2 ECDHE-RSA-CHACHA20-POLY1305 6.6.6.6 "Mozilla/5.0 (Linux; U; Android 5.0.2; en-US; XT1068 Build/LXB22.46-28) AppleWebKit/537.36 (KHTML, like Gecko) Version/4.0 Chrome/57.0.2987.108 UCBrowser/12.10.2.1164 Mobile Safari/537.36" -
Process the log file to determine the spread of data:
cat /tmp/sslparams.log | cut -d ' ' -f 2,2 | sort | uniq -c | sort -rn | perl -ane 'printf "%30s %s\n", $F[1], "="x$F[0];'In this output, low‑volume, less secure ciphers are identified:
ECDHE-RSA-AES128-GCM-SHA256 =========================
ECDHE-RSA-AES256-GCM-SHA384 ========
                 AES128-SHA ====
ECDHE-RSA-CHACHA20-POLY1305 ==
    ECDHE-RSA-AES256-SHA384 ==
Then you can check the logs to determine which clients are using these ciphers and then make a decision about removing these ciphers from the NGINX Plus configuration.
For more information about sampling requests with NGINX conditional logging see the blog post.
Logging to Syslog
The syslog utility is a standard for computer message logging and allows collecting log messages from different devices on a single syslog server. In NGINX, logging to syslog is configured with the syslog: prefix in error_log and access_log directives.
Syslog messages can be sent to a server= which can be a domain name, an IP address, or a UNIX-domain socket path. A domain name or IP address can be specified with a port to override the default port, 514. A UNIX-domain socket path can be specified after the unix: prefix:
error_log  syslog:server=unix:/var/log/nginx.sock debug;
access_log syslog:server=[2001:db8::1]:1234,facility=local7,tag=nginx,severity=info;
In the example, NGINX error log messages are written to a UNIX domain socket at the debug logging level, and the access log is written to a syslog server with an IPv6 address and port 1234.
The facility= parameter specifies the type of program that is logging the message. The default value is local7. Other possible values are: auth, authpriv, daemon, cron, ftp, lpr, kern, mail, news, syslog, user, uucp, local0 ... local7.
The tag= parameter applies a custom tag to syslog messages (nginx in our example).
The severity= parameter sets the severity level of syslog messages for access log. Possible values in order of increasing severity are: debug, info, notice, warn, error (default), crit, alert, and emerg. Messages are logged at the specified level and all more severe levels. In our example, the severity level error also enables crit, alert, and emerg levels to be logged.
Live Activity Monitoring
NGINX Plus provides a real-time live activity monitoring interface that shows key load and performance metrics of your HTTP and TCP upstream servers. See the Live Activity Monitoring article for more information.
To learn more about NGINX Plus, please visit the Products page.
Nginx – это широко используемый веб-сервер, который часто используется для обслуживания статического контента, обратного прокси или балансировки нагрузки веб-трафика. Он известен своей надежностью, гибкостью и высокой производительностью. Как и с любым сервером, важно контролировать Nginx, чтобы убедиться, что он функционирует должным образом, и решать любые проблемы, которые могут возникнуть. В этой статье мы рассмотрим, как мониторить Nginx с помощью Zabbix для обнаружения и устранения проблем с вашим сервером Nginx.
Подготовка
Прежде чем мы начнем изучать процесс мониторинга Nginx с помощью Zabbix, необходимо убедиться, что у нас есть все необходимое:
- Сервер с установленным Nginx, за которым вы хотите наблюдать
- Запущенный сервер Zabbix
- Установленный и настроенный агент Zabbix на сервере, на котором работает Nginx.
Настройка Nginx
Откройте файл /etc/nginx/conf.d/stub_status.conf любым удобным вам редактором и вставьте следующий текстовый блок:
server {

    listen 127.0.0.1:80;

    server_name 127.0.0.1;

    location /nginx_status {

        stub_status on;

        access_log off;

        allow 127.0.0.1;

        deny all;

        }

        location = /basic_status {

            stub_status;

            allow 127.0.0.1;

            allow ::1;

            deny all;

        }

}

Эти настройки позволят серверу генерировать базовую информацию о состоянии на странице /basic_status, доступной только с этого же сервера, чтобы наш агент мог получить ее.
Теперь давайте проверим, работает ли процесс Nginx с новыми настройками, выполнив следующие команды:
nginx -t

systemctl restart nginx

systemctl status nginx

Затем давайте проверим, работает ли новая страница состояния с помощью curl:

curl http://127.0.0.1/basic_status
Настройка логов
Вы должны проверить, генерирует ли Nginx необходимые для Zabbix логи, проверив настройки логирования в файле /etc/nginx/nginx.conf
 Теперь, чтобы Zabbix смог работать с логами, давайте закомментируем оригинальную строку access_log и вставим этот фрагмент:
error_log /var/log/nginx/error.log notice; access_log /var/log/nginx/access.log main; log_format main '$remote_addr - $remote_user [$time_local] "$request" ' '$status $body_bytes_sent "$http_referer" ' '"$http_user_agent" "$http_x_forwarded_for"';
Он должен выглядеть примерно так:  Проверьте и перезапустите Nginx еще раз, и приступим к настройке Zabbix.
Настройка Zabbix
Предполагая, что все предыдущие инструкции выполнены, вам теперь нужно только создать хост для этого сервера и добавить к нему Nginx с помощью шаблона Zabbix agent, или добавить его к уже существующему. Назначьте шаблон хосту с установленным Nginx, перейдя в Configuration → Hosts → Выберите хост → Templates → Add.

Если все правильно, вы сможете работать с данными, предоставляемыми шаблоном:
- Общие показатели: использование процессора и памяти, количество открытых подключений к серверу.
- Метрики запросов: среднее время отклика на запрос, процент запросов, приводящих к ошибке, количество запросов, обрабатываемых Nginx в секунду.
- Метрики SSL: количество обработанных Nginx рукопожатий в секунду, количество поддерживаемых Nginx шифров и количество ошибок сертификатов, с которыми сталкивается Nginx.
- Время работы: отслеживает, как долго Nginx работает без простоев.


Шаблон Zabbix также включает ряд триггеров, которые уведомляют вас о проблемах с вашим сервером Nginx. Эти триггеры оповещают вас о таких проблемах, как высокая загрузка процессора, высокое использование памяти, высокий уровень ошибок и простои. Например:
- Триггер высокой загрузки процессора: этот триггер будет оповещать вас, когда использование процессора на вашем сервере Nginx превысит определенный порог.
- Триггер высокого использования памяти: этот триггер будет оповещать вас, когда использование памяти на вашем сервере Nginx превысит определенный порог.
- Триггер высокого уровня ошибок: этот триггер будет оповещать вас, когда уровень ошибок на вашем сервере Nginx превысит определенный порог.
- Триггер простоя: этот триггер будет оповещать вас, если ваш сервер Nginx перестанет работать.

Вывод
Вы изучили, как подготовить Nginx для мониторинга с помощью Zabbix и добавить подходящий шаблон в Zabbix, что позволяет вам проактивно отслеживать работу вашего сервера и быстро решать возникающие проблемы.
191028
Санкт-Петербург
Литейный пр., д. 26, Лит. А
+7 (812) 403-06-99
![]()
700
300
ООО «ИТГЛОБАЛКОМ ЛАБС»
191028
Санкт-Петербург
Литейный пр., д. 26, Лит. А
+7 (812) 403-06-99
![]()
700
300
ООО «ИТГЛОБАЛКОМ ЛАБС»
Nginx is a high-performance web server, reverse proxy, load balancer, and HTTP cache that powers many of the world’s most popular websites. It’s lightweight, fast, and reliable, but like any software, issues can arise. In this blog post, we’ll explore the essential tools and techniques for monitoring and troubleshooting Nginx. We’ll cover how to configure Nginx for effective logging, how to analyze logs, and how to use various tools to diagnose and resolve issues. Whether you’re a beginner or an experienced user, this guide will provide valuable insights to help keep your Nginx deployment running smoothly.
Understanding Nginx Logs
Nginx has two primary log files: the access log and the error log. Understanding the information contained in these logs is crucial for identifying and resolving issues.
Access Log
The access log records every request made to your Nginx server, including details about the client, the requested resource, the response code, and other useful information. By default, the access log is located at /var/log/nginx/access.log.
Here’s an example of a typical access log entry:
127.0.0.1 - - [26/Mar/2023:12:34:56 +0000] "GET /index.html HTTP/1.1" 200 612 "-" "Mozilla/5.0 (Macintosh; Intel Mac OS X 10_15_7) AppleWebKit/537.36 (KHTML, like Gecko) Chrome/88.0.4324.96 Safari/537.36"
This entry contains the following information:
- IP address of the client (
127.0.0.1) - Date and time of the request (
[26/Mar/2023:12:34:56 +0000]) - Request method, resource, and protocol (
GET /index.html HTTP/1.1) - Response status code (
200) - Size of the response in bytes (
612) - Referrer URL (
-in this case, indicating no referrer) - User agent string of the client (
Mozilla/5.0 (Macintosh; Intel Mac OS X 10_15_7) AppleWebKit/537.36 (KHTML, like Gecko) Chrome/88.0.4324.96 Safari/537.36)
Error Log
The error log contains messages about errors and warnings encountered by Nginx during its operation. The default location for the error log is /var/log/nginx/error.log.
An example error log entry might look like this:
2023/03/26 12:34:56 [error] 12345#12345: *1 open() "/usr/share/nginx/html/missing_file.html" failed (2: No such file or directory), client: 127.0.0.1, server: localhost, request: "GET /missing_file.html HTTP/1.1", host: "localhost"
This entry indicates that a client requested a file that doesn’t exist on the server, resulting in a 404 Not Found error.
Configuring Logging
Nginx provides several directives for configuring logging. The access_log and error_log directives define the location and format of the access and error logs, respectively. You can also use the log_format directive to define custom log formats.
To configure the access and error logs, add the following directives to your Nginx configuration file:
http {
    access_log /var/log/nginx/access.log;
    error_log /var/log/nginx/error.log warn;

    log_format custom '$remote_addr - $remote_user [$time_local] "$request" $status $body_bytes_sent "$http_referer" "$http_user_agent"';

    server {
        ...
        access_log /var/log/nginx/custom_access.log custom;
        error_log /var/log/nginx/custom_error.log;
    }
}
In this example, we’ve defined a custom log format called custom using the log_format directive. This custom format includes the same information as the default format, but you can modify it to include additional fields or change the order of the fields.
We’ve also specified the locations of the access and error logs for the http block and the server block. The warn level for the error log in the http block indicates that only messages with a severity of «warning» or higher will be logged. You can use different log levels, such as info, notice, warn, error, crit, alert, or emerg, depending on your needs.
Analyzing Logs
Now that you know how to configure logging, it’s essential to understand how to analyze the logs to identify and resolve issues.
Using grep and awk
grep and awk are powerful command-line tools for searching and processing text files, like log files. You can use these tools to filter and analyze your Nginx logs.
For example, to find all requests with a 404 status code in your access log, you can use the following command:
grep ' 404 ' /var/log/nginx/access.log
To count the number of requests with a specific status code, you can use grep and wc:
grep ' 404 ' /var/log/nginx/access.log | wc -l
awk can be used to extract specific fields from the log file. For example, to list the top 10 most requested resources, you can use the following command:
awk '{print $7}' /var/log/nginx/access.log | sort | uniq -c | sort -rn | head -10
Log Analysis Tools
In addition to command-line tools like grep and awk, several log analysis tools can help you understand your Nginx logs more effectively.
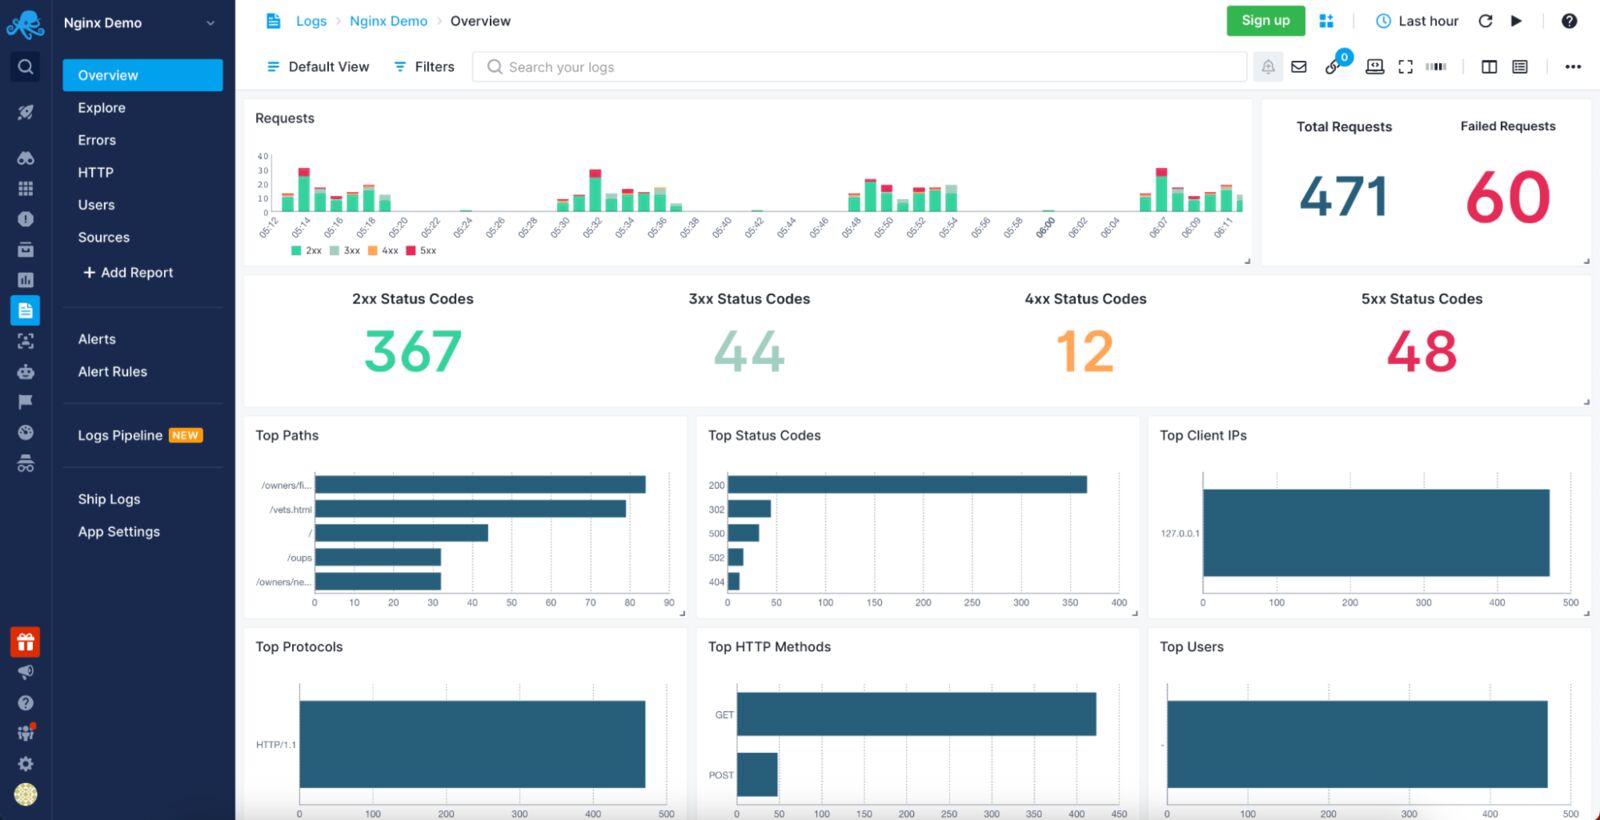
- GoAccess: GoAccess is an open-source, real-time log analyzer that provides valuable insights into your Nginx logs. It offers both a command-line interface and an interactive web-based report. You can use GoAccess to analyze your logs by running:
goaccess /var/log/nginx/access.log -o report.html
This command generates an HTML report with various statistics, such as the number of requests, unique visitors, requested files, referring sites, and more.
- Elasticsearch, Logstash, and Kibana (ELK Stack): The ELK Stack is a popular log management platform that allows you to collect, store, and analyze log data. Logstash can be used to parse and process your Nginx logs, while Elasticsearch stores the data and Kibana provides a powerful web-based interface for querying and visualizing the data.
Troubleshooting Nginx Issues
Armed with knowledge about Nginx logs and log analysis tools, you can effectively troubleshoot various issues that may arise with your Nginx deployment.
Common Issues and Solutions
- 403 Forbidden: This error indicates that the client does not have permission to access the requested resource. To resolve this issue, check the file and directory permissions and ensure that the Nginx user has read access to the requested file.
-
404 Not Found: This error occurs when the requested resource cannot be found on the server. Check your Nginx configuration to ensure that the
rootandaliasdirectives are correctly set, and that the requested file exists in the specified location. -
502 Bad Gateway: This error typically occurs when Nginx is configured as a reverse proxy and the upstream server is not responding or is returning an invalid response. To resolve this issue, check the following:
- Verify that the upstream server is running and reachable.
- Ensure that the
proxy_passdirective in your Nginx configuration is correctly set. - Check the logs of both Nginx and the upstream server for any error messages or clues.
-
504 Gateway Timeout: This error occurs when the upstream server takes too long to respond to a request. You can try the following steps to resolve this issue:
- Increase the
proxy_read_timeoutandproxy_connect_timeoutvalues in your Nginx configuration. - Investigate the performance of the upstream server and optimize it if necessary.
- Increase the
-
High CPU or memory usage: If you notice that Nginx is consuming excessive CPU or memory resources, consider the following steps:
- Optimize your Nginx configuration, such as by enabling gzip compression, adjusting worker processes and connections, and fine-tuning buffers and timeouts.
- Investigate the possibility of a DDoS attack or other malicious activity by analyzing your access logs.
- If your server is experiencing heavy traffic, consider scaling your infrastructure, such as by adding more resources or implementing a load balancer.
FAQ
Q: How do I restart or reload my Nginx server after making changes to the configuration?
A: You can restart or reload your Nginx server using the following commands:
- To restart Nginx:
sudo systemctl restart nginx
- To reload Nginx without interrupting existing connections:
sudo systemctl reload nginx
Q: How can I test my Nginx configuration for syntax errors before applying the changes?
A: You can use the nginx -t command to check your configuration for syntax errors:
sudo nginx -t
If there are no errors, you’ll see a message like «nginx: configuration file /etc/nginx/nginx.conf test is successful.» If there are errors, the command will display the specific issue and line number.
Q: How do I enable HTTPS (SSL/TLS) for my Nginx server?
A: To enable HTTPS for your Nginx server, you’ll need to obtain an SSL certificate from a certificate authority (CA) and configure Nginx to use it. You can use Let’s Encrypt, a free and automated CA, to obtain an SSL certificate. The Certbot tool can automate the process of obtaining a certificate and configuring Nginx to use it. For detailed instructions, refer to the official Certbot documentation.
Q: How do I block specific IP addresses or ranges from accessing my Nginx server?
A: You can use the deny directive in your Nginx configuration to block specific IP addresses or ranges. For example, to block an individual IP address, add the following to your server or location block:
deny 192.168.1.1;
To block an IP range, use CIDR notation:
deny 192.168.1.0/24;
After making changes, remember to reload or restart your Nginx server.
Едва ли сегодня найдется системный администратор, который не слышал про NGINX — программу, способную выполнять очень много функций, от кэширования и отдачи статического контента сайта до балансировки нагрузки и построения узлов CDN.
Правильная настройка NGINX влияет на работоспособность и производительность использующих его сайтов.
Из нашей статьи вы узнаете, как установить NGINX в ОС Debian и настроить мониторинг этой программы с помощью SAAS-сервиса NGINX Amplify, а также с помощью Zabbix.
Если на вашем сервере есть панель, такая как ISPmanager или Hestia Control Panel, то, скорее всего, NGINX уже установлен. Вы можете проверить это такой командой:
# systemctl status nginxЕсли NGINX отсутствует, то вы увидите сообщение:
Unit nginx.service could not be found.При наличии на сервере упомянутых выше панелей следует устанавливать NGINX только через них. Если же панелей нет, то установите NGINX, как описано в документации.
Далее мы привели краткую инструкцию по установке, опустив проверку ключа:
# apt install curl gnupg2 ca-certificates lbs.-release debian-archive-keyring
# curl https://nginx.org/keys/nginx_signing.key | gpg --dearmor
    | sudo tee /usr/share/keyrings/nginx-archive-keyring.gpg >/dev/null

# echo "deb [signed-by=/usr/share/keyrings/nginx-archive-keyring.gpg]
http://nginx.org/packages/debian `lsb_release -cs` nginx"
    | sudo tee /etc/apt/sources.list.d/nginx.list

# apt update
# apt install nginx
Для запуска NGINX используйте команду systemctl:
# systemctl start nginx
# systemctl enable nginx
Проверить состояние NGINX можно с помощью той же команды, что и при проверке на наличие программы в панели:
# systemctl status nginxЕсли все хорошо, то сервис nginx будет в состоянии active (running) и enabled:
● nginx.service - nginx - high performance web server
     Loaded: loaded (/lib/systemd/system/nginx.service; enabled; vendor preset: enabled)
     Active: active (running) since Mon 2022-09-26 15:33:34 MSK; 2s ago
       Docs: https://nginx.org/en/docs/
    Process: 1951723 ExecStart=/usr/sbin/nginx -c /etc/nginx/nginx.conf (code=exited, status=0/SUCCESS)
   Main PID: 1951724 (nginx)
      Tasks: 5 (limit: 4676)
     Memory: 3.9M
        CPU: 20ms
     CGroup: /system.slice/nginx.service
             ├─1951724 nginx: master process /usr/sbin/nginx -c /etc/nginx/nginx.conf
             ├─1951725 nginx: worker process
             ├─1951726 nginx: worker process
             ├─1951727 nginx: worker process
             └─1951728 nginx: worker process
Здесь видно, что файл конфигурации NGINX /etc/nginx/nginx.conf передается программе /usr/sbin/nginx при запуске сервиса.
Если сервис запущен, то работает один мастер-процесс, а также несколько рабочих процессов (в нашем случае их четыре). Количеством рабочих процессов можно управлять, редактируя файл конфигурации с последующим перезапуском сервиса nginx.
Файлы конфигурации NGINX
Файлы конфигурации NGINX находятся в каталоге /etc/nginx и его подкаталогах. Основной файл конфигурации etc/nginx/nginx.conf подключает файлы конфигурации, расположенные в подкаталогах каталога /etc/nginx. Состав этих подкаталогов может изменяться, если на сервере установлена панель управления, например, ISPmanager.
Когда мы будем подключать мониторинг NGINX, а также оптимизировать эту программу для повышения производительности, нам потребуется редактировать файлы конфигурации.
В каталоге /etc/nginx есть ряд файлов и каталогов:
# ls -1 /etc/nginx
conf.d
fastcgi.conf
fastcgi_params
koi-utf
koi-win
mime.types
modules
modules-enabled
nginx.conf
proxy_params
scgi_params
sites-available
sites-enabled
snippets
uwsgi_params
win-utf
В каталоге conf.d находятся файлы конфигурации, которые включаются в основной файл nginx.conf с помощью оператора include:
include /etc/nginx/conf.d/*.conf;Этот оператор добавляет все файлы с расширением имени conf к основному файлу конфигурации.
Каталог sites-available содержит файлы конфигурации для виртуальных хостов, а каталог sites-enabled — ссылки на эти файлы конфигурации для активных хостов.
Если на сервере установлена панель ISPmanager, к перечисленному выше каталогу добавляются еще несколько:
vhosts
vhosts-includes
vhosts-resources
Они подключаются к основному файлу конфигурации nginx:
include /etc/nginx/vhosts/*/*.conf;В каталоге vhosts содержатся файлы конфигурации сайтов, принадлежащих пользователям. Что же касается каталога vhosts-includes, то там находятся дополнительные файлы конфигурации, которые панель ISPmanager записывает при установке таких сайтов и систем, как phpMyAdmin, Roundcube, awstats и аналогичных:
awstats-nginx.conf
blacklist-nginx.conf
disabled.conf
letsencrypt.conf
phpmyadmin-nginx.conf
roundcube-nginx.conf
В других панелях управления сервером состав, назначение и расположение файлов конфигурации NGINX может быть иным.
Настройка сбора метрик NGINX
Чтобы контролировать работу NGINX с помощью Zabbix или SAAS-сервиса NGINX Amplify, необходимо добавить в конфигурацию NGINX следующий блок:
server {
    listen 127.0.0.1:80;
    server_name 127.0.0.1;
    location /nginx_status {
        stub_status on;
        access_log off;
        allow 127.0.0.1;
        deny all;
    }
}
Запишите эту конфигурацию в файл /etc/nginx/conf.d/stub_status.conf, а затем проверьте её, перезапустите сервис nginx и убедитесь, что он работает:
# nginx -t
# systemctl restart nginx
# systemctl status nginx
Если на сервере установлена панель ISPmanager, запишите этот файл в каталог /etc/nginx/vhosts-includes/ вместо каталога /etc/nginx/conf.d/.
Далее с помощью curl проверьте доступность сайта http://127.0.0.1/nginx_status:
$ curl http://127.0.0.1/nginx_statusЕсли все сделано правильно, вы увидите на консоли такие строки (у вас будут другие цифры):
Active connections: 185
server accepts handled requests
 3801461 3801356 11950677
Reading: 0 Writing: 16 Waiting: 171
Теперь отредактируйте формат журналов доступа и ошибок в файле /etc/nginx/nginx.conf. Сразу после установки NGINX в этом файле журнал ошибок, журнал доступа, а также формат журнала определены так:
error_log  /var/log/nginx/error.log notice;
access_log  /var/log/nginx/access.log main;
log_format  main  '$remote_addr - $remote_user [$time_local] "$request" '
  '$status $body_bytes_sent "$http_referer" '
  '"$http_user_agent" "$http_x_forwarded_for"';
Закройте символом комментария определение журнала доступа и определение пути к журналу access_log, добавив другие определения:
log_format main_ext '$remote_addr - $remote_user [$time_local] "$request" ' '$status $body_bytes_sent "$http_referer" ' '"$http_user_agent" "$http_x_forwarded_for" ' '"$host" sn="$server_name" ' 'rt=$request_time ' 'ua="$upstream_addr" us="$upstream_status" ' 'ut="$upstream_response_time" ul="$upstream_response_length" ' 'cs=$upstream_cache_status' ;

# access_log  /var/log/nginx/access.log  main;
 access_log  /var/log/nginx/access.log main_ext;
После внесения изменений проверьте конфигурацию NGINX и перезапустите сервис, как мы это делали раньше.
Мониторинг с помощью SAAS-сервиса NGINX Amplify
SAAS-сервис NGINX Amplify от создателей NGINX несложен в подключении, бесплатен при добавлении до 5 узлов и обладает большими возможностями мониторинга. Этот сервис выполняет сбор статистики при помощи собственного агента, который потребуется установить на контролируемый сервер.
Если нужно контролировать много узлов или хочется все держать в своих руках, а также если у вас уже имеются серверы Zabbix, возможно, вам больше подойдет мониторинг NGINX при помощи Zabbix, о чем мы расскажем ниже в этой статье.
Установка NGINX Amplify
Прежде чем приступить к установке агента NGINX Amplify, необходимо установить NGINX и настроить сбор метрик NGINX, как это было описано ранее в нашей статье.
Обратите внимание, что в процессе установки будет добавлен файл репозитория /etc/apt/sources.list.d/nginx-amplify.list.
Если на сервере установлена панель управления, такая как ISPmanager, убедитесь, что эта операция не приведет к конфликтам. В том случае, когда разработчики панели управления сервером не гарантируют совместимость с агентом NGINX Amplify, рассмотрите возможность использования для мониторинга NGINX средств Zabbix.
На момент написания этой статьи поддержка компании ISPmanager ответила, что совместимость NGINX Amplify с ISPmanager 6 не тестировалась, а добавлять сторонние репозитории не рекомендуется.
Если панели ISPmanager на сервере нет, приступим к установке. Зарегистрируйтесь на сайте https://amplify.nginx.com/. После регистрации на экране появится инструкция для установки агента NGINX Amplify на контролируемый сервер (рис. 1).

Прежде всего в этой инструкции предлагается скачать скрипт установки агента. Для Debian можно использовать команду wget:
# wget https://github.com/nginxinc/nginx-amplify-agent/raw/master/packages/install.shДалее запустите скрипт установки (часть ключа мы закрыли символами «», у вас будет свой ключ):
# API_KEY='485*********************6f5' sh ./install.shЕсли установка прошла успешно, то примерно через одну минуту на странице сервиса появится информация о состоянии добавленного узла (рис. 2).
")
В данном случае показаны графики для тестового узла, нагруженные при помощи сервиса https://loaddy.com/. Ошибки на графике NGINX HTTP Errors появились из-за попыток доступа сервиса к несуществующей странице.
Полная документация по установке и настройке NGINX Amplify доступна на сайте проекта.
Контролируемые метрики
SAAS-сервис NGINX Amplify анализирует значительное количество метрик, имеющих отношение к NGINX, к операционной системе, собирает метрики PHP-FRM, метаданные NGINX, а также информацию об операционной системе, такую как имя узла, время uptime и так далее.
Полный список метрик можно найти здесь.
Веб-интерфейс NGINX Amplify
С помощью веб-интерфейса NGINX Amplify, доступного зарегистрированным пользователям, удобно просматривать текущее состояние сервиса NGINX и узлов, на которых он запущен. Также можно получить сведения о конфигурации NGINX и ОС, и, что ценно, рекомендации по настройке конфигурации NGINX.
Веб-интерфейс состоит из нескольких страниц, описанных в документации.
Overview
По содержимому страницы Overview вы можете быстро определить состояние вашей системы — посмотреть общее количество запросов, ошибок с кодом 5xx, среднее время запросов, трафик, а также использование CPU.
Graphs
На странице Graphs можно просмотреть предопределенный набор графиков, отражающих состояние основных метрик, как для NGINX, так и для системы.
Dashboards
Открыв страницу Dashboards, вы сможете создать и настроить панели с графиками нужных вам метрик.
Тут можно создать новые наборы данных для графиков, новые графики и добавить в мониторинг новые значения.
Analyzer
На этой странице можно получить отчеты по конфигурации выбранной системы, а также рекомендации по настройке параметров в файле конфигурации NGINX с точки зрения повышения производительности и улучшения безопасности.
Alerts
На странице Alerts можно создать правила оповещения о событиях, требующих реакции. Извещения могут быть отправлены на электронную почту или в Slack.
Мониторинг NGINX с помощью Zabbix
С помощью шаблона Nginx by Zabbix agent можно очень просто организовать мониторинг NGINX. К сожалению, от такого мониторинга вы не получите рекомендаций по настройке конфигурации NGINX, однако упомянутый шаблон содержит необходимые метрики и триггеры. Анализируя метрики, можно оптимизировать настройки NGINX вручную.
Кроме того, мониторинг Zabbix можно использовать в тех случаях, когда SAAS-сервис NGINX Amplify не применим по тем или иным причинам.
Описание шаблона можно найти в документации.
Настройка мониторинга
Настройка мониторинга с помощью шаблона Nginx by Zabbix agent заключается в подключении этого шаблона к узлу, где работает NGINX, а также в добавлении файла конфигурации с таким содержимым:
location = /basic_status {
    stub_status;
    allow 127.0.0.1;
    allow ::1;
    deny all;
}
Вы можете записать эту конфигурацию в файл /etc/nginx/conf.d/stub_status.conf, как мы это делали при настройке NGINX для NGINX Amplify.
При использовании на сервере панели ISPmanager запишите файл stub_status.conf в каталог /etc/nginx/vhosts-includes.
После добавления файла проверьте конфигурацию, перезапустите сервис nginx и убедитесь, что он работает:
# nginx -t
# systemctl restart nginx
# systemctl status nginx
Далее с помощью curl проверьте доступность сайта по адресу http://127.0.0.1/basic_status:
$ curl http://127.0.0.1/basic_statusНа консоли должна появиться такая информация:
Active connections: 238
server accepts handled requests
 3963975 3963870 12559829
Reading: 0 Writing: 46 Waiting: 229
Макросы шаблона Nginx by Zabbix agent
Если вы сделали настройки, как это было описано в предыдущем разделе статьи, вам, скорее всего, не придется изменять макросы шаблона Nginx by Zabbix agent (рис. 3).

При необходимости вы можете изменить параметры, определяющие подключение к сайту сбора метрик NGINX — {$NGINX.STUB_STATUS.HOST}, {$NGINX.STUB_STATUS.PATH} и {$NGINX.STUB_STATUS.PORT}.
Например, если вы раньше настраивали этот сайт для NGINX Amplify, то в макросе {$NGINX.STUB_STATUS.PATH} вместо basic_status укажите nginx_status.
Параметр {$NGINX.DROP_RATE.MAX.WARN} определяет порог срабатывания триггера, сигнализирующего о потерянных соединениях, а параметр {$NGINX.RESPONSE_TIME.MAX.WARN} — максимальное время ответа для использования в триггерах.
Метрики шаблона Nginx by Zabbix agent
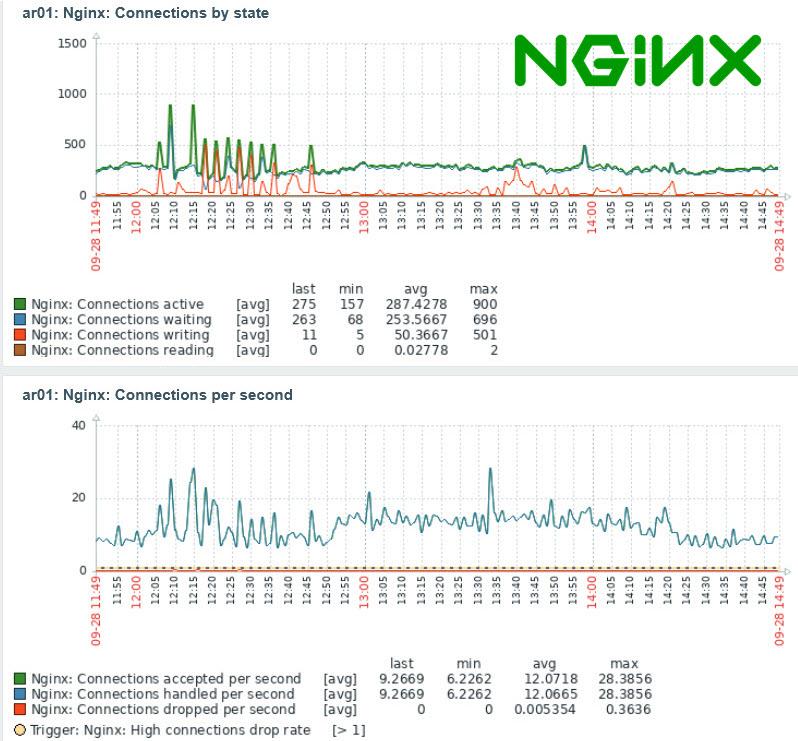
В шаблоне Nginx by Zabbix agent определены все метрики, необходимые для контроля работоспособности и производительности NGINX (рис. 4).

Это состояние сервиса, время его ответа, количество дочерних процессов, запущенных сервисом NGINX, память, зарезервированная для NGINX и использованная этим сервисом, использование CPU, а также параметры, имеющие отношение к соединениям, которые клиенты устанавливают с сервисом NGINX.
Полный перечень метрик вы найдете в описании агента.
Триггеры шаблона Nginx by Zabbix agent
В шаблоне Nginx by Zabbix agent определены триггеры, срабатывающие при возникновении ситуаций, требующих внимания системного администратора (рис. 5).

Самый высокий уровень важности High у триггера Nginx: Process is not running. Этот триггер срабатывает, когда сервис NGINX не активен. Возможно, он не запустился после изменения конфигурации и перезапуска из-за недостатка оперативной памяти или перестал работать по какой-то другой причине.
Средний уровень важности Average у триггера Nginx: Service is down, который устанавливается, если не запущен агент Nginx by Zabbix agent или если не работает сервис NGINX.
Остальным триггерам назначен уровень предупреждения Warning.
Срабатывание триггера Nginx: High connections drop rate говорит о том, что NGINX не успевает обрабатывать все соединения, и такая ситуация требует исследования и настройки конфигурации.
Триггер Nginx: Service response time is too high срабатывает, если время ответа NGINX больше, чем это определено в соответствующем макросе. Такая ситуация также требует проверки и оптимизации настроек конфигурации NGINX.
И, наконец, срабатывание триггера Nginx: Failed to fetch stub status page говорит о невозможности мониторинга состояния NGINX, так как сайт сбора метрик, такой как http://127.0.0.1/basic_status, не возвращает состояние NGINX. В этом случае нужно проверить настройки данного сайта.
Графики в шаблоне Nginx by Zabbix agent
В шаблоне имеются четыре графика с наиболее важной информацией NGINX, которые можно добавить в панель (рис. 6).

Это графики, имеющие отношение к соединениям, интенсивности запросов и установки соединений, а также к использованию оперативной памяти. Анализируя эти графики, а также факт срабатывания триггеров Nginx: High connections drop rate и Nginx: Service response time is too high, можно сделать заключение о необходимости оптимизации настроек сервиса NGINX.
Оптимизация настроек сервиса NGINX
Оптимизируя настройки сервиса NGINX, можно в десятки раз повысить скорость работы сайтов, размещенных на сервере.
Для изменения настроек сделайте резервную копию файла /etc/nginx/nginx.conf, а затем отредактируйте его. Далее проверьте конфигурацию NGINX, перезапустите сервис и убедитесь, что он запустился:
# nginx -t
# systemctl restart nginx
# systemctl status nginx
Параметры описаны в документации. В данной статье приведены рекомендации по настройке параметров.
Также, возможно, вам будет полезна книга «The Complete NGINX Cookbook», которую можно загрузить бесплатно с сайта разработчика. Вопросы оптимизации рассмотрены там в главе 15.
Далее мы расскажем об основных настройках.
Количество рабочих процессов worker_processes
Как мы уже говорили, параметр worker_processes задает количество рабочих процессов NGINX, которые запускает мастер-процесс этого сервиса.
Вы можете задать количество процессов равное количеству ядер CPU в вашей системе, или позволить NGINX определить это количество автоматически, указав параметр auto:
worker_processes auto; Количество ядер в системе можно определить при помощи команды lscpu:
# lscpu
Architecture:                    x86_64
CPU op-mode(s):                  32-bit, 64-bit
Byte Order:                      Little Endian
Address sizes:                   46 bits physical, 48 bits virtual
CPU(s):                          40
On-line CPU(s) list:             0-39
…
Можно также использовать команду, которая покажет на консоли только количество ядер:
# grep processor /proc/cpuinfo | wc -l
40
Максимальное количество соединений worker_connections
По умолчанию NGINX допускает 512 одновременных соединений. Если умножить это значение на worker_processes, то получим максимальное количество клиентов, обслуживаемых NGINX одновременно.
Значение worker_connections рекомендуется установить равным максимальному количеству файловых дескрипторов, которое можно определить так:
# ulimit -n
1024
Ниже мы привели пример установки worker_connections:
worker_connections 1024;Журналы ошибок и доступа
Если нужно ускорить работу NGINX за счет сокращения обращений к диску, то в различных статьях рекомендуют либо совсем отключить журналы доступа и ошибок, либо добавить буферизацию журнала доступа.
Отключить журнал ошибок можно так:
#error_log  /var/log/nginx/error.log warn;
error_log /dev/null error
Иногда рекомендуется записывать в журнал только критичные ошибки:
error_log /var/log/nginx/error.log crit;Но надо сказать, что эти варианты едва ли приведут к значительной экономии ресурсов. К тому же так можно пропустить важные сообщения.
Для отключения журнала доступа используйте следующую конструкцию:
#access_log /var/log/nginx/access.log main;
access_log off;
Хороший способ сокращения количества обращений к диску за счет журнала доступа — включить его буферизацию:
access_log /var/log/nginx/access.log main buffer=32k;Подробнее о логах и буферизации можно прочитать здесь.
Если вы используете для мониторинга NGINX Amplify, то при отключении журнала доступа и журнала ошибок мониторинг не получит полную информацию о состоянии NGINX.
Сжатие контента
Чтобы уменьшить объем передаваемых данных и ускорить загрузку в браузер содержимого текстовых страниц, скриптов и других файлов, добавьте в конфигурацию NGINX (для всего сервиса или только для отдельных сайтов) следующие строки:
gzip on;
gzip_comp_level 5;
gzip_disable "msie6";
gzip_types text/plain text/css application/json application/x-javascript text/xml application/xml application/xml+rss text/javascript application/javascript;
В приведенном примере включается сжатие (компрессия) gzip, при этом уровень сжатия устанавливается равным 5 (можно указывать от 1 до 9, уровень 5 — оптимальный). Чем больше уровень сжатия, тем меньше передается данных, но тем больше тратится ресурсов процессора.
Строка «gzip_disable «msie6″» отключает сжатие для устаревшего браузера Microsoft IE 6.
С помощью оператора gzip_types вы можете перечислить типы данных, которые нужно сжимать перед отправкой клиенту.
Кэширование статического контента
Чтобы сократить трафик, можно кэшировать статический контент в браузере, добавляя заголовок Cache-control. Для этого можно использовать настройку expires:
location ~* ^.+.(jpg|jpeg|gif|png|svg|js|css|mp3|ogg|mpe?g|avi|zip|gz|bz2?|rar|swf)$ {
	expires 7d;
	try_files $uri $uri/ @fallback;
    }
Здесь данные перечисленных в location типов кэшируются браузером на 7 дней.
Подробнее об этой возможности читайте здесь.
Еще одна возможность касается кэширования контента на дисках сервера средствами NGINX. Этой теме можно было бы посвятить отдельную статью, а сейчас мы ограничимся ссылкой на соответствующий раздел документации и на статьи по этой теме:
-
https://ru.linuxcapable.com/nginx-optimization-tuning-with-caching/
-
https://itnan.ru/post.php?c=1&p=520016
-
https://habr.com/ru/post/428127/
-
https://searchengines.guru/ru/forum/879527
Подключая кэширование контента на сервере при помощи NGINX, продумайте процедуру полной или выборочной очистки кэша.
Предупреждения при тестировании конфигурации NGINX
При тестировании конфигурации командой «nginx -t» на консоль выводятся обнаруженные ошибки и предупреждения. Некоторые из них могут быть связаны с большим количеством сайтов, определенных в конфигурации NGINX.
Например, можно столкнуться с таким предупреждением:
nginx: [warn] could not build optimal server_names_hash, you should increase either server_names_hash_max_size: 512 or server_names_hash_bucket_size: 64; ignoring server_names_hash_bucket_sizeВ данном случае помогло включение в конфигурацию NGINX следующих строк:
http {
  ...
  server_names_hash_max_size 512;
  server_names_hash_bucket_size 128;
  ...
}
Это решение было найдено здесь. Также эта ситуация описана в документации.
Сообщество NGINX очень большое, поэтому, если в предупреждении или сообщении об ошибке нет конкретных рекомендаций, вы всегда сможете найти ответ при помощи поиска.
Автор статьи: Александр Фролов.
НЛО прилетело и оставило здесь промокод для читателей нашего блога:
— 15% на все тарифы VDS (кроме тарифа Прогрев) — HABRFIRSTVDS.
NGINX is a highly popular web server considered one of the fastest solutions on the market. You can use it for serving data for small, personal projects, as a reverse proxy, or as an enterprise-grade solution powering large e-commerce sites handling millions of users daily. It supports a wide range of capabilities, such as HTTP cache, load balancing, or even a mail proxy, and offers features such as HTTP/2, TLS offloading, WebSockets and gRPC.
To fully leverage its capabilities, you need to be aware of what is happening to your environment, and handling NGINX isn’t different. You should keep an eye on all the metrics it exposes and use its log files to fully understand the traffic coming to your servers.
In this blog post we will look at the top NGINX log analyzer tools that will help you ship, centralize, aggregate, and finally analyze log events to get a detailed picture of what is happening with your NGINX servers.
1. Sematext Logs
Sematext Logs is a log aggregation and analysis tool with first-class support for NGINX, allowing you to slice and dice through NGINX access and error logs to find the ones that are most important at the moment. Sematext Logs provide out-of-the-box dashboards with pre-configured visualizations showing you the most important information coming from your logs, like requests summary, number of requests with given response code and much more. You can correlate logs with events and metrics, live-tail logs, add alerts to logs, and use Google-like syntax for filtering. Its powerful search and filtering capabilities give you the log context needed to find log events occurring before and after the one you are currently looking at.
Sematext features auto-discovery of logs to help you centralize logs in highly scalable and dynamic environments, whether you are using bare metal, virtual machines, or containers. Along with the
Pros:
- Provides an agent with pre-configured parsing rules for NGINX and other common formats like Apache common or Java garbage collector.
- Ease of integration with the rest of the Sematext Cloud offerings like Experience (RUM), Synthetics, and Infrastructure Monitoring, giving you a full observability solution in a single tool. This is especially useful if you want to correlate the log data with NGINX metrics for quick root cause analysis.
- Accepts data from various sources that can ship data in Elasticsearch-compatible format allowing integration of log events from various sources inside your environment.
- Once shipped, you can manipulate the data via user-friendly Logs Pipelines that enable further data processing, such as numerical data extraction, IP to geolocation mapping and many more.
Cons:
- No support for unstructured text. You can only send JSON-formatted log events, use syslog to send data, or use the provided agent that supports a limited set of common formats. It won’t be an issue with NGINX log events but may become a limitation when dealing with many different log sources.
- It doesn’t allow mixing Kibana and Sematext native UI widgets in a single dashboard – it is one or the other.
Price:
Sematext Logs starts with a Basic plan allowing up to 500MB/day worth of logs and 7 days of data retention for free. The Standard plan has a limited set of features and starts at $50/month and includes 1GB/day and 7 days retention, which translates to around $0.1/GB of received data and $1.56/GB of stored data. The fully-featured Pro plan has Logs Pipelines, Log Archiving, and more, starting at around $60/month for 1GB/day of data and 7-day retention, meaning $0.1/GB of received data and $1.90/GB of stored data.
2. GoAccess
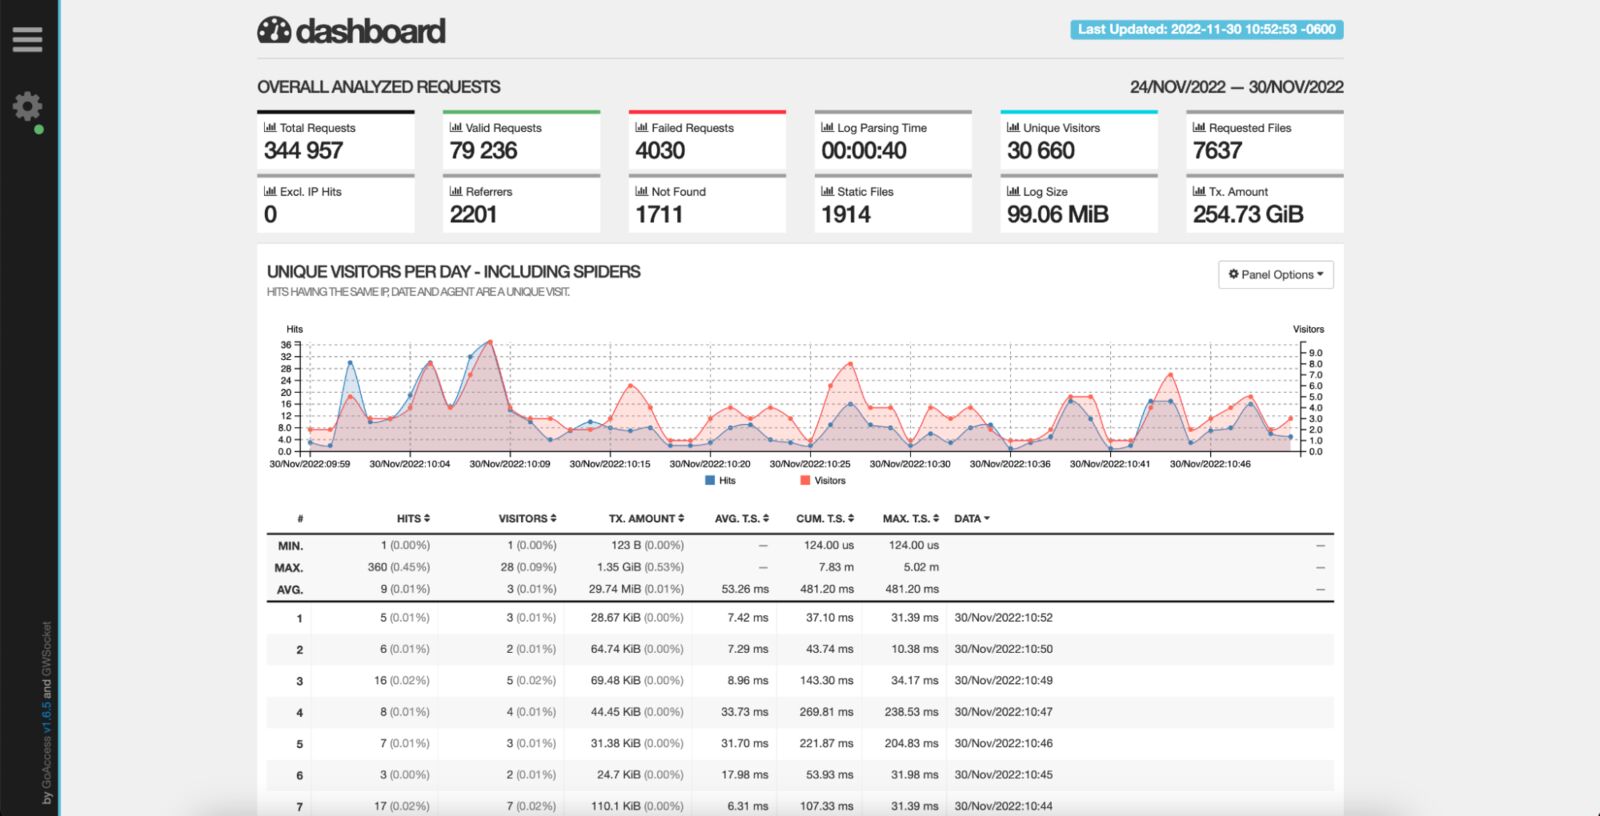
GoAccess is an open-source, real-time web log analyzer with NGINX log analysis capabilities. It works in the terminal if you lack access to the visual environment or via browser using a real-time generated HTML file. Incredibly fast, written in C, and supporting a wide range of web server formats, including NGINX, Apache and Amazon S3, it could be the only tool you need to process your NGINX logs and get all the necessary information out of them. The generated HTML files can be updated dynamically and provide details about requests, visitors, top URLs, 404 pages, IPs and hostnames of your visitors – these are only a few examples of the visualizations you get out of the box of this solution. On top of that, GoAccess supports virtual hosts, allowing you to easily identify which consumes the most resources.
Pros:
- First-class NGINX support that doesn’t need to be adjusted or configured.
- Minimal configuration needed to set up for NGINX logs.
- Beautiful terminal dashboard for hard-core site reliability engineers that prefer the dark terminal over rich web visualizations.
- Support for incremental log processing with the on-disk database.
Cons:
- Logs need to be centralized in a single shared place if you want to visualize all your NGINX hosts together.
Price:
GoAccess is an open-source and free-of-charge NGINX log analyzer.
3. Elastic Stack
The Elastic Stack, formerly known as ELK Stack, is one of the most widely adopted tools used for analyzing logs for most of the available technologies, including NGINX. It started as the ELK trio combining Elasticsearch, the search and analytics engine; Logstash, the log processing and shipping tool; and Kibana, the visualization layer. Since then, it has evolved to include additional tools, such as Beats, a lightweight log shipper with NGINX support included.
The solution enables you to aggregate logs, slice and dice them and process them to enable rich analysis. You can extract every piece of NGINX log events and enrich them with location and security information. With its powerful aggregation engine, you can create dashboards showing you all the necessary details about your NGINX and the users interacting with it. Depending on your use case, you can install and run it in your environment or the cloud. And all these are available from a single vendor.
Pros:
- Logging support for virtually any kind of technology available, allowing easy correlation between events across your infrastructure, thus enabling faster troubleshooting.
- Scalable to support large data volume and long retention.
- Mature and configurable log shippers with native support for NGINX.
- Rich, virtually unlimited visualizations.
Cons:
- May be challenging to maintain at a larger scale, requiring in-depth knowledge.
- Limited features of the Basic version.
Price:
The Basic version of Elastic Stack is free but self-managed, so you need to consider what comes with it – maintenance. It has limited features, including machine learning which becomes available with the platinum-grade tier, which starts at $125 a month.
4. Datadog
Datadog is a unified solution that allows you to navigate from your NGINX logs to metrics, traces and back for efficient root cause analysis and performance comparison. It also provides live tail functionality to monitor your logs in near real time. All from a single vendor.
Datadog offers log analyzers with support for NGINX logging capabilities, giving you everything you need to analyze your NGINX log data. With support for more than 170 technologies, you can centralize your logs in a single place and extract the metrics out of it for dynamic altering. Further, you can prioritize the high-value logs to get a cost-effective and scalable approach to centralized log management.
Pros:
- On data ingestion processing allows you to ship virtually any format of log events and parse them on the solution side, including NGINX.
- Possibility to generate metrics out of NGINX logs allowing for rich dashboarding for your access and error logs.
- Real-time alerting with log-based custom metrics.
- TCP/SSL support with SOC 2 compliance for the highest security when it comes to logs.
- Rich extensibility of processing pipelines with more than 170 common technologies available.
Cons:
- Only self-hosted data archiving in the Ingest plan.
- Unlimited user accounts are available only in the more expensive plan.
Price:
Datadog offers two options for their log analyzer. The Ingest plan pricing starts at $0.10 per ingested or scanned GB of uncompressed data a month with process, live time and archive available. You also benefit from self-hosted archiving parsing the log events on data ingestion and log-based metrics. The second option is Retain or Rehydrate, an on-demand billing plan that’s priced at $2.25 per million log events per month and includes 15 days of logs retention based on tags or facets, log patterns and analytics, and log rehydration for auditing and historical analysis.
5. SolarWinds Loggly
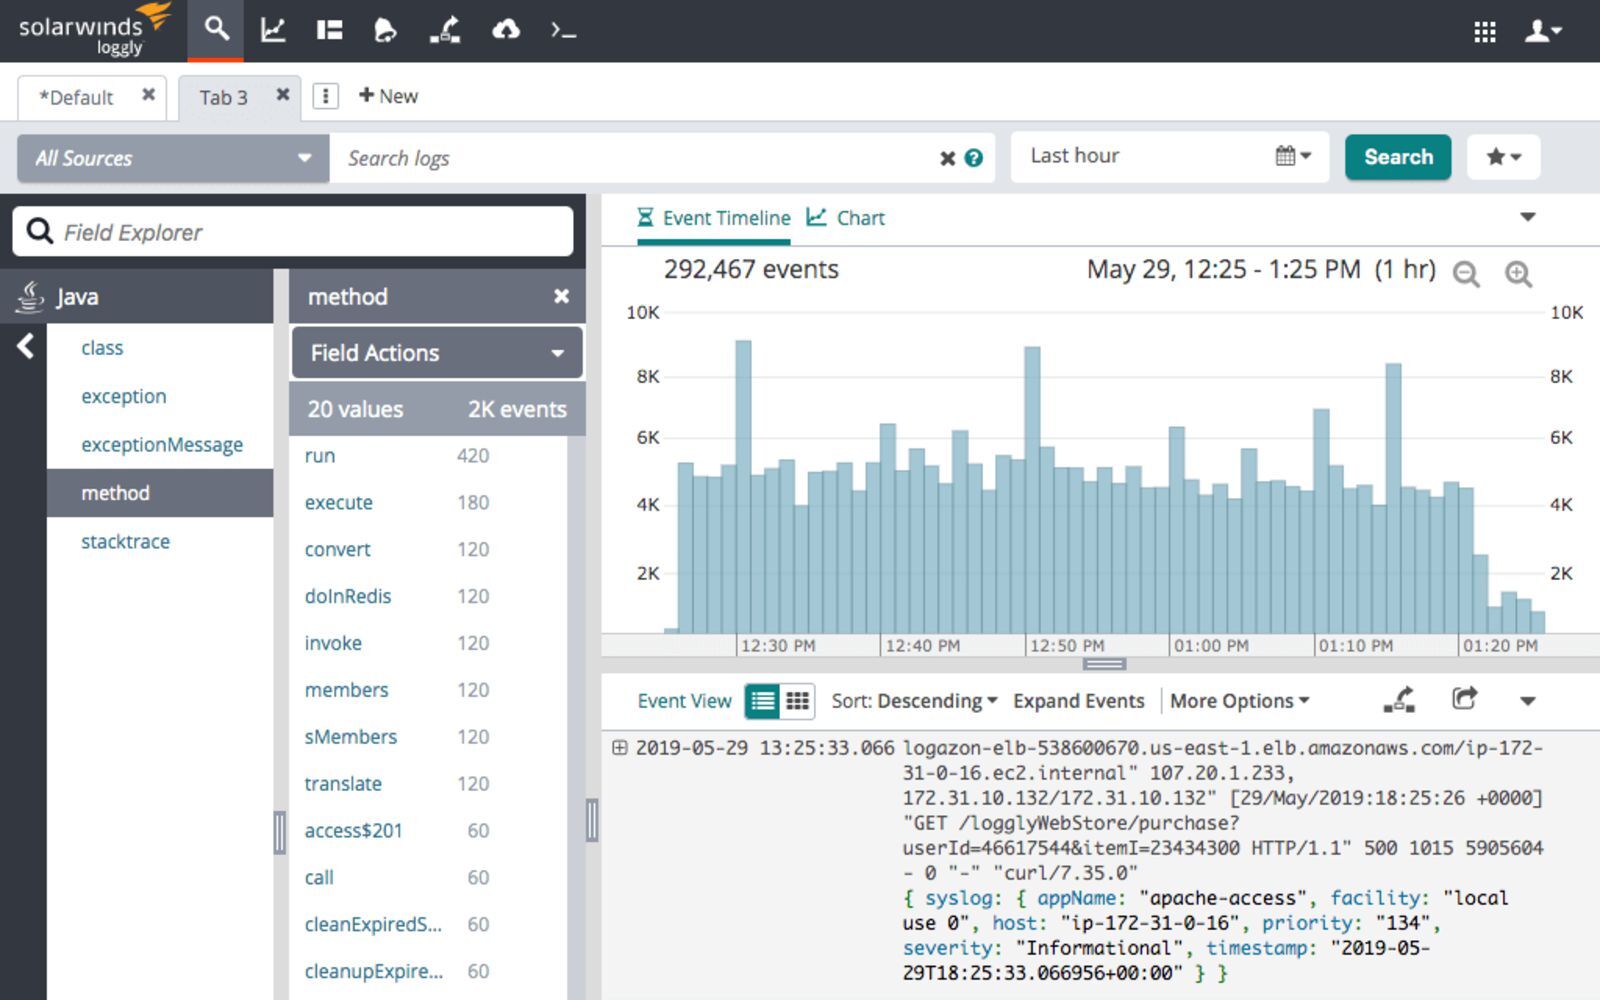
Loggly is a cloud-based log aggregation and management service that allows you to access and analyze your NGINX log data while giving you real-time insights into every detail of your NGINX logs. It’s a simple, yet efficient solution that uses well-established protocols such as HTTP or Syslog to ship the NGINX log data, so that you can choose the best way to ship each type of NGINX logs. The dynamic field explorer gives a real-time overview of your logs categorized by structure or customized view. And with its powerful full-text search capabilities you can search on individual fields to find the log events you are interested in – for example, the ones related to your most valuable URL handled by the NGINX server.
Pros:
- Server-side logs parsing, meaning that you don’t have to waste your server resources for log preparation.
- Agent-free logs collection enables easy shipping of NGINX logs.
- Support for popular log shippers.
- Parsing support for common log formats, including NGINX.
- Query time field extraction.
Cons:
- Some features, like API access, are only available when using higher plans, which can limit your log analysis process.
- Restrictive overage rules.
Price:
Loggly pricing starts with a free tier that includes 200MB/day of data ingestion with 7 days retention and includes basic functionality lacking alerting and customized dashboards. The paid plan starts at $79/month, billed annually for 1GB/day of data ingestion and 15 days retention, giving you access to a solution enriched with customized dashboards and email alerting. The Enterprise version starts at $279/month billed annually and includes all the features of the earlier plans, webhooks, custom daily data volume, and 15 to 90 days retention.
6. Sumo Logic
Sumo Logic is a unified logs platform with the first-class NGINX support. It features machine learning and predictive algorithms that enable daily processing of large amounts of data. The platform allows you to evaluate your NGINX server health, gain insights into the traffic origin and plan for resource allocation. Use various dashboards to track your users, see where most errors come from, and track requests and their trends across the platform.
Pros:
- Powerful query language.
- Automatic log patterns detection for easy NGINX integration.
- Centralized agents with easy setup supporting autoscaled environments.
- Rich visualization support to give you insights into every piece of NGINX logs.
Cons:
- Not available on-premises disqualifies the solution for some companies.
- No overage support.
Price:
Sumo Logic pricing is based on features and data ingestion. You can start with a free plan with limited features and up to 500MB daily data ingestion. The paid plans start with the Essential, which has log analytics, real-time alerting, and live and historical data dashboarding, costing you around $93/GB (an estimated cost based on annual commitment and 30 days data retention).
7. Papertrail
SolarWinds Papertrail is a cloud-hosted log aggregation and management tool with NGINX support and great features for log analysis. It allows you to search and analyze any type of log file, text log file, or data coming via the Syslog protocol. Using this protocol, Papertrail enables you to ship large amounts of log data very efficiently, making it a very good choice as an NGINX log analyzer.
Papertrail feels very much like using the console – its live tail search helps detect issues faster and trace back the chain of events to enable real-time root cause analysis. You can filter your NGINX log events by source, date, log severity level, user IP address, or message contents to focus on the most meaningful data.
Pros:
- Simple and user-friendly interface that mimics the console experience will help you focus on what is crucial in your NGINX log events.
- Built-in archiving of the data makes it easy to work with large volumes of NGINX log events.
- Data ingestion is calculated monthly, making the service spike-friendly, which is advantageous when dealing with NGINX and services having spiky behavior, such as e-commerce.
Cons:
- No rich visualization support.
- Overage is limited to 200% of the plan, which can result in logs dropping, especially for services with spiky traffic.
- Higher volume plans become expensive compared to other services especially considering limited visualization capabilities.
Price:
The pricing starts at $0 for 2 days worth of searchable data and 7 days archive with 50MB/month of data (with 16GB free as a first-month bonus). The paid plans start at $7 for 1GB/month of data, with the data being searchable for 1 week and archived for a year. The most expensive non-custom plan we can see is $230 for 25GB/month of data available for two weeks for searching and one year of archiving.
Conclusion
Understanding the traffic hosted by your NGINX instances is crucial for having a healthy working environment and reacting to the trends your users are following or creating. Understanding the logs can help you quickly identify issues in your environment and intervene immediately, resulting in the best user experience for everyone using your services. This is why you need a tool for gathering, centralizing, processing and analyzing the log events coming from your NGINX servers. Hopefully, this blog post gave you an overview of the potential solutions you can consider when looking for the right NGINX log analyzer for your use case.
Start Free Trial
In this tutorial, you will learn everything you need to know about logging in
NGINX and how it can help you troubleshoot and quickly resolve any problem you
may encounter on your web server. We will discuss where the logs are stored and
how to access them, how to customize their format, and how to centralize them in
one place with Syslog or a log management service.
Here’s an outline of what you will learn by following through with this tutorial:
- Where NGINX logs are stored and how to access them.
- How to customize the NGINX log format and storage location to fit your needs.
- How to utilize a structured format (such as JSON) for your NGINX logs.
- How to centralize NGINX logs through Syslog or a managed cloud-based service.
Prerequisites
To follow through with this tutorial, you need the following:
- A Linux server that includes a non-root user with
sudoprivileges. We tested
the commands shown in this guide on an Ubuntu 20.04 server. - The
NGINX web server installed
and enabled on your server.
🔭 Want to centralize and monitor your NGINX logs?
Head over to Logtail and start ingesting your logs in 5 minutes.
Step 1 — Locating the NGINX log files
NGINX writes logs of all its events in two different log files:
- Access log: this file contains information about incoming requests and
user visits. - Error log: this file contains information about errors encountered while
processing requests, or other diagnostic messages about the web server.
The location of both log files is dependent on the host operating system of the
NGINX web server and the mode of installation. On most Linux distributions, both
files will be found in the /var/log/nginx/ directory as access.log and
error.log, respectively.
A typical access log entry might look like the one shown below. It describes an
HTTP GET request to the server for a favicon.ico file.
217.138.222.101 - - [11/Feb/2022:13:22:11 +0000] "GET /favicon.ico HTTP/1.1" 404 3650 "http://135.181.110.245/" "Mozilla/5.0 (Windows NT 10.0; Win64; x64) AppleWebKit/537.36 (KHTML, like Gecko) Chrome/98.0.4758.87 Safari/537.36" "-"
Similarly, an error log entry might look like the one below, which was generated
due to the inability of the server to locate the favicon.ico file that was
requested above.
2022/02/11 13:12:24 [error] 37839#37839: *7 open() "/usr/share/nginx/html/favicon.ico" failed (2: No such file or directory), client: 113.31.102.176, server: _, request: "GET /favicon.ico HTTP/1.1", host: "192.168.110.245:80"
In the next section, you’ll see how to view both NGINX log files from the
command line.
Step 2 — Viewing the NGINX log files
Examining the NGINX logs can be done in a variety of ways. One of the most
common methods involves using the tail command to view logs entries in
real-time:
sudo tail -f /var/log/nginx/access.log
You will observe the following output:
107.189.10.196 - - [14/Feb/2022:03:48:55 +0000] "POST /HNAP1/ HTTP/1.1" 404 134 "-" "Mozila/5.0"
35.162.122.225 - - [14/Feb/2022:04:11:57 +0000] "GET /.env HTTP/1.1" 404 162 "-" "Mozilla/5.0 (Windows NT 10.0; Win64; x64; rv:58.0) Gecko/20100101 Firefox/58.0"
45.61.172.7 - - [14/Feb/2022:04:16:54 +0000] "GET /.env HTTP/1.1" 404 197 "-" "Mozilla/5.0 (X11; Linux x86_64) AppleWebKit/537.36 (KHTML, like Gecko) Chrome/81.0.4044.129 Safari/537.36"
45.61.172.7 - - [14/Feb/2022:04:16:55 +0000] "POST / HTTP/1.1" 405 568 "-" "Mozilla/5.0 (X11; Linux x86_64) AppleWebKit/537.36 (KHTML, like Gecko) Chrome/81.0.4044.129 Safari/537.36"
45.137.21.134 - - [14/Feb/2022:04:18:57 +0000] "GET /dispatch.asp HTTP/1.1" 404 134 "-" "Mozilla/5.0 (iPad; CPU OS 7_1_2 like Mac OS X; en-US) AppleWebKit/531.5.2 (KHTML, like Gecko) Version/4.0.5 Mobile/8B116 Safari/6531.5.2"
23.95.100.141 - - [14/Feb/2022:04:42:23 +0000] "HEAD / HTTP/1.0" 200 0 "-" "-"
217.138.222.101 - - [14/Feb/2022:07:38:40 +0000] "GET /icons/ubuntu-logo.png HTTP/1.1" 404 197 "http://168.119.119.25/" "Mozilla/5.0 (Windows NT 10.0; Win64; x64) AppleWebKit/537.36 (KHTML, like Gecko) Chrome/98.0.4758.87 Safari/537.36"
217.138.222.101 - - [14/Feb/2022:07:38:42 +0000] "GET /favicon.ico HTTP/1.1" 404 197 "http://168.119.119.25/" "Mozilla/5.0 (Windows NT 10.0; Win64; x64) AppleWebKit/537.36 (KHTML, like Gecko) Chrome/98.0.4758.87 Safari/537.36"
217.138.222.101 - - [14/Feb/2022:07:44:02 +0000] "GET / HTTP/1.1" 304 0 "-" "Mozilla/5.0 (Windows NT 10.0; Win64; x64) AppleWebKit/537.36 (KHTML, like Gecko) Chrome/98.0.4758.87 Safari/537.36"
217.138.222.101 - - [14/Feb/2022:07:44:02 +0000] "GET /icons/ubuntu-logo.png HTTP/1.1" 404 197 "http://168.119.119.25/" "Mozilla/5.0 (Windows NT 10.0; Win64; x64) AppleWebKit/537.36 (KHTML, like Gecko) Chrome/98.0.4758.87 Safari/537.36"
The tail command prints the last 10 lines from the selected file. The -f
option causes it to continue displaying subsequent lines that are added to the
file in real-time.
To examine the entire contents of an NGINX log file, you can use the cat
command or open it in your text editor:
sudo cat /var/log/nginx/error.log
If you want to filter the lines that contain a specific term, you can use the
grep command as shown below:
sudo grep "GET /favicon.ico" /var/log/nginx/access.log
The command above will print all the lines that contain GET /favicon.ico so we
can see how many requests were made for that resource.
Step 3 — Configuring NGINX access logs
The NGINX access log stores data about incoming client requests to the server
which is beneficial when deciphering what users are doing in the application,
and what resources are being requested. In this section, you will learn how to
configure what data is stored in the access log.
One thing to keep in mind while following through with the instructions below is
that you’ll need to restart the nginx service after modifying the config file
so that the changes can take effect.
sudo systemctl restart nginx
Enabling the access log
The NGINX access Log should be enabled by default. However, if this is not the
case, you can enable it manually in the Nginx configuration file
(/etc/nginx/nginx.conf) using the access_log directive within the http
block.
http {
  access_log /var/log/nginx/access.log;
}
This directive is also applicable in the server and location configuration
blocks for a specific website:
server {
   access_log /var/log/nginx/app1.access.log;

  location /app2 {
    access_log /var/log/nginx/app2.access.log;
  }
}
Disabling the access log
In cases where you’d like to disable the NGINX access log, you can use the
special off value:
You can also disable the access log on a virtual server or specific URIs by
editing its server or location block configuration in the
/etc/nginx/sites-available/ directory:
server {
  listen 80;

  access_log off;

  location ~* .(woff|jpg|jpeg|png|gif|ico|css|js)$ {
    access_log off;
  }
}
Logging to multiple access log files
If you’d like to duplicate the access log entries in separate files, you can do
so by repeating the access_log directive in the main config file or in a
server block as shown below:
access_log /var/log/nginx/access.log;
access_log /var/log/nginx/combined.log;
Don’t forget to restart the nginx service afterward:
sudo systemctl restart nginx
Explanation of the default access log format
The access log entries produced using the default configuration will look like
this:
127.0.0.1 alice Alice [07/May/2021:10:44:53 +0200] "GET / HTTP/1.1" 200 396 "-" "Mozilla/5.0 (Windows NT 10.0; Win64; x64) AppleWebKit/537.36 (KHTML, like Gecko) Chrome/90.0.4531.93 Safari/537.36"
Here’s a breakdown of the log message above:
127.0.0.1: the IP address of the client that made the request.alice: remote log name (name used to log in a user).Alice: remote username (username of logged-in user).[07/May/2021:10:44:53 +0200]: date and time of the request."GET / HTTP/1.1": request method, path and protocol.200: the HTTP response code.396: the size of the response in bytes."-": the IP address of the referrer (-is used when the it is not
available)."Mozilla/5.0 (Windows NT 10.0; Win64; x64) AppleWebKit/537.36 (KHTML, like Gecko) Chrome/90.0.4531.93 Safari/537.36"—
detailed user agent information.
Step 4 — Creating a custom log format
Customizing the format of the entries in the access log can be done using the
log_format directive, and it can be placed in the http, server or
location blocks as needed. Here’s an example of what it could look like:
log_format custom '$remote_addr - $remote_user [$time_local] ' '"$request" $status $body_bytes_sent ' '"$http_referer" "$http_user_agent"';
This yields a log entry in the following format:
217.138.222.109 - - [14/Feb/2022:10:38:35 +0000] "GET /favicon.ico HTTP/1.1" 404 197 "http://192.168.100.1/" "Mozilla/5.0 (Windows NT 10.0; Win64; x64) AppleWebKit/537.36 (KHTML, like Gecko) Chrome/98.0.4758.87 Safari/537.36"
The syntax for configuring an access log format is shown below. First, you need
to specify a nickname for the format that will be used as its identifier, and
then the log format string that represents the details and formatting for each
log message.
log_format <nickname> '<formatting_variables>';
Here’s an explanation of each variable used in the custom log format shown
above:
$remote_addr: the IP address of the client$remote_user: information about the user making the request$time_local: the server’s date and time.$request: actual request details like path, method, and protocol.$status: the response code.$body_bytes_sent: the size of the response in bytes.$http_referer: the IP address of the HTTP referrer.$http_user_agent: detailed user agent information.
You may also use the following variables in your custom log format
(see here for the complete list):
$upstream_connect_time: the time spent establishing a connection with an
upstream server.$upstream_header_time: the time between establishing a connection and
receiving the first byte of the response header from the upstream server.$upstream_response_time: the time between establishing a connection and
receiving the last byte of the response body from the upstream server.$request_time: the total time spent processing a request.$gzip_ratio: ration of gzip compression (if gzip is enabled).
After you create a custom log format, you can apply it to a log file by
providing a second parameter to the access_log directive:
access_log /var/log/nginx/access.log custom;
You can use this feature to log different information in to separate log files.
Create the log formats first:
log_format custom '$remote_addr - $remote_user [$time_local] ' '"$request" $status $body_bytes_sent ' '"$http_referer"';
log_format agent "$http_user_agent";
Then, apply them as shown below:
access_log /var/log/nginx/access.log custom;
access_log /var/log/nginx/agent_access.log agent;
This configuration ensures that user agent information for all incoming requests
are logged into a separate access log file.
Step 5 — Formatting your access logs as JSON
A common way to customize NGINX access logs is to format them as JSON. This is
quite straightforward to achieve by combining the log_format directive with
the escape=json parameter introduced in Nginx 1.11.8 to escape characters that
are not valid in JSON:
log_format custom_json escape=json
  '{'
    '"time_local":"$time_local",'
    '"remote_addr":"$remote_addr",'
    '"remote_user":"$remote_user",'
    '"request":"$request",'
    '"status": "$status",'
    '"body_bytes_sent":"$body_bytes_sent",'
    '"request_time":"$request_time",'
    '"http_referrer":"$http_referer",'
    '"http_user_agent":"$http_user_agent"'
  '}';
After applying the custom_json format to a log file and restarting the nginx
service, you will observe log entries in the following format:
{
  "time_local": "14/Feb/2022:11:25:44 +0000",
  "remote_addr": "217.138.222.109",
  "remote_user": "",
  "request": "GET /icons/ubuntu-logo.png HTTP/1.1",
  "status": "404",
  "body_bytes_sent": "197",
  "request_time": "0.000",
  "http_referrer": "http://192.168.100.1/",
  "http_user_agent": "Mozilla/5.0 (Windows NT 10.0; Win64; x64) AppleWebKit/537.36 (KHTML, like Gecko) Chrome/98.0.4758.87 Safari/537.36"
}
Step 6 — Configuring NGINX error logs
Whenever NGINX encounters an error, it stores the event data in the error log so
that it can be referred to later by a system administrator. This section will
describe how to enable and customize the error logs as you see fit.
Enabling the error log
The NGINX error log should be enabled by default. However, if this is not the
case, you can enable it manually in the relevant NGINX configuration file
(either at the http, server, or location levels) using the error_log
directive.
error_log /var/log/nginx/error.log;
The error_log directive can take two parameters. The first one is the location
of the log file (as shown above), while the second one is optional and sets the
severity level of the log. Events with a lower severity level than set one will
not be logged.
error_log /var/log/nginx/error.log info;
These are the possible levels of severity (from lowest to highest) and their
meaning:
debug: messages used for debugging.info: informational messages.notice: a notable event occurred.warn: something unexpected happened.error: something failed.crit: critical conditions.alert: errors that require immediate action.emerg: the system is unusable.
Disabling the error log
The NGINX error log can be disabled by setting the error_log directive to
off or by redirecting it to /dev/null:
error_log off;
error_log /dev/null;
Logging errors into multiple files
As is the case with access logs, you can log errors into multiple files, and you
can use different severity levels too:
error_log /var/log/nginx/error.log info;
error_log /var/log/nginx/emerg_error.log emerg;
This configuration will log every event except those at the debug level event
to the error.log file, while emergency events are placed in a separate
emerg_error.log file.
Step 7 — Sending NGINX logs to Syslog
Apart from logging to a file, it’s also possible to set up NGINX to transport
its logs to the syslog service especially if you’re already using it for other
system logs. Logging to syslog is done by specifying the syslog: prefix to
either the access_log or error_log directive:
error_log  syslog:server=unix:/var/log/nginx.sock debug;
access_log syslog:server=[127.0.0.1]:1234,facility=local7,tag=nginx,severity=info;
Log messages are sent to a server which can be specified in terms of a domain
name, IPv4 or IPv6 address or a UNIX-domain socket path.
In the example above, error log messages are sent to a UNIX domain socket at the
debug logging level, while the access log is written to a syslog server with
an IPv4 address and port 1234. The facility= parameter specifies the type of
program that is logging the message, the tag= parameter applies a custom tag
to syslog messages, and the severity= parameter sets the severity level of
the syslog entry for access log messages.
For more information on using Syslog to manage your logs, you can check out our
tutorial on viewing and configuring system logs on
Linux.
Step 8 — Centralizing your NGINX logs
In this section, we’ll describe how you can centralize your NGINX logs in a log
management service through Vector, a
high-performance tool for building observability pipelines. This is a crucial
step when administrating multiple servers so that you can monitor all your logs
in one place (you can also centralize your logs with an Rsyslog
server).
The following instructions assume that you’ve signed up for a free
Logtail account and retrieved your source
token. Go ahead and follow the relevant
installation instructions for Vector
for your operating system. For example, on Ubuntu, you may run the following
commands to install the Vector CLI:
curl -1sLf  'https://repositories.timber.io/public/vector/cfg/setup/bash.deb.sh'  | sudo -E bash
$ sudo apt install vector
After Vector is installed, confirm that it is up and running through
systemctl:
You should observe that it is active and running:
● vector.service - Vector
     Loaded: loaded (/lib/systemd/system/vector.service; enabled; vendor preset: enabled)
     Active: active (running) since Tue 2022-02-08 10:52:59 UTC; 48s ago
       Docs: https://vector.dev
    Process: 18586 ExecStartPre=/usr/bin/vector validate (code=exited, status=0/SUCCESS)
   Main PID: 18599 (vector)
      Tasks: 3 (limit: 2275)
     Memory: 6.8M
     CGroup: /system.slice/vector.service
             └─18599 /usr/bin/vector
Otherwise, go ahead and start it with the command below.
sudo systemctl start vector
Afterward, change into a root shell and append your Logtail vector configuration
for NGINX into the /etc/vector/vector.toml file using the command below. Don’t
forget to replace the <your_logtail_source_token> placeholder below with your
source token.
sudo -s
$ wget -O ->> /etc/vector/vector.toml
    https://logtail.com/vector-toml/nginx/<your_logtail_source_token>
Then restart the vector service:
sudo systemctl restart vector
You will observe that your NGINX logs will start coming through in Logtail:
Conclusion
In this tutorial, you learned about the different types of logs that the NGINX
web server keeps, where you can find them, how to understand their formatting.
We also discussed how to create your own custom log formats (including a
structured JSON format), and how to log into multiple files at once. Finally, we
demonstrated the process of sending your logs to Syslog or a log management
service so that you can monitor them all in one place.
Thanks for reading, and happy logging!
Centralize all your logs into one place.
Analyze, correlate and filter logs with SQL.
Create actionable
dashboards.
Share and comment with built-in collaboration.
Got an article suggestion?
Let us know
![]()
![]()
![]()
Next article
How to Get Started with Logging in Node.js
Learn how to start logging with Node.js and go from basics to best practices in no time.
→
![]()
This work is licensed under a Creative Commons Attribution-NonCommercial-ShareAlike 4.0 International License.