|
This article or section needs to be updated. Some information on it may be out of date, and should not be relied on. Please improve this article if you can. |
The Error Cluster is a predefined LabVIEW Cluster that is used to contain error status information. The cluster contains the following three components:
| Name | Data Type | Description |
|---|---|---|
| Status | Boolean | Indicates if an error has occurred (TRUE = error, FALSE = no error). |
| Code | 32-Bit signed integer | A standardized error code specific to the particular error. LabVIEW has a table of default error codes, although the user is able to define custom error codes. See below for more information. |
| Source | String | Textual information often describing the error and the VI it occurred within. |
An error cluster contains a Boolean “status”, an I32 numerical “code” and a “source” string in that order. Any cluster with this structure is treated as an error cluster in LabVIEW. The default value, “status” = false, “code” = 0 and “source” empty, is shown in Figure 1 for a typical control.
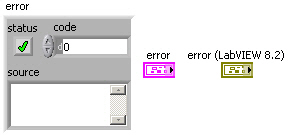
Figure 1: 3D error cluster control and terminal
Note that the default terminal and wire color was changed from pink to dark yellow in LabVIEW 8.2 (upgrade notes p. 35). The “status” is true if an error has occurred but remains false for warnings. The “code” assumes positive and negative values (see “error codes, ranges of” in LabVIEW Help).
Contents
- 1 Custom Error Codes
- 2 General Error Handling
- 2.1 Error Comparison
- 2.2 Error Selection
- 3 Error Cluster as Execution Order Specifier
- 4 Tips and tricks
- 5 See also
Custom Error Codes
The following ranges are reserved for developers to define their own error codes (see Custom Error Code):
- 5000 to 9999
- -8999 to -8000
- 500000 to 599999
Use Tools >> Advanced >> Edit Error Codes to create text files to define your own errors.
The “source” identifies a VI and possibly its call chain as the origin of an error. Possible reasons for an error can be obtained from the Explain Error tool (see Figure 2). This tool is activated by selecting the Explain Error… item under the Help menu in LabVIEW or by right-clicking on any element of an error cluster with “status” true and selecting Explain Error.
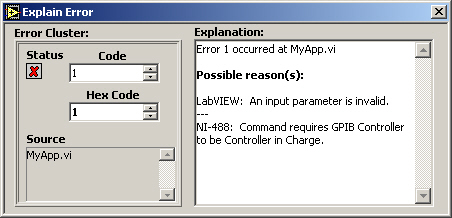
Figure 2: Explain Error tool
General Error Handling
LabVIEW provides several VIs for working with error clusters. For example, the Error Cluster from Error Code.vi generates an error cluster based on a specified “code” (see Figure 3). You can also define custom codes using the General Error Handler.vi or by creating an XML-based text file in the <labview\user.lib\ errors> directory (see “error codes, defining custom” and “error codes, defining custom in text files” in LabVIEW Help). This VI outputs a “message”, like the “Explanation” from Explain Error, which identifies the “source” and describes possible causes associated with the “code”. This information can also be displayed using several different types of dialogs. This feature is commonly employed to identify errors in user interface applications.
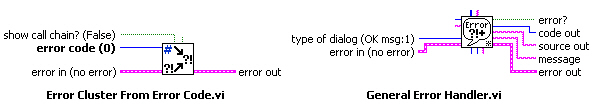
Figure 3: connectors for Error Cluster from Error Code.vi and General Error Handler.vi
Error Comparison
Error clusters are also valid inputs to some comparison and array functions and can be used to control case structures and while loops (see Figure 4).
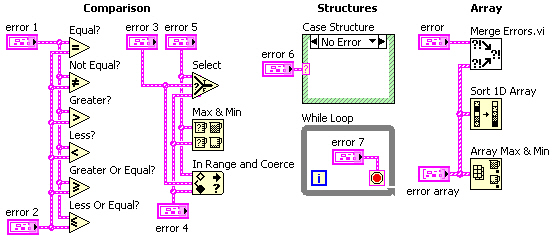
Figure 4: structures, comparison and array functions involving error cluster inputs
The comparison functions Equal?, Not Equal?, Greater?, Less?, Greater Or Equal? and Less Or Equal? can operate in two modes. The output is Boolean in the Compare Aggregates mode, while a cluster of three Booleans corresponding to each component of the error cluster is generated in the Compare Elements mode (see Figure 5).
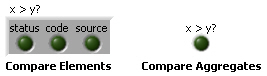
Figure 5: typical indicators for both modes of a comparison function
The Select, Max & Min and In Range and Coerce functions can output an error cluster. While the Max & Min function returns ordered inputs in the Compare Aggregates mode, an output may not correspond to either error cluster if Compare Elements is selected (default). The Array Max & Min function always returns ordered inputs corresponding to the first and last elements of the Sort 1D Array output. The primary sort is performed on “status”, with secondary ordering by “code” and then “source”. Strings are sorted by ASCII code starting with the leading character. Note that error clusters behave like their Boolean “status” value when connected to the selector terminal of a Select function and Case Structure or the conditional terminal of a While Loop.
Error Selection
A common programming issue in LabVIEW involves selecting between two or more error clusters. This process involves finding the cluster with “status” true or “code” not equal zero if no “status” is true. The Merge Errors.vi shown in Figure 4 implements this search for up to three error clusters and an array of such clusters. This subVI is relatively fast with large error arrays. However, a significant portion of the execution time involves concatenation of inputs for the small arrays (<10 elements) typical in most applications. This result suggests that time critical applications should be built around the immediate selection between two error clusters rather than their concatenation into an array. The simplest method of comparing the “status” of two error clusters involves the Select function (see Figure 6).
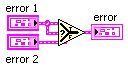
Figure 6: diagram for a simple error selector that does not detect warnings
This function selects the first error cluster with “status” true, much like the Or function operating on Boolean inputs. Connecting “error 2” instead of “error 1” to the selector terminal is more analogous to the And function, which is typically less useful. While about 30 times faster than the Merge Errors.vi (LabVIEW 7.0), the Select function does not detect a warning (“status” false and “code” not equal zero).
Diagrams for several VIs that compare error clusters and detect warnings are shown below (fastest to slowest).
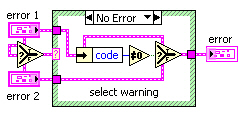
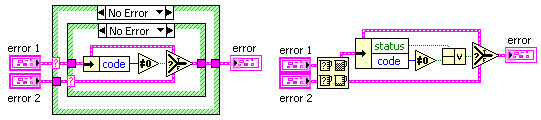
Figure 7: possible diagrams for an error selector that detects warnings
These VIs execute about 5 times faster than the Merge Errors.vi (LabVIEW 7.0), even with normal priority execution. (Merge Errors.vi uses the “subroutine” priority.) Inputs to selector terminals in the first and second diagrams are passed to “error” for the cases not shown. Otherwise, “error 1” is checked for nonzero “code” since neither cluster has “status” true. The last approach uses the Max & Min function in Compare Aggregates mode to order inputs. If just one of these clusters has “status” true, that input will be the “max” output since true > false. However, this output must be checked for “status” true or “code” nonzero to determine selection.
Error Cluster as Execution Order Specifier
LabVIEW is a dataflow language and as such preferred way to specify execution order of block diagram items is to connect output of a block diagram item to an input of another block diagram item. There are situations when some certain execution order is required but the outputs of the items to be executed earlier cannot be connected to the inputs of the items to be executed later. In these situations error cluster is a preferred way to specify the execution order of the items. It’s preferred over sequence structures in almost all use cases.
This can easily be achieved by a private replacement for the ‘merge errors’ node, that also contains a ‘No_Error’ constant:
 The connector pane looks like this:
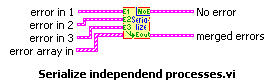
It can be used like this:
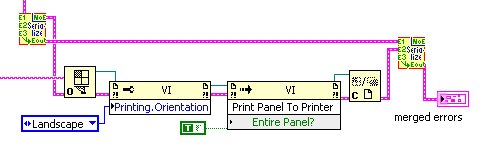
So a VI-Ref is opened independently if an error occured before, but after all preliminary portions of code had been finished. The printing actions relate to the eventual error of the OpenVI-Ref node only. All errors are merged as final action, so any error that might have shown up is reported, while the printing actions care only on VI-server related errors.
This little helper is too simple to provide its code as VI, though…
Tips and tricks
- Right-click the status button inside an error cluster on the front panel and select Explain Error to open the Explain Error dialog.
See also
- Error handling
- Error Case Structure

Урок 5 Отладка ВП
Как бы вы ни были уверены в создаваемом ВП, невозможно предусмотреть все проблемы, с которыми может столкнуться пользователь. Без механизма определения ошибок будет понятно только то, что ВП работает неправильно. Проверка на наличие ошибок позволит узнать, где именно и почему произошла ошибка.
Автоматическая обработка ошибок
Каждой ошибке соответствует числовой код и текстовое сообщение.
По умолчанию LabVIEW обрабатывает все ошибки, произошедшие во время выполнения ВП, следующим образом: ВП переводится в состояние ожидания, подВП или функция, где произошла ошибка, подсвечивается, а на экран выводится диалог ошибки.
Чтобы запретить автоматическую обработку ошибок для текущего ВП, выберите пункт меню File>>VI Properties, а затем Execution в
раскрывающемся меню Category. Чтобы запретить автоматическую обработку для всех вновь создаваемых ВП, выберите
Tools>>Options, а затем Block Diagram в списке Category. Чтобы запретить автоматическую обработку ошибок для подВП или функции, соедините выход error out с входом error in другого подВП или функции, либо с индикатором error out.
Ручная обработка ошибок
Можно выбирать другие методы обработки ошибок. Например, если для ВП ввода-вывода истекло время ожидания, не всегда нужно останавливать приложение и выводить диалог ошибки. Возможно, вы захотите, чтобы ВП повторял попытки в течение некоторого времени. Решения, связанные с обработкой ошибок, можно принимать на блок-диаграмме ВП.
Для управления ошибками предназначены ВП и функции обработки ошибок на палитре Dialog & User Interface, а также параметры error in и error out, присутствующие у большинства ВП и функций. Например, можно выводить сообщение об ошибке в диалогах различных видов. Используйте обработку ошибок совместно с инструментами отладки, чтобы эффективно находить и устранять ошибки в программе.
ВП и функции сообщают об ошибках либо при помощи числового кода, либо при помощи кластера ошибки. Как правило, числовые коды используются в функциях, а кластеры — в ВП, которые имеют для этого специальные входы и выходы.
При любых операциях ввода-вывода следует учитывать возможность ошибки. Почти все функции ввода-вывода возвращают информацию об ошибках. Наличие ошибок особенно важно проверять при работе с файлами, внешними приборами, устройствами сбора данных и при организации связи между компьютерами. Помимо проверки, следует реализовать механизм, адекватно обрабатывающий ошибки.
|
©National Instruments Corporation |
5-12 |
Учебный курс LabVIEW Основы I |
Урок 5 Отладка ВП
Обработкой ошибок можно управлять при помощи встроенных ВП, функций и параметров. Например, если LabVIEW обнаружит ошибку, вы можете сообщить о ней в окне диалога. Можно устранить ошибку программным способом, а затем удалить информацию о ней, соединив выход error out с входом error in ВП
Clear Errors. Компания National Instruments настоятельно рекомендует использовать обработку ошибок.
Кластеры ошибок
Элементы управления и индикаторы, представляющие кластеры ошибок, используются для передачи информации об ошибках между подВП.
Кластеры error in и error out содержат следующую информацию:
•status — логическое значение, в случае ошибки равно TRUE.
•code — 32-битовое знаковое целое, идентифицирующее ошибку. Ненулевой код и status = FALSE означают предупреждение.
•source — строка, идентифицирующая источник ошибки.
Обработка ошибок в LabVIEW соответствует модели потока данных. Информация об ошибках распространяется по ВП аналогично другим данным. Передавайте информацию об ошибках от начала до конца ВП, а в самом конце установите обработчик ошибок, чтобы определить, было ли выполнение безошибочным. Для передачи информации об ошибках используйте кластеры error in и error out. Их следует включать и в те ВП, которые вы строите самостоятельно.
Перед выполнением каждого узла блок-диаграммы LabVIEW проверяет наличие ошибок на его входе. Если ошибок нет, узел выполняется в нормальном режиме. Если ошибка обнаружена, она передается следующему узлу без выполнения текущей части кода. Следующий узел делает то же самое, и т. д. В конце потока выполнения LabVIEW сообщает об ошибке.
Объяснение ошибок
При возникновении ошибки щелкните правой кнопкой внутри кластера и выберите пункт Explain Error контекстного меню, чтобы открыть соответствующий диалог. Диалог Explain Error содержит информацию об ошибке. Если ошибок нет, но есть предупреждения, контекстное меню будет содержать пункт Explain Warning.
Диалог Explain Error также можно вызвать через пункт меню
Help>>Explain Error.
ВП и функции сообщают об ошибках либо при помощи числового кода, либо при помощи кластера ошибки. Как правило, числовые коды используются в функциях, а кластеры — в ВП, которые имеют для этого специальные входы и выходы.
Обработка ошибок при помощи структуры Case
В приведенном ниже примере кластер ошибки используется для выбора вариантов в структуре Case.
|
©National Instruments Corporation |
5-13 |
Учебный курс LabVIEW Основы I |

Урок 5 Отладка ВП
Рис. 5-3. Вариант No Error.
Рис. 5-4. Вариант Error.
При соединении кластера ошибки с терминалом селектора структуры Case, метка селектора автоматически показывает два варианта — Error и No Error, а рамка структуры меняет цвет на красный для варианта Error и зеленый для варианта No Error. При возникновении ошибки выполняется поддиаграмма Error.
Если с терминалом селектора соединен кластер ошибки, структура Case реагирует только на логический параметр status.
Обработка ошибок при помощи цикла While
Кластер ошибки можно соединить с терминалом условия цикла While. При этом на терминал передается только значение логического параметра status. Когда возникает ошибка, цикл останавливается.
Когда с терминалом условия соединен кластер ошибки, пункты контекстного меню Stop if True и Continue if True меняются на
Stop on Error и Continue while Error.
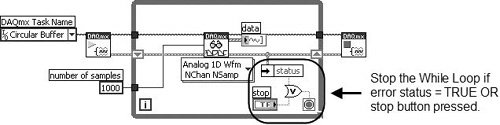
На рис. 5-5 кластер ошибки и кнопка останова совместно определяют условие выхода из цикла. Большинство циклов рекомендуется останавливать именно таким способом.
|
©National Instruments Corporation |
5-14 |
Учебный курс LabVIEW Основы I |
![]()
Урок 5 Отладка ВП
Рис. 5-5. Останов цикла While.
|
©National Instruments Corporation |
5-15 |
Учебный курс LabVIEW Основы I |
Загрузка конфигурации в ПЛИС через USB или разбираем FTDI MPSSE
Пишем загрузчик ПЛИС в LabVIEW. Часть 1
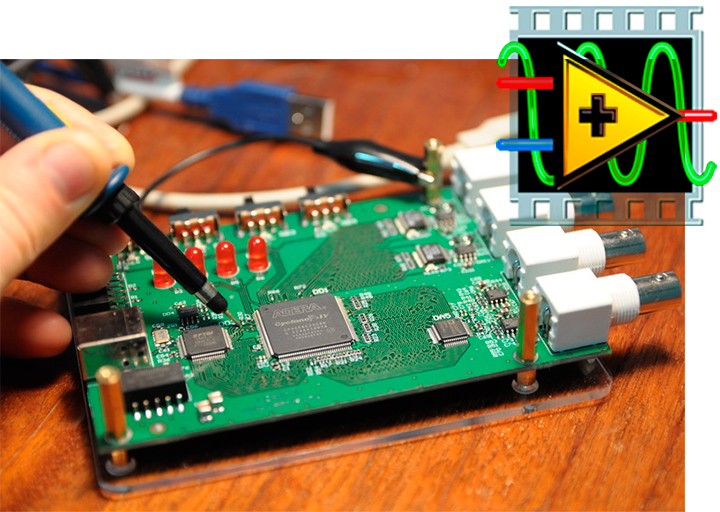
В первой статье мы обкатали алгоритм загрузки на старом добром Си, во второй статье разобрались, как в LabVIEW можно организовать программу и реализовать простой интерфейс пользователя. В этот раз мы познакомимся с новыми приемами работы в LabVIEW, разберем особенности обработки ошибок и завершим проект: реализуем протокол загрузки файла конфигурации в ПЛИС.
Обработка ошибок
Открываем сишный исходник, анализируем функцию MPSSE_open. Несмотря на алгоритмическую простоту (функции вызываются друг за дружкой) требуется импортировать довольно много элементов API D2XX: FT_OpenEx, FT_ResetDevice, FT_Purge, FT_SetUSBParameters, FT_SetChars, FT_SetTimeouts, FT_SetLatencyTimer, FT_SetFlowControl, FT_SetBitMode. Как было показано в предыдущей статье, импорт функций осуществляется с помощью узла Call library Function. Этот узел имеет выделенные терминалы для контроля ошибок. В LabVIEW есть одно простое правило: все ВП должны отслеживать ошибки и сообщать об ошибках, возвращаемых терминалами ошибок. Большинство встроенных ВП неукоснительно следует ему. Надеюсь всем понятно, насколько важно контролировать и обрабатывать ошибки особенно на этапе отладки, однако есть еще одна причина, почему это так важно, неочевидная «классическим» программистам. В LabVIEW нет строгой последовательности выполнения приборов на блок-диаграмме: прибор выполняется, когда на его входах будут готовы данные. Если с выхода одного ВП данные передаются на вход другого ВП, то понятно, что в начале отработает первый ВП, только после него второй. А как быть, если нет передачи данных, а ВП выполняют независимые действия? Конечно можно воспользоваться громоздкой «Flat Sequence Structure», но гораздо удобнее соединить приборы между собой потоком ошибок.
При импорте функций D2XX мы сталкиваемся с двумя типами ошибок. Первый — это ошибка непосредственно импорта — возвращает сам блок Call library Function. Второй — ошибка самой библиотеки, возвращается почти каждой функцией через FT_STATUS. Все возможные значения описаны в виде enum’а в заголовочном файле ftd2xx.h. Хотя достаточно знать, что значение FT_OK — отсутствие ошибки, а все остальные значения — коды ошибок, хотелось бы отследить не только сам факт ошибки, но и какая ошибка произошла и где именно она произошла.
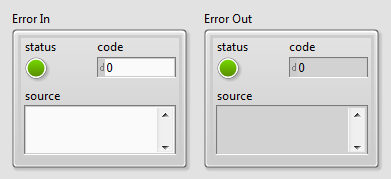
В LabVIEW данные об ошибке распространяются через кластеры error. Это такой специальный выделенный тип данных, в LabVIEW есть множество ВП и функций для работы с ним. Кластер ошибок состоит из трех элементов: логическая переменная — отображает статус, целое знаковое число — код ошибки, строка — источник ошибки. Статус показывает, произошла ли ошибка, код ошибки определяет ее тип и используется специальными ВП для формирования отчета. Строка дает более развернутое представление о том, где именно произошла ошибка. В LabVIEW принято, если статус равен TRUE, то это ошибка, если статус равен FALSE, но код не равен нулю и строка описания не пустая, то это предупреждение, если же статус FALSE, код равен нулю и строка пустая — нет ошибки.
LabVIEW содержит внутреннюю базу данных, в которой код каждой ошибки связан с ее описанием. Для каждого типа ошибок выделен специальный диапазон значений кодов. Например, для ошибок связанных с работой сети выделено несколько диапазонов: от –2147467263 до –1967390460, от 61 до 65, от 116 до 118 и 122, 1101, 1114, 1115, 1132 до 1134, от 1139 до 1143 и от 1178 до 1185. Для ошибок, определяемых пользователем зарезервировано два диапазона от –8999 до –8000 и от 5000 до 9999. Из этих диапазонов мы можем выбрать значения для кодов ошибок библиотеки D2XX.
Создадим ВП, принимающий на вход статус функции D2XX и конвертирующий этот статус в кластер ошибки LabVIEW. Большинство функций и ВП в LabVIEW, получив на вход Error In статус TRUE, не выполняют свой код, а передают информацию об ошибке на терминал Error Out. Это позволяет эффективно передать информацию о источнике через всю цепочку до обработчика ошибок, исключив выполнение кода в аварийном режиме. Желательно, чтобы и наши ВП вели себя аналогично.
Оформим список статусов D2XX в виде enum и вынесем его в отдельный тип (в предыдущей статье мы так поступили с типами FTDI).
enum FT_Status
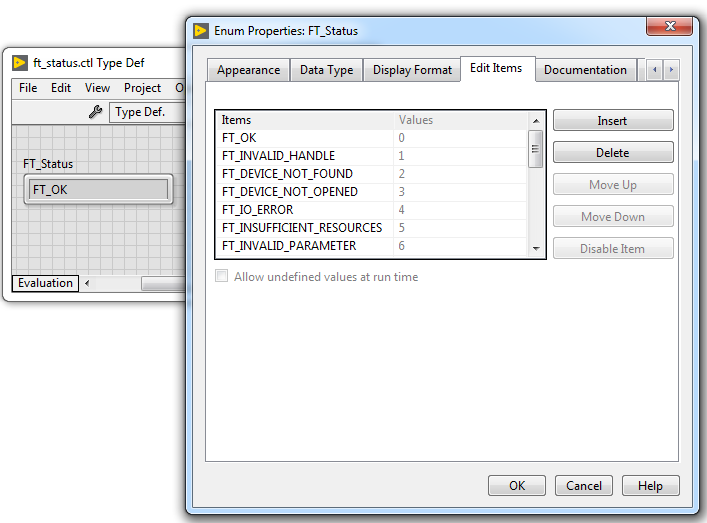
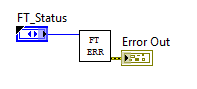
Новый ВП сохраняем под именем FT_error.vi. На переднюю панель добавляем два кластера Error In и Error Out, найти их можно в палитре «Array, Matrix & Cluster». Подсоединяем их к терминалам на панели соединений в нижнем левом и нижнем правом углах соответственно, как уже говорилось в прошлой статье, это принятое в LabVIEW расположение терминалов потока ошибок. На блок-диаграмму добавляем структуру Case, на вход Case selector подаем кластер Error In, после чего структура Case меняет цвет и делиться две поддиаграммы: «No Error» — зеленый цвет, и «Error» — красный цвет. Внутри случая Error передаем кластер ошибок от терминала селектора напрямую к выходному туннелю на правой границе. А в зеленом случае добавляем еще один Case, он в зависимости от статуса будет определять, следует ли создавать ошибку (статус не равен FT_OK), или оставить все как есть: пропустить входной кластер ошибки на выход без изменения.
Для того, чтобы технично преобразовать код ошибки в кластер, можно использовать ВП Error Cluster From Error Code VI. Этот SubVI в описание ошибки добавляет цепочку вызова, благодаря чему мы сможем определить не только что произошло, но еще и где это случилось.
Чтобы выделить текст, соответствующий входному статусу (FT_Status), используем блок свойств: выбираем «RingText.Text». Текст ошибки передаем на вход error message ВП Error Cluster From Error Code VI.
Не забываем нарисовать «говорящую» иконку.
FT_error.vi
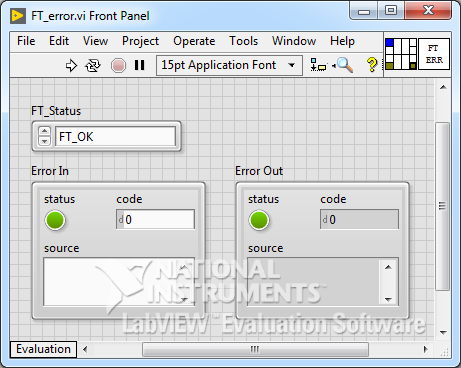
Передняя (фронт) панель подприбора
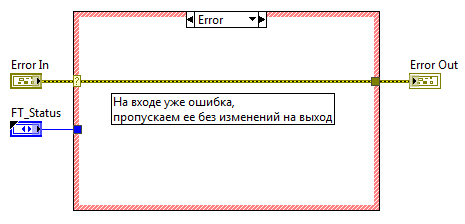
Блок-диаграмма. На входе ошибка
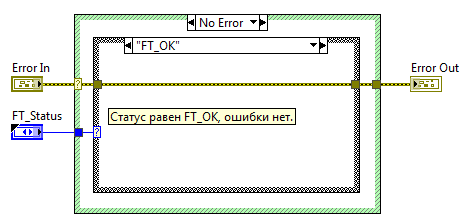
Блок-диаграмма. На входе нет ошибки и статус равен FT_OK
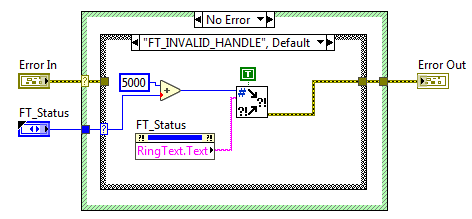
Блок-диаграмма. На входе нет ошибки, но статус отличен от FT_OK
Для испытания FT_error можно создать пустой ВП, добавить туда созданный ВП и посмотреть, как будет меняться значение при запуске, если подавать различные статусы.
Тест FT_error.vi
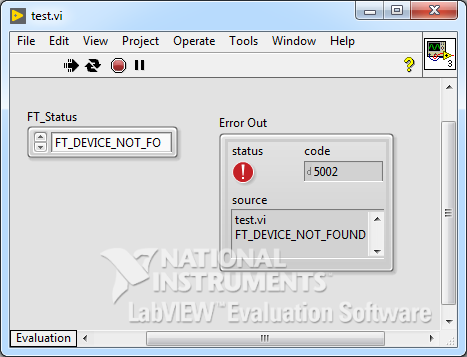
Передняя (фронт) панель прибора
Блок-диаграмма
Теперь, после любого вызова функции из API D2XX, мы будем использовать SubVI FT_error.vi. А кластер ошибок будет проходить через все ВП по всей иерархии вызова.
В ВП верхнего уровня мы должны определиться, что делать с обнаруженной ошибкой: можно вывести сообщение в диалоговом окне, записать его в файл отчета, проигнорировать или просто «тихо» завершить приложение. Диалоговое окно — самый простой и наиболее популярный способ отчета об ошибках. А еще он удобен для начинающего программиста, так как делать ничего не надо. В каждом ВП по умолчанию активирован режим автоматической обработки ошибок (Enable automatic error handling, находится в категории Execution меню ВП Properties). Работает он так: если в каком-то узле выходной терминал Error Out никуда не подключен, и в этом узле происходит ошибка, то LabVIEW приостанавливает выполнение приложения и выдает диалоговое окно. Если терминал Error Out узла соединен, то поток ошибки распространяется, как запрограммировано, и никаких дополнительных действий не происходит. Однако окно сообщения можно вызвать программно, для этого нужно воспользоваться ВП General Error Handler и Simple Error Handler (находятся в палитре «Dialog&User Interface»). При этом информацию об ошибке мы можем использовать для завершения программы. На блок-диаграмме это выглядит примерно так:
Картинка кликабельная
Когда произойдет ошибка, программа будет приостановлена, появится окно с отчетом, после закрытия окна программа корректно завершиться.
Окно отчета

Открыть и закрыть FTDI
Итак, возвращаемся к функции MPSSE_open. Создаем новый VI. Первым делом, добавляем терминалы для потока ошибок. Добавляем структуру выбора и на селектор подаем вход Error In. В зеленом кейсе делаем импорт функций в порядке и с параметрами как в Сишном прототипе. Все узлы Call Library Function Node соединяем в цепочку потоком ошибок. В красном кейсе через тунель соединяем Error In с выходным терминалом ошибки.
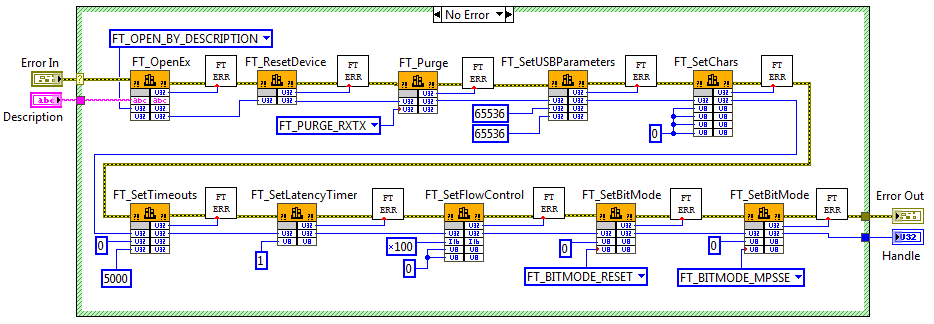
Картинка кликабельная
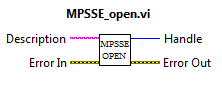
ВП MPSSE_open.vi
На вход SubVI подается строка с описанием FTDI (Description), на выходе — Handle и инициализированный чип FTDI в режиме MPSSE.
Создадим ВП, завершающий работу с FTDI и можно уже проверить работоспособность на железе.
FT_Close.vi
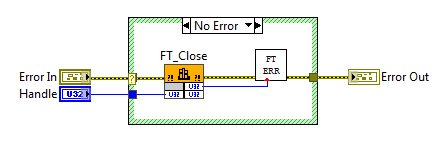
Блок-диаграмма
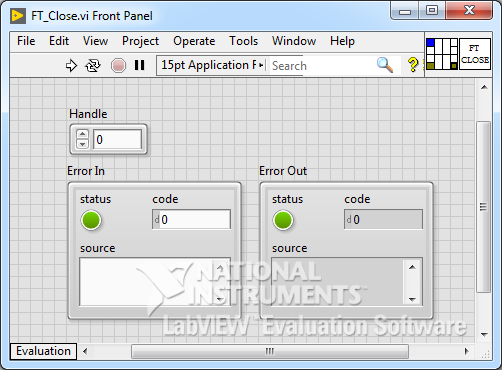
Передняя панель
В предыдущей статье для отладки интерфейса мы сделали ВП заглушку SP_FT_MPSSE_FPGA.vi, сейчас настало время наполнить его. Добавляем на его блок-диаграмму MPSSE_open.vi и FT_Close.vi. На данном этапе достаточно сложно оценить, верно ли прошла инициализация, однако ненулевое значение Handle на выходе MPSSE_open.vi и отсутствие ошибки нам уже о многом скажет.
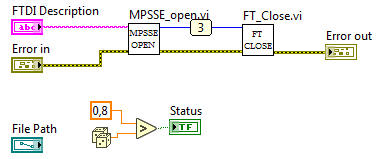
Блок-диаграмма SP_FT_MPSSE_FPGA.vi
Для того, чтобы посмотреть значение Handle можно воспользоваться окном «Probe Watch Window». Это удобный инструмент отладки, позволяющий вывести значение данных на любом (почти любом) проводе в процессе выполнения прибора. Для того чтобы установить пробу на линию, нужно в контекстном меню этой самой линии выбрать пункт «Probe». Откроется окно «Probe Watch Window», а на линии появится циферка с номером пробы. На рисунке выше это «3».
Probe Watch Window
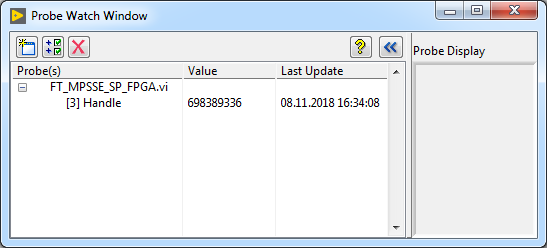
На линии Handle значение 698389336
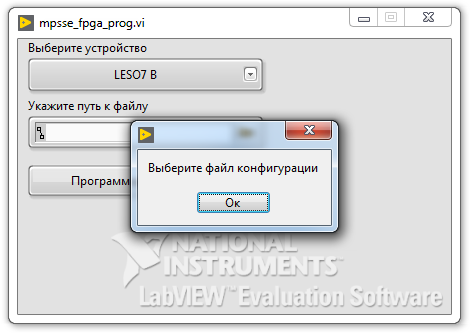
Отлично! Запускаем ВП верхнего уровня, подключаем к компьютеру отладочную плату. В списке «Выберите устройство» появляется описание подключенной микросхемы FTDI, нажимаем кнопку «Программировать» и… ничего не происходит. Только в окне «Probe Watch» появилось значение Handle. И это хорошо.
Отключаем плату, список устройств очищается. Нажимаем «Программировать». Вот тут-то выскакивает окно с отчетом об ошибке.
Окно отчета
После нажатия кнопки «Continue», ВП завершает свою работу.
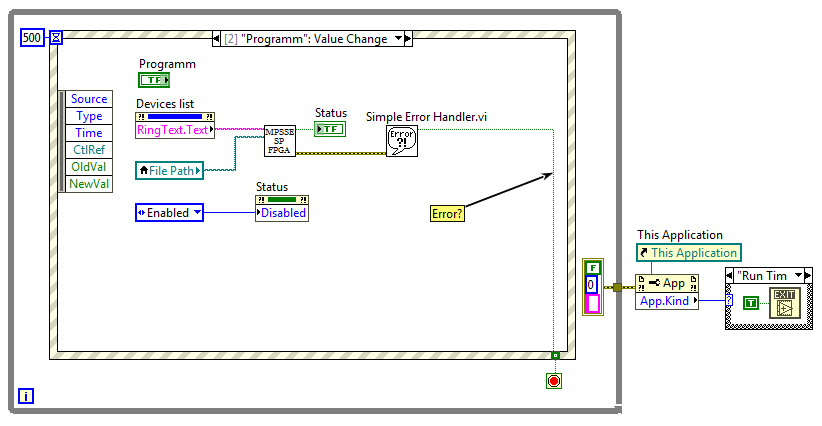
Стоит запретить нажимать кнопку, если не найдено ни одного устройства. Модифицируем кейс «Timeout» обработчика событий. Напомню, два раза в секунду сканируются подключенные к ПК чипы FTDI, если таковые обнаружены и могут быть использованы для программирования ПЛИС, то через свойство Strings[] их дескрипторы добавляются в Devices list. Создаем для «Программировать» свойство Disabled, и, если годных устройств не обнаружено, то отключаем и затемняем кнопку.
Case Timeout
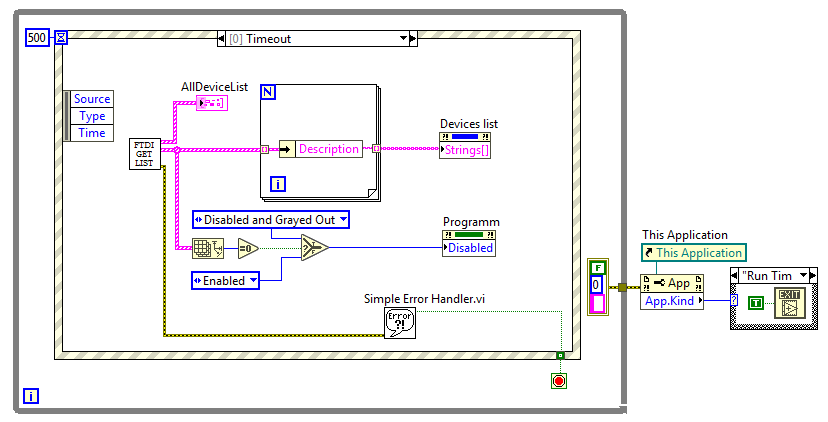
Картинка кликабельна
Осваиваем GPIO
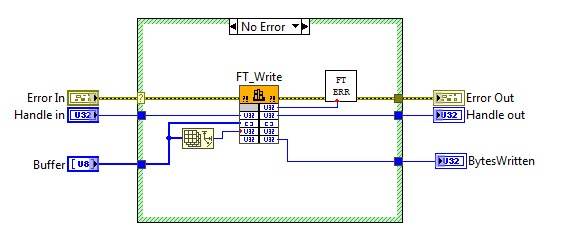
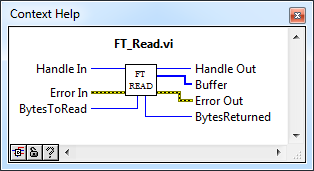
После того, как MPSSE активирован, работа с ним осуществляется через так называемые «op-code», а из функций API D2XX используется только FT_Write, FT_Read и FT_Queue (чтобы узнать статус буфера приемника). По наторенной дорожке создаем соответствующие VI: FT_Write.vi, FT_Read.vi, FT_Queue.vi.
Немного рутины
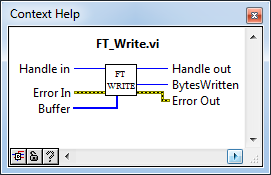
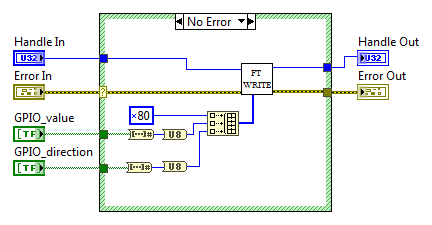
FT_Write.vi
Блок-диаграмма. FT_Write.vi
FT_Read.vi

Блок-диаграмма. FT_Read.vi
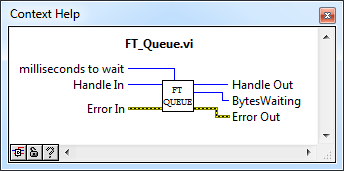
FT_Queue.vi
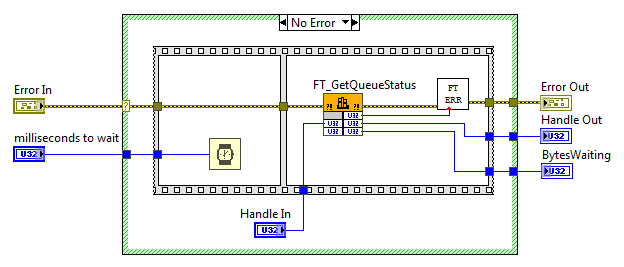
Блок-диаграмма. FT_Queue.vi
Теперь из этих трех кирпичиков выкладываем ВП для чтения параллельного порта и записи в него. Значение удобно представить в виде массива булевых переменных.
MPSSE_Set_LByte.vi и MPSSE_Get_LByte.vi

MPSSE_Set_LByte.vi
Блок-диаграмма. MPSSE_Set_LByte.vi
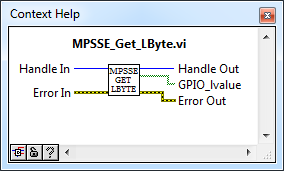
MPSSE_Get_LByte.vi
Блок-диаграмма. MPSSE_Get_LByte.vi
Каюсь, мне было лениво создавать именованный список для всех op-code, поэтому оставил их в виде Magic Numbers.
Как говорилось в самой первой статье протокол загрузки ПЛИС «Passive Serial» есть ничто иное как SPI с дополнительной манипуляцией флагами. Всего используется пять ножек: линии DCLK, DATA[0], nCONFIG должны быть сконфигурированы как выхода, линии nSTATUS, CONF_DONE — как входы.
Распиновка схемы в виде таблицы
| FPGA pin | Pin Name | Pin | MPSSE | Direction | default |
|---|---|---|---|---|---|
| DCLK | BDBUS0 | 38 | TCK/SK | Out | 0 |
| DATA[0] | BDBUS1 | 39 | TDI/DO | Out | 1 |
| nCONFIG | BDBUS2 | 40 | TDO/DI | Out | 1 |
| nSTATUS | BDBUS3 | 41 | TMS/CS | In | 1 |
| CONF_DONE | BDBUS4 | 43 | GPIOL0 | In | 1 |
Нам понадобится ВП, который сможет менять значение на выбранной ножке не затрагивая все остальные. Первым делом создаем Enum с порядковыми номерами ножек в порту, сохраняем в виде «Strict Type Def» в файл SP_LBYTE_BITS.ctl. Создаем новый ВП, добавляем привычные терминалы потока ошибок. Считываем текущее значение параллельного порта с помощью MPSSE_Get_LByte.vi, с помощью функции Replace Array Subset модифицируем нужный бит и записываем значение обратно в порт (MPSSE_Set_LByte.vi).
SP_Set_Flag.vi
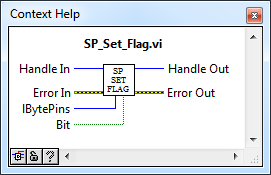
SP_Set_Flag.vi

Блок-диаграмма. SP_Set_Flag.vi
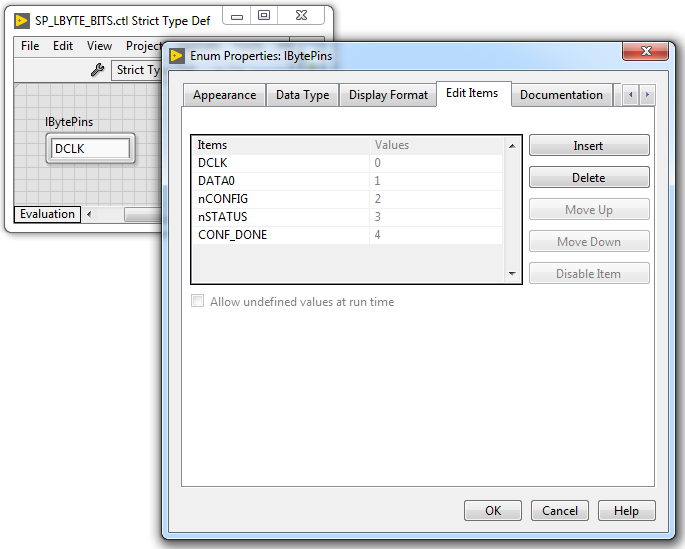
Enum SP_LBYTE_BITS.ctl
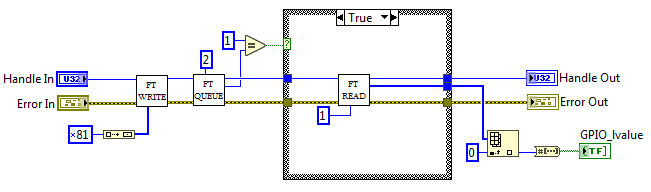
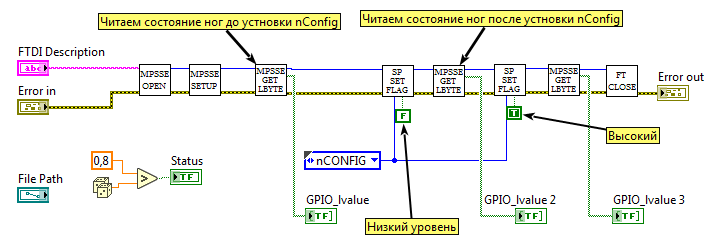
Для начала конфигурации контроллер MPSSE должен генерировать переход из низкого уровня в высокий на линии nCONFIG. Как только ПЛИС будет готова к приему данных, она сформирует высокий уровень на линии nSTATUS. На данном этапе у нас все готово для эксперимента в железе. На блок-диаграмму SP_FT_MPSSE_FPGA.v добавляем управление линией nCONFIG — после инициализации MPSSE подаем низкий уровень, а затем высокий. После каждой операции (для отладки) считываем состояние ножек порта.
SP_FT_MPSSE_FPGA.vi
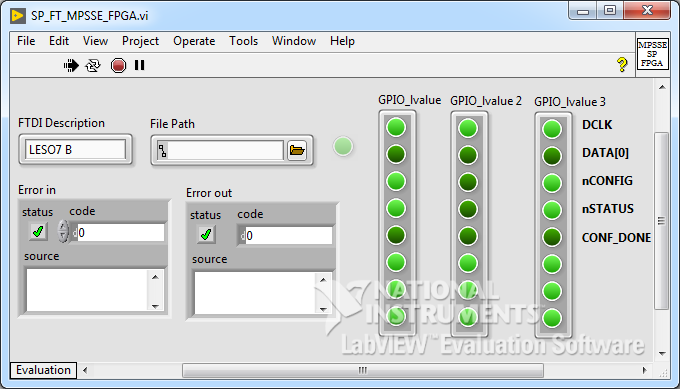
Во время запуска
Блок-диаграмма
В целом, во время запуска VI видно, что ПЛИС реагирует на переход на линии nCONFIG — на ножке nSTATUS устанавливается ноль, а затем единица. Но не будет лишним проконтролировать это с помощью осциллографа. Годится почти любой двуканальный осциллограф с возможностью запуска по триггеру (ждущий режим). Канал А (синий трек) я ставлю в контрольную точку цепи nCONFIG, канал B (красный трек) — цепь nSTATUS. Триггер настроен на спадающий фронт канала A.
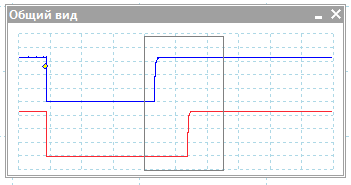
Картинка кликабельна. С подробностями!
Работа с файлом
ПЛИС готова принять файл конфигурации. А готовы ли мы передать файл в ПЛИС?
LabVIEW содержит обширный набор инструментов для работы с файлами. Не скажу, что функционала хватает на абсолютно весь спектр задач, однако базовые операции типа чтение и запись выполняются легко и приятно. Основной набор VI для работы с файлами можно найти в палитре «File I/O». Для решаемой задачи требуется открыть файл конфигурации, оценить его размер (нам нужно знать, сколько байт отправлять ПЛИС), прочесть его и закрыть. Все просто и друг за другом. Используем ВП Open/Create/Replace File, Get File Size, Read from Binary File, Close File, объединяем их цепочкой потока ошибок и refnum — число, типа файлового дескриптора, создается при открытии файла и должно быть передано на вход другим ВП, работающим с этим файлом.
Пока нам некуда утилизировать считанные данные, но если очень хочется проверить работоспособность цепочки, то можно создать индикатор типа String и немножко настроить его. В контекстном меню активируем опцию «Hex Display», включаем вертикальный скроллбар (Visible Items -> Vertical Scrollbar) и после запуска наблюдаем содержимое бинарного файла конфигурации.
SP_FT_MPSSE_FPGA.vi
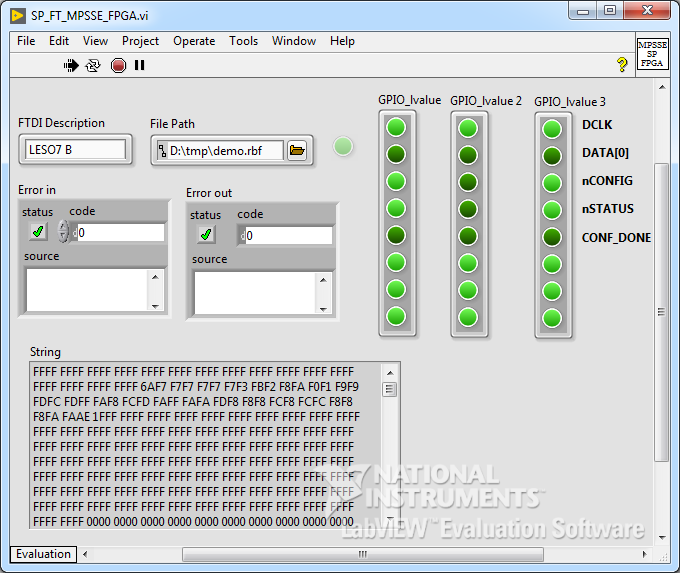
Передняя панель. Смотрим на содержимое файла
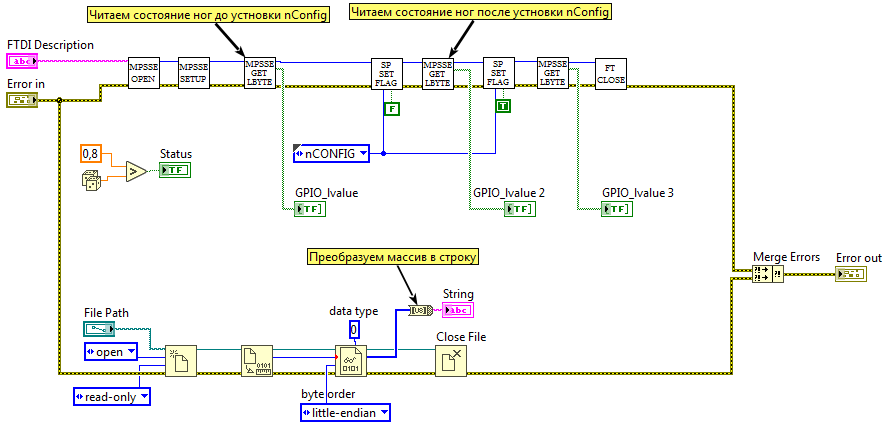
Блок-диаграмма. Каринка кликабельная
На блок-диаграмме ВП образовалось две независимые параллельные линии кода, поэтому для них используются раздельные цепочки ошибок. Для того, чтобы свести параллельные потоки в один терминал Error Out, используется функция Merge Errors. Эта функция просматривает ошибки на входе сверху вниз (да, там может более двух входных терминалов, растягивается мышкой) и возвращает первую, которую найдет. Если ошибок нет, то возвращает первое попавшееся предупреждение. Если и предупреждений не обнаружено, то на выходе ошибка отсутствует. Важно отметить, что порядок подключения входов Merge Errors определяет приоритет ошибок, и если ошибка возникнет сразу в двух цепочках, то нижняя ошибка будет проигнорирована. К этому нужно относиться внимательно.
Если мы попытаемся в ВП верхнего уровня нажать кнопку «Программировать» не выбрав файл, то на вход SP_FT_MPSSE_FPGA.vi поступит пустой путь, что вызовет ошибку «Error 1430. LabVIEW: (Hex 0x596) The path is empty or relative. You must use an absolute path.» Как говорит мой друг детства: «Пустяки, дело-то житейское!». И ошибка эта — вовсе не ошибка, а так, невнимательность пользователя. Останавливать программу и ругаться на него окном с красным крестиком мы не будем, просто удалим ошибку с этим кодом из потока и в диалоговом окне порекомендуем пользователю определиться с файлом. Для фильтрации ошибки используем ВП «Clear Errors» из палитры «Dialog&User Interface». Для вывода сообщения — «One Button Dialog».
Блок-диаграмма
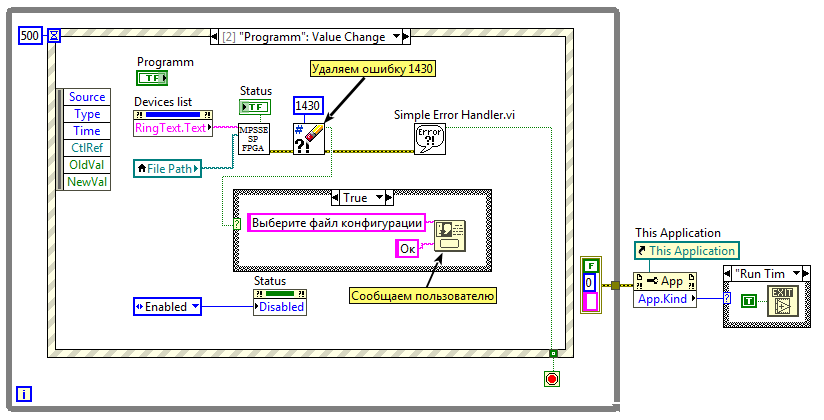
Картинка кликабельна
Загрузка конфигурации
Для последовательной передачи данных процессору MPSSE нужно послать op-code 0x18, аргументами команды будет длина передаваемой последовательности (два байта, начиная с младшего), и сама последовательность данных. Длина кодируется за вычетом единицы. Отправку блока данных оформим в виде ВП MPSSE_send.
MPSSE_Send.vi
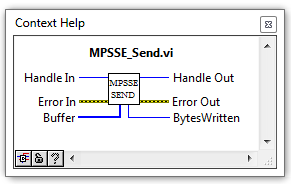
MPSSE_Send.vi
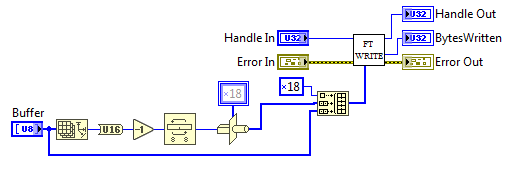
Блок-диаграмма
Размер входного буфера (Array Size) преобразовываем к двухбайтовому типу U16, отнимаем единицу, меняем местами младший и старший байт (Swap Bytes) — отправлять длину нужно начиная с младшего, и преобразовываем двухбайтовое число в однобайтный массив (Type Cast).
Функция Type Cast заслуживает отдельного внимания. Это такой универсальный преобразователь типов, сообразительность которого порою сильно удивляет. Если коротко, то:
Наглядно для програмиста
Однако это не просто приведение данных к другому типу, это еще и эвристическая интерпретация. Эта функция позволяет выполнять преобразование между несовместимыми типами данных, при этом функция не брезгует выравниванием входных данных и даже удалением «лишних» частей. Если запрошенный тип данных требует памяти больше, чем у входных данных, то функция выделит недостающий объем. Для начинающего разработчика LabVIEW Type Cast может стать палочкой-выручалочкой, но с взрослением, лучше от такого преобразователя отказаться — сильно много скрыто от глаз и может стать источником непредвиденных ошибок. Лучше использовать более явные методы преобразования, например, Coerce To Type.
При инициализации процессора MPSSE, мы задали максимально допустимый размер буфера для передачи данных в 65536 байт, следовательно файл конфигурации мы должны разделить на фрагменты, размер которых не превышает указанный размер. Воспользуемся функцией Array Subset, эта функция выделяет из массива подмассив начиная с элемента index и длинною length. Разбивать будем в цикле While, каждую итерацию индекс будем увеличивать на 65536, между итерациями значение передадим через сдвиговый регистр. Как только не удастся от основного массива отщипнуть 65536 байта, берем все, что осталось, отправляем и останавливаем цикл.
Согласно протоколу загрузки, после того, как все данные были переданы, нужно подать еще два тактовых импульса, чтобы началась инициализация ПЛИС. Для этого после цикла выполняем отправку еще одного «пустого» байта.
SP_FT_MPSSE_FPGA.vi

Картинка кликабельна
Для того, чтобы понять успех прошивки, считаем флаги, и, если CONF_DONE установлен в единицу, рапортуем ВП верхнему уровня, что все ОК.
Программа завершена. Осталось убедиться, что ПЛИС успешно прошивается, а плата счастливо мигает светодиодиками.
Про именование ВП
Ни для кого не секрет, что в классическом программировании всем пользовательским объектам и функциям нужно давать осмысленные имена, то же можно сказать и о LabVIEW, особенно, если в роли объектов выступает SubVI. Я привык имена файлам ВП давать на основе их места в иерархии разрабатываемого ПО. В текущем приложении можно выделить четыре уровня абстракции:
- Самый низкий уровень — это ВП, выполняющие непосредственное взаимодействие с FTDI, в большинстве своем они сводятся к вызову соответствующей функции из API D2XX. В своем проекте имена ВП этого уровня я начинал с префикса «FT», например FT_Close.vi или FT_Read.vi.
- Второй уровень — это взаимодействие с процессором MPSSE. Имена ВП этого уровня начинаются с префикса «MPSSE». Пример: MPSSE_open.vi, MPSSE_Set_LByte.vi, MPSSE_Get_LByte.vi.
- Третий уровень — это реализация протокола «Passive Serial» поверх MPSSE. Все файлы имеют префикс «SР». Например, SP_FT_MPSSE_FPGA.vi (жуткое имя, состоящее из аббревиатур) и SP_LBYTE_BITS.ctl.
- Уровень приложения. ВП верхнего уровня. Имя может быть произвольным, человекоориентированным.
Если проект достаточно большой (десятки ВП), то для каждого уровня файлы лучше хранить в отдельных директориях с соответствующим названием. В нашем проекте все ВП разместились в одной папке subVI.
Заключение
Может показаться, что описание процесса излишне подробно, но уж очень не хотелось создать очередное пособие по рисованию совы.
Рисуем сову
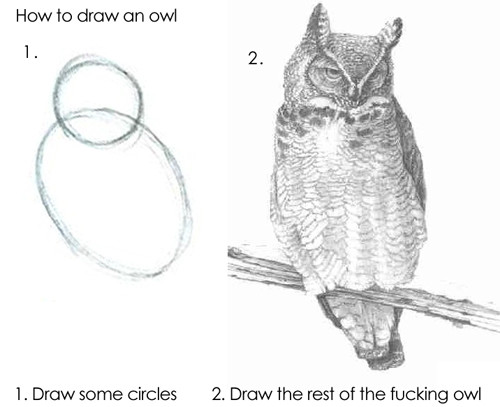
Я не пытался сделать справочник или учебник по языку, я хотел показать процесс создания приложения на LabVIEW, показать как строится логика разработки в этой среде. Человек со стороны поймет, нужно ли это ему вообще, начинающий разработчик несомненно почерпнет для себя много нового, профессионал снисходительно улыбнется и вспомнит себя в молодости (либо кинет в меня помидором). А мне будет куда направить моих студентов и дипломников.
Материалы по теме
- Блюм П. LabVIEW: стиль программирования. Пер. с англ. под ред. Михеева П.– М.:
ДМК Пресс, 2008 – 400 с.: ил. - labview_mpsse. Репозиторий с проектом.
- Учебный стенд для ЦОС. Железо для опыта
- Software Application Development D2XX Programmer’s Guide. Руководство по API D2XX.
Только зарегистрированные пользователи могут участвовать в опросе. Войдите, пожалуйста.
Интересна ли тема LabVIEW
86.96%
Да. Тема интересна.
20
0%
Тема может и интересна, но для Habra это оффтоп.
0
0%
Не интересна. Тема для узкого круга специалистов.
0
13.04%
LabVIEW — проприетарное недоразумение. Простить и забыть.
3
Проголосовали 23 пользователя.
Воздержались 5 пользователей.
ERROR HANDLING
By default LABVIEW automatically handles any error that occurs when a VI runs by suspending execution, highlighting the subVI or function where the error occurred, and displaying a dialog box. You can choose other error handling methods. For example, if an I/O VI on the BLOCK DIAGRAM times out, you might not want the entire application to stop. You also might want the VI to retry for a certain period of time. In LabVIEW, you can make these error handling decisions on the block diagram of the VI.
VIs and functions return errors in one of two ways—with numeric error codes or with an error cluster. Typically, functions use numeric error codes, and VIs use an error cluster, usually with error inputs and outputs. Error handling in LABVIEW follows the data flow model. Just as data flow through a VI, we get an error information. Wire the error information from the beginning of the VI to the end. Include an error handler VI at the end of the VI to determine if the VI ran without errors. Use the error in and error out clusters in each VI you use or build to pass error information through the VI.
If you would like to Enrich your career with an Android certified professional, then visit Mindmajix — A Global online training platform: “LabVIEW training” Course.This course will help you to achieve excellence in this domain.
As the VI runs, LabVIEW tests for errors at each execution node. If LabVIEW does not find any errors, the node executes normally. If LabVIEW detects an error, the node passes the error to the next node without executing. The next node does the same thing and so on. Use the simple error handler VI, shown below Figure, to handle the error at the end of the execution flow. The simple error handler VI is located on the Functions» All Functions» Time & Dialog palette. Wire the error cluster to the error in input.
.png&w=16&q=75)
ERROR CLUSTER
Error clusters tell you why and where errors occur. When you perform any kind of I/O, consider the possibility that errors will occur. Almost all I/O functions return error information. Include error checking in VIs, especially for I/O operations such as file, serial, instrumentation, data acquisition, and communication operations, and provide a mechanism to handle errors appropriately. No matter how confident you are in the VI you create, you cannot predict every problem a user might encounter. Without a mechanism to check for errors, you know only that the VI does not work properly. Checking for errors in VIs can help you identify the following problems:
- You initialized communications incorrectly or wrote improper data to an external device.
- An external device lost power, is broken, or is not working properly.
- You upgraded the operating system software which changed the path to a file or the functionality of a VI or library. You might notice a problem in a VI or a system program.

Frequently Asked LabVIEW Interview Questions & Answers
The error clusters located on the Functions» All Functions» Array & Cluster palette include the following components of information which are also shown below Figure.
.png&w=16&q=75)
- status is a Boolean value that reports True if an error occurred. Most VIs, functions, and structures that accept Boolean data also recognize this parameter. For example, you can wire an error cluster to the Boolean inputs of the Stop, Quit LabVIEW, or Select If an error occurs, the error cluster passes a True value to the function.
- code is a 32-bit signed integer that identifies the error numerically. A non-zero error code coupled with a status of False signals a warning rather than a fatal error.
- the source is a string that identifies where the error occurred. Use the error cluster controls and indicators to create error inputs and outputs in subVIs.
When an error occurs, right-click within the cluster border and select Explain Error from the shortcut menu to open the Explain Error dialog box. The Explain Error dialog box contains information about the error. The shortcut menu includes an Explain Warning option if the VI contains warnings but no errors. You can also access the Explain Error dialog box from the Help» Explain Error menu.
Explore LabVIEW Sample Resumes! Download & Edit, Get Noticed by Top Employers!Download Now!
About Author
I am Ruchitha, working as a content writer for MindMajix technologies. My writings focus on the latest technical software, tutorials, and innovations. I am also into research about AI and Neuromarketing. I am a media post-graduate from BCU – Birmingham, UK. Before, my writings focused on business articles on digital marketing and social media. You can connect with me on LinkedIn.
read more
You might have already noticed the error cluster datatype, which is found on the Modern>>Array, Matrix & Cluster palette (Error In and Error Out, shown in Figure 7.64) and can also be found used in the inputs and outputs of many VIs and functions. The error cluster is a special datatype in LabVIEW (a cluster consisting of a status Boolean, code I32, and source string) that is used for propagating information about errors that occur during the execution of LabVIEW code. Errors and error handling are very naturalthere is no reason to be afraid of errors. Rather, we should understand how errors can occur, how to communicate errors, and how to handle errors.
Figure 7.64. Error In and Error Out controls found on the Array, Matrix & Cluster palette
So, what is an error? In simple terms, an error is an event where a function or subVI cannot complete a request because resources are not available or the information (arguments) passed to it are not valid.
In LabVIEW, we use dataflow to propagate information about errors inside of an error cluster datatype.
Error Cluster Datatype
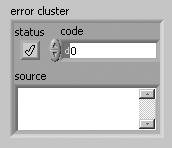
The error cluster (shown in Figure 7.65) contains three elements, as follows:
-
status BooleanSignifies whether there is an error (TRUE) or no error (FALSE).
-
code I32Is an error code signed integer that identifies the error.
-
Positive codes are errors.
-
Negative codes are warnings.
-
Zero is no error.
-
-
source stringIs a string that contains descriptive information about the source of the error. This commonly also contains a call chain, a list of VIs starting at the subVI (or function) where the error occurred and then listing up the call hierarchy, all the way up to the top-level VI.
Figure 7.65. Error cluster

Propagating Errors: Error Dataflow
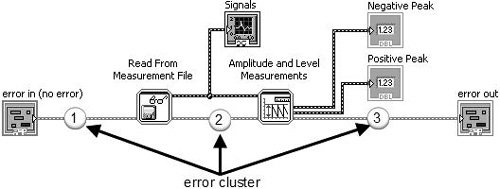
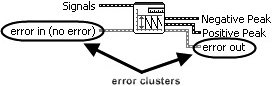
You use the error cluster datatype to store information about an error, and you use dataflow to propagate the error cluster through your block diagram. As you can see the example shown in Figure 7.66, an error cluster passes through the block diagram, connecting the following, in sequence:
-
error in control terminal to the Read From Measurement File subVI.
-
Read From Measurement File subVI to Amplitude and Level Measurements subVI.
-
Amplitude and Level Measurements subVI to the error out indicator terminal.
Figure 7.66. Block diagram showing how the error cluster is used to propagate errors using dataflow


Many of LabVIEW’s functions and VIs have error in and error out terminals. These are almost always found (if present on the function or VI) on the lower-left and lower-right terminals of the connector pane (respectively). Figures 7.67 and 7.68 show the inputs and outputs of Read From Measurement File and Amplitude and Level Measurements with error in and error out highlighted.
Figure 7.67. Read From Measurement File
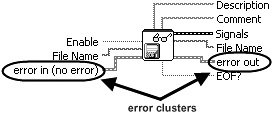
Figure 7.68. Amplitude and Level Measurements
Generating and Reacting to Errors in SubVIs
The expected behaviors of functions and VIs, with respect to generating and reacting to errors, are the following:
-
If error in contains an error (status = TRUE), do not do any work unless it is «clean up» work, such as
-
closing file references.
-
closing instrument or other communication references.
-
putting the system back into an idle/safe state (powering off motors, etc.).
-
-
If an error occurs inside of a function or VI, the function should pass out the error information via its error out indicator terminal unless it was passed in an error via its error in input terminal. In this case, just pass the incoming error from error in to error out, unchanged.
Error Case Structure
A subVI can fulfill expected behavior #1, by «wrapping» all of its functional code (its «work») inside of an Error Case Structure, which is simply a case structure that has an error cluster wired to its case selector terminal. As you can see in Figure 7.69, the Case Structure allows the error cluster datatype to be wired to its case selector terminal. When wired in this way, the Case Structure frame names change to «No Error» and «Error.» At run-time, if the error cluster does not contain an error, then the «No Error» frame will execute. Conversely, if the error cluster does contain an error, then the «Error» frame will execute.
Figure 7.69. An «Error Case Structure» containing an «Error» and «No Error» cases
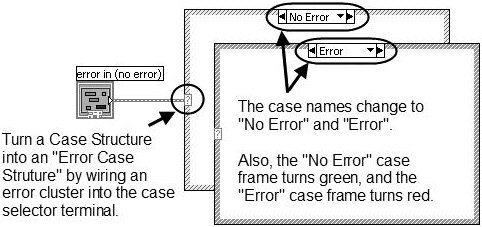
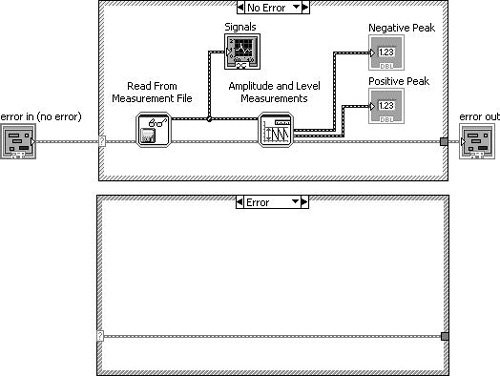
Figure 7.70 shows how we can use a case structure to conditionally execute our functional code only when there is no «upstream error» (using the dataflow vernacular).
Figure 7.70. An «Error Case Structure» used to execute code only when there is no «upstream error»
Merge Errors
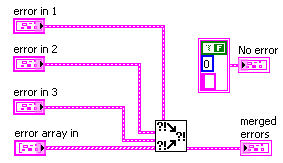
But, what about the situation where you want to do some clean-up work, even if an upstream error has occurred? In this case, you should not wrap your functional code in an Error Case Structure, but rather, merge the error cluster flowing out of your work with the upstream error cluster using Merge Errors.vi, as shown in Figure 7.71.
Figure 7.71. Using Merge Errors.vi to combine several error clusters into a single error cluster
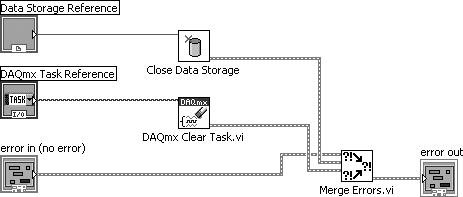

An error cluster can contain information about one, and only one, error. (This is a limitation in the data structure that carries a long legacy.) Merge Errors.vi merges several errors cluster inputs into a single error output. However, if there are errors in more than one input, it must choose which of these errors will take top priority and be passed to error out. It uses a top-to-bottom priority scheme, giving error in 1 top priority, then error in 2, and so on.
In the example shown in Figure 7.72, it is critical that the upstream error be wired to error in 1 (the top-most error input terminal) to ensure that the upstream error takes priority over any errors that occur inside our subVI.
Figure 7.72. Merge Errors.vi
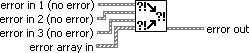
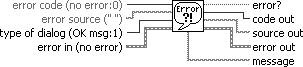
(Programming>>Dialog & User Interface palette). Merges error I/O clusters from different functions. This VI first looks for errors among error in 1, error in 2, and error in 3; then error array in and reports the first error found. If the VI finds no errors, it looks for warnings and returns the first warning found. If the VI finds no warnings, it returns no error.

Use merge errors to combine the error clusters of parallel tasks, or tasks that must each execute regardless of upstream errors.
Handling Errors in SubVIs
It is a good practice for a subVI to make a reasonable attempt to fulfill its contract (its stated job, per the software design requirements) in every way it can before passing an error up.
For example, imagine you are writing a routine that initializes an XY motion stage. (This might actually be the case, for some of our readers.) In order to find the home position (X = 0, Y = 0), the stage is moved at a low velocity toward a position sensor that outputs a digital signal of 1 (TRUE) when the stage reaches the home position. However, because there is a lot of electrical noise coming from the stage motors, the position sensor sometimes fails to report when the stage is at the home position (it sometimes jumps to 0, momentarily). This causes the initialization routine to fail at a rate of about one (1) out of twenty (20) tries, or 5% of the time. When it does fail, it always outputs the same error code. The noisy home position sensor signal has no other effect on the system, except for the occasional error during the homing operation.
Knowing what you know about the rate of failure and the type of failure, why not adapt your homing routine to retry (up to a certain number of times) before actually outputting an error message to the calling VI? This would make your code robust: fault tolerant and able to get the job done in spite of minor errors. Wouldn’t your end users be much happier if you made this change? Think of all those times they’ve started an experiment and came back to the lab an hour later expecting to find their experiment completed but, instead, they find that the system has generated that blankity-blank error while trying to home the stage… again!
OK, you agree that handling errors in subVIs is a great idea. Because the error cluster is just that, a cluster, you can use the cluster functions such as Unbundle By Name and Bundle By Name to access and modify the error data. For example, you can unbundle the error code.
Generating Errors in SubVIs
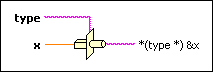
When you call a subVI or function and it generates an error, you can either try again (or perhaps try something else) or you can give up and propagate error (passing it downstream or up to the calling VI). But what happens when you want to generate a new error, perhaps because of an invalid input passed down from the calling VI? For this situation, you should use Error Cluster From Error Code.vi to generate a new error (see Figure 7.73).
Figure 7.73. Error Cluster From Error Code.vi
Error Cluster From Error Code.vi (Programming>>Dialog & User Interface palette) converts an error or warning code to an error cluster. This VI is useful when you receive a return value from a DLL call or when you return user-defined error codes.
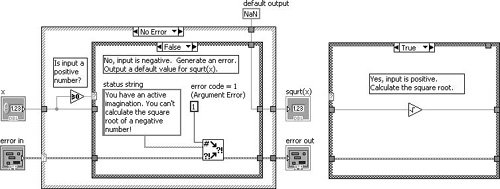
For example, Figure 7.74 shows how we might generate an error in a subVI when an invalid argument is passed into the subVI (the TRUE case of the inner Case Structure is shown only for illustration purposes). In this example (which is located on the CD at EVERYONE/CH07/Calculate Square Root with Error.vi), we are calculating the square root of a number x. If x is negative, we will output an error (error code 1, which signifies an argument error) and default output data.
Figure 7.74. Calculate Square Root with Error.vi block diagram
Giving Up: Displaying Error Messages to the User
If error conditions cannot be handled by subVIs or in your top-level application, you can «give up» (but, please don’t accept defeat too easily) and display an error message to the user. This is the «last resort» of error handling. Figure 7.75 shows an error being passed to Simple Error Handler.vi (found on the Programming>>Dialog & User Interface palette) to display a dialog containing the error information. In this case, we passed a negative number to the subVI shown in Figure 7.74, which is an invalid input.
Figure 7.75. Calling Calculate Square Root with Error.vi as a subVI
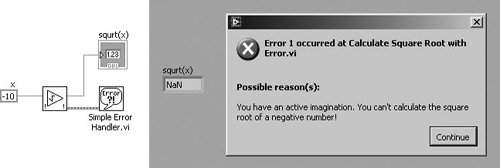
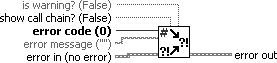
Figure 7.76. Simple Error Handler.vi
Simple Error Handler.vi (Programming>>Dialog & User Interface palette) indicates whether an error occurred. If an error occurred, this VI returns a description of the error and optionally displays a dialog box. This VI calls the General Error Handler VI and has the same basic functionality as General Error Handler but with fewer options.
Extra Tips for Error Handling
Use the following tips for successful error handling.
Use the Explain Error Dialog
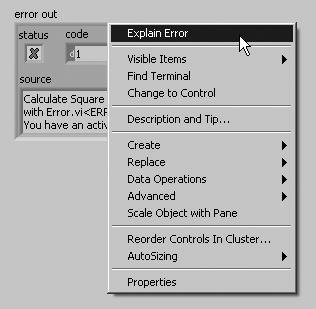
When an error cluster control or indicator contains an error or warning, you can learn more about an error by selecting Explain Error from the cluster’s pop-up menu, as shown in Figure 7.77.
Figure 7.77. Selecting Explain Error from the pop-up menu of an error cluster to open the Explain Error dialog (shown in Figure 7.78)
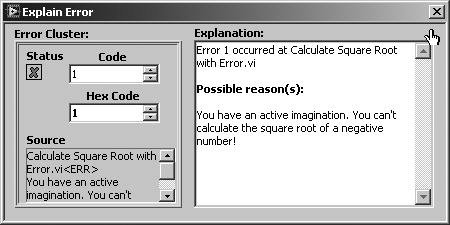
This will display the Explain Error dialog, as shown in Figure 7.78.
Figure 7.78. Explain Error dialog, which shows a detailed error explanation
Go with the Dataflow: Use Error In and Error Out Terminals
When you add error in and error out I/O terminals to your VIs, you allow calling VIs the opportunity to chain the error cluster wire to create dataflow dependencies between subVIs. Also, you are enabling applications to perform error handling, which is a good programming practice. Even if your subVI might not ever generate an error itself, put error I/O terminals on the front panel, and put an Error Case Structure on the block diagram (as you just learned) to allow errors to propagate through the software.
Make sure to wire error in to the lower-left terminal and error out to the lower-right terminal of the VI connector panethis is a best practice.
Define Your Own Errors: User-Defined Error Codes
For large applications, you might want to explore user-defined error codes, which are specific to your application. The LabVIEW Help documentation describes the process for defining and using this feature.
Don’t Get Stuck in a Loop: Test Error Status in Loops
It is almost always a good idea to check for errors inside of loops, so that you can exit the loop if an error occurs. Figure 7.79 shows how this is done. Note that the loop will stop if either the stop button is pressed or an error occurs.
Figure 7.79. Checking for errors in a While Loop to exit the loop when there is an error
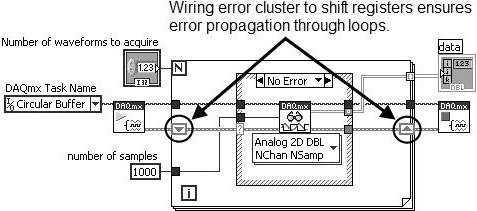
Use Shift Registers to Pass Errors Through Loops
Always use shift registers (not tunnels) for passing error clusters through the wall of a loop. This is especially important for a For Loop, as shown in Figure 7.80. Remember, if a For Loop executes zero times, data still passes from the input shift register to the output shift register. Wiring error clusters to shift registers on a For Loop ensures that errors propagate through the For Loop if it executes zero times.
Figure 7.80. Using shift registers to pass errors through loops