- Command Support
- display compatible-information
- display cpu-usage
- display cpu-usage configuration
- display cpu-usage history
- display device
- display device capability
- display device manufacture-info
- display diagnostic-information
- display elabel
- display esn
- display fan
- display memory-usage
- display memory-usage threshold
- display power
- display transceiver
- display transceiver diagnosis interface
- display temperature
- display version
Command Support
Commands provided in this section and all
the parameters in the commands are supported by all switch models
by default, unless otherwise specified. For details, see specific
commands.
display compatible-information
Function
The display compatible-information command displays compatible information of a device.
Format
display compatible-information
Default Level
1: Monitoring level
Usage Guidelines
Generally, device versions have matching NMS software. The NMS software needs to apply to all the devices supported by matching versions. Otherwise, the NMS cannot manage devices. If the NMS version is an earlier version but the current device is running a later version that does not match the current NMS version, the NMS cannot manage the current device.
To decouple the NMS version and device version, a compatible device model developed based on an earlier version is defined for each device model. If the NMS cannot manage a device because of version mismatch, obtain information about the device compatible with the current device. The NMS can then use the obtained information to manage the current device.
For example:
S5700LI_R7 is a device model newly available in V200R007. The NMS software version that matches the device software version is V200R007.
S5700LI_R5 is a device model newly available in V200R005. The NMS software version that matches the device software version is V200R005.
When you use the NMS of V200R005 to manage S5700LI_R7, the device cannot be managed because of version mismatch. The NMS then obtains compatibility information about S5700LI_R7 and learns that it is compatible with S5700LI_R5. Subsequently, the NMS uses information about S5700LI_R5 to manage the current device.
If the device does not have a compatible version, the system will display a message, indicating that no compatible information exists after the display compatible-information command is executed.
Compatible information of stacked devices can also be displayed.
Example
# Display compatible information of a device.
<HUAWEI> display compatible-information
Compatible SysOids  : 1.3.6.1.4.1.2011.2.23.117
Compatible Version  : V200R003C00
ProductName         : S2750-28TP-EI-AC
Table 3-1 Description of the display compatible-information command output
|
Item |
Description |
|---|---|
|
Compatible SysOids |
System OID of an old device version. |
|
Compatible Version |
Old device version compatible with the current device version. |
|
ProductName |
Product name of a new device. |
display cpu-usage
Function
The display cpu-usage command displays CPU usage
statistics.
Format
display cpu-usage [ slave | slot slot-id ] [ vcpu vcpu ]
The slave parameter is not supported if the switch does not support the stacking
function or does not have the stacking function enabled.
Only the S5720HI supports the vcpu vcpu parameter.
Parameters
| Parameter | Description | Value |
|---|---|---|
| slave |
Displays the CPU usage of slave devices |
— |
| slot slot-id |
|
The value is 0 if stacking is not |
| vcpu vcpu |
Displays the usage of a specified virtual CPU. |
Specify the vcpu parameter based |
Default Level
1: Monitoring level
Usage Guidelines
CPU usage is an important indicator to evaluate device
performance. A high CPU usage will cause service faults, for example, BGP route flapping, frequent VRRP active/standby switchover,
and even failed device login. You can use the display cpu-usage command to view CPU usage to check whether devices are working properly.
When the CPU usage is high, rectify the fault according to «Troubleshooting:
High CPU» in Huawei S Series Campus Switches Troubleshooting
Guide.
Example
# Display the CPU usage on the device.
<HUAWEI> display cpu-usage CPU Usage Stat. Cycle: 60 (Second) CPU Usage : 20% Max: 99% CPU Usage Stat. Time : 2013-10-23 10:04:45 CPU utilization for five seconds: 5%: one minute: 5%: five minutes: 5% Max CPU Usage Stat. Time : 2013-10-21 16:14:00. TaskName CPU Runtime(CPU Tick High/Tick Low) Task Explanation VIDL 80% 0/e3a150c0 DOPRA IDLE OS 10% 0/ bfb0440 Operation System 1AGAGT 6% 0/ 0 1AGAGT AAA 2% 0/ 1d4a AAA Authen Account Authorize ACL 1% 0/ 13362 ACL Access Control List ADPT 1% 0/ 0 ADPT Adapter AGNT 0% 0/ 0 AGNTSNMP agent task AGT6 0% 0/ 0 AGT6SNMP AGT6 task ALM 0% 0/ 0 ALM Alarm Management ALS 0% 0/ 527a3e ALS Loss of Signal AM 0% 0/ 232cf AM Address Management APP 0% 0/ 0 APP ARP 0% 0/ 36582 ARP ASFI 0% 0/ 0 ASFI ASFM 0% 0/ 0 ASFM BATT 0% 0/ 0 BATT Main Task BFD 0% 0/ 100f36 BFD Bidirection Forwarding Detect BFDA 0% 0/ 0 BFDA BFD Adapter BFDS 0% 0/ 5825 BFDS BOX 0% 0/ 1d0097 BOX Output BPDU 0% 0/ 1806 BPDU Adapter BTRC 0% 0/ 60e BTRC CDM 0% 0/ 9b95 CDM CFM 0% 0/ 6f68 CFM Configuration file management CLKI 0% 0/ 0 CLKI DEFD 0% 0/ 22ebd DEFD CPU Defend DELM 0% 0/ 355c DELMAC FOR STP DEV 0% 0/ 0 DEV Device Management DHCP 0% 0/ 12188 DHCP Dynamic Host Config Protocol DLDP 0% 0/ dc0d DLDP Protocol EAP 0% 0/ 38a9 EAP Extensible Authen Protocol EFMT 0% 0/ 11c70 EFMTEST 802.3AH Test EOAM 0% 0/ ea8f EOAM1AG ESAP 0% 0/ 0 ESAP eSap Adapter ETHA 0% 0/ 0 ETHA EZOP 0% 0/ 506f4 EZOP EasyOperation application EZPP 0% 0/ 1e41f8 EZPP EasyOperation packet FCAT 0% 0/ 6479 FCAT Catch Packets for debugging FECD 0% 0/ 11d8e FECD Mod Manage Task FIB 0% 0/ 523b FIB Forward Information Base FIB6 0% 0/ 0 FIB6IPv6 FIB FLOW 0% 0/ ce76 FLOW SFLOW FMAT 0% 0/ 7f23 FMATFault Manage task FTS 0% 0/ 125f35 FTS GEM 0% 0/ 0 GEM task GEMR 0% 0/ 0 GEMRun task GRSA 0% 0/ 0 GRSA GVRP 0% 0/ 0 GVRP Protocol HACK 0% 0/ 0 HACKtask for HA ACK HOTT 0% 0/ 0 HOTT HS2M 0% 0/ 0 HS2MHigh available task HTTP 0% 0/ 5d420 HTTP IFLP 0% 0/ 8611 IFLP IFNT 0% 0/ 0 IFNTIfnet task IFPD 0% 0/ 2177f21 IFPD Ifnet Product Adapter INFO 0% 0/ 70409 INFOInformation center IP 0% 0/ cb13 IP IPCK 0% 0/ 0 IPCKIPC task for ack message IPCQ 0% 0/ 3c6ffd IPCQIPC task for single queue IPCR 0% 0/ 0 IPCR IPC Receiver JOB 0% 0/ 0 JOB Schedule L2 0% 0/ 2a6b5 L2 L2IF 0% 0/ b7fbc L2IF L2_E 0% 0/ 10088 L2_EOAM_Y1731 L2_P 0% 0/ 58a50 L2_PR L2_R 0% 0/ 169c0c L2_RING L2_T 0% 0/ 1724 L2_TRUNK L3I4 0% 0/ 0 L3I4 LPU Manage IPv4 unicast FDB L3IO 0% 0/ 0 L3IO LPU Process urpf, vrrp etc. L3M4 0% 0/ 0 L3M4 MPU Manage IPv4 unicast FDB L3MB 0% 0/ 4319 L3MB MPU Process urpf, vrrp etc. LAGAGT 0% 0/ 107dd LAGAGT LBDT 0% 0/ 1bf810 LBDT Loopback Detect Mpu LINK 0% 0/ 0 LINK LLDP 0% 0/ 70921 LLDP Protocol LNP 0% 0/ 0 LNP task MAC 0% 0/ 564f MAC Media Access Control MACL 0% 0/ 21954 MACL Access Control List MAD 0% 0/ dae7 MAD Task MADP 0% 0/ 0 MADP MAD proxy Task MCSW 0% 0/ 12624 MCSW Mulitcast Switch Adapter MERX 0% 0/ 8a774 MERX Meth Receive METH 0% 0/ f0699 METH Metropolitan Ethernet MFF 0% 0/ b308 MFF MAC Forced Forwarding MFIB 0% 0/ beb MFIBMulticast forward info MIRR 0% 0/ 0 MIRR Capture Packet MSYN 0% 0/ 7245a MSYN Mac Synchronization Mirr 0% 0/ 4107 Mirror NDIO 0% 0/ 0 NDIO LPU Manage IPv6 unicast FDB NDMB 0% 0/ 0 NDMB MPU Manage IPv6 unicast FDB NFPT 0% 0/ d2dec NFPTNFP timer task NTPT 0% 0/ 0 NTPT task OAM1 0% 0/ 0 OAM1 EOAM Adapter PAT 0% 0/ 0 PAT PNGI 0% 0/ 0 PNGI PNGM 0% 0/ 0 PNGM MPU Process icmp reply fast POE+ 0% 0/ 0 POE+ PPP Over Ethernet Plus PPI 0% 0/ 58e46 PPI Product Process Interface PTAL 0% 0/ 0 PTAL Portal RDS 0% 0/ 0 RDS Radius RMON 0% 0/ 11240 RMONRemote monitoring ROUT 0% 0/ 6a6343 ROUTRoute task RPCQ 0% 0/ 22254 RPCQRemote procedure call RTMR 0% 0/ ed870 RTMR SAM 0% 0/ 2e2d SAM Service Agent Module SAPP 0% 0/ 758e SAPP SECE 0% 0/ 2e6e82 SECE Security SLAG 0% 0/ 0 SLAG SMAG 0% 0/ 0 SMAG Smart Link Agent SMLK 0% 0/ 71827 SMLK Smart Link Protocol SNPG 0% 0/ d97b7 SNPG Multicast Snooping SOCK 0% 0/ 4bdda SOCKPacket schedule and process SPM 0% 0/ 6a1ce SPM Smart Power Management SRM 0% 0/ 6bb9b8 SRM System Resource Management SRMI 0% 0/ 0 SRMI External Interrupt SRMT 0% 0/ fe2a46 SRMT System Resource Manage Timer STFW 0% 0/ 0 STFW Super task forward STND 0% 0/ 0 STNDStandby task STP 0% 0/ 79e590 STP STRA 0% 0/ 1c767 STRA Source Trail TACH 0% 0/ 9817e TACHWTACACS TARP 0% 0/ 0 TARPING TICK 0% 0/ 7dbef6 TM 0% 0/ 0 TM Transmission Management TNQA 0% 0/ 83134 TNQAC TRAP 0% 0/ 14d7 TRAPSNMP trap task TTNQ 0% 0/ 0 TTNQAS TUNL 0% 0/ 5c17 TUNL UCM 0% 0/ 3e46 UCM User Control Management UTSK 0% 0/ 0 UTSK VCMP 0% 0/ 0 VCMP task VFS 0% 0/ 0 VFS Virtual file system VFSD 0% 0/ 0 VFSDVFS flash task for delete file block VMON 0% 0/ 78d5 VMONSystem monitor VMSH 0% 0/ 0 VMSH VP 0% 0/ 5966 VP Virtual path task VPR 0% 0/ 0 VPR VP Receiver VRPT 0% 0/ 39fd VRPT VRRP 0% 0/ 152ced VRRP VT 0% 0/ 0 VT Virtual Transfer VT0 0% 0/ 4909c5 VT0 Line user's task VT1 0% 0/ 0 VT1 Line user's task VTYD 0% 0/ b3282 VTYDVirtual terminal WEB 0% 0/ 1295 WEB Web XMON 0% 0/ 0 XMONVxworks system monitor XQOS 0% 0/ 12999 XQOS Quality of service _EXC 0% 0/ 0 Exception Agent Task _TIL 0% 0/ 0 Infinite loop event task bcmCNTR.0 0% 0/ 61077b tS10 bcmCNTR.1 0% 0/ 605691 tS11 bcmDPC 0% 0/ 25d89 tS09 bcmL2X.0 0% 0/ b069d6 tS0c bcmL2X.1 0% 0/ b2c5f2 tS0f bcmRX 0% 0/ 1df879 bcmRX bcmTX 0% 0/ 16f2 tS0a frag_add 0% 0/ 45ecce tS0d frag_del 0% 0/ 0 tS0e linkscan 0% 0/ ecce16 tS12 root 0% 0/ 0 tS03 soft_learn 0% 0/ 7812a tS0b tExcTask 0% 0/ 0 tS00 tLogTask 0% 0/ 0 tS01 tShell 0% 0/ 0 tS02
Table 3-2 Description of the display cpu-usage command output
| Item | Description |
|---|---|
| CPU Usage Stat. Cycle | Interval for collecting CPU usage statistics. The default interval is 60 seconds. |
| CPU Usage | Average CPU usage in the last 10 seconds. |
| Max | Highest CPU usage in history. |
| CPU Usage Stat. Time | Time when the latest CPU usage statistics are collected. |
| CPU utilization for five seconds | CPU usage in five seconds. |
| one minute | CPU usage in one minute. |
| five minutes | CPU usage in five minutes. |
| Max CPU Usage Stat. Time | Time when the highest CPU usage statistics are collected. |
| TaskName | Task that is being executed. For details about all the tasks and functions of the device, see «Troubleshooting: High CPU Usage — How to Locate the High CPU Usage Problem — Determining Fault Causes According to CPU Usages of Tasks (Fixed Switches)» and «Troubleshooting: High CPU Usage — Appendix — CPU-related Tasks and Functions for Fixed Switches» in Huawei S Series Campus Switches Troubleshooting Guide. |
| CPU | Real-time CPU usage of each task. |
| Runtime(CPU Tick High/Tick Low) | System running time calculated based on CPU tick. |
| Task Explanation | Explanation to the task. |
display cpu-usage configuration
Function
The display cpu-usage configuration command displays CPU usage configuration.
Format
display cpu-usage configuration [ slave | slot slot-id ]
The slave parameter is not supported if the switch does not support the stacking
function or does not have the stacking function enabled.
Parameters
| Parameter | Description | Value |
|---|---|---|
| slave |
Displays CPU usage configuration of standby switches in a stack. This parameter is valid only when multiple switches form stack. |
— |
| slot slot-id |
Displays device CPU usage configuration. slot-id specifies the stack ID. |
The value is 0 if stacking is not configured. The value ranges from 0 to 8 if stacking is configured. |
Default Level
1: Monitoring level
Usage Guidelines
This command displays the alarm threshold and recovery threshold.
-
When CPU usage reaches the alarm threshold, the system generates a CPU usage alarm.
-
When CPU usage falls within the recovery threshold, the system generates a clear alarm.
Example
# Display CPU usage configuration .
<HUAWEI> display cpu-usage configuration
The CPU usage monitor is turned on.
The current monitor cycle is 60 seconds.
The current monitor warning threshold is 95%.
The current monitor restore threshold is 80%.
Table 3-3 Description of the display cpu-usage configuration command output
|
Item |
Description |
|---|---|
|
The CPU usage monitor |
Whether the CPU usage monitoring function is enabled or disabled. To enable the CPU usage monitoring function, run the cpu-usage monitor command. |
|
The current monitor cycle |
CPU usage monitoring period, which cannot be configured. |
|
The current monitor warning threshold |
Alarm threshold. To set the CPU usage alarm threshold, run the cpu-usage threshold threshold-value [ restore restore-threshold-value ] [ slot slot-id ] command. |
|
The current monitor restore threshold |
Alarm recovery threshold. To set the CPU usage alarm recovery threshold, run the cpu-usage threshold threshold-value [ restore restore-threshold-value ] [ slot slot-id ] command. |
display cpu-usage history
Function
The display cpu-usage history command
displays CPU usage statistics within a period.
Format
display cpu-usage history [ 1hour | 24hour | 72hour ] [ slave | slot slot-id ] [ vcpu vcpu ]
The slave parameter is not supported if the switch does not support the stacking
function or does not have the stacking function enabled.
Only the S5720HI supports the vcpu vcpu parameter.
Parameters
| Parameter | Description | Value |
|---|---|---|
| 1hour |
Displays CPU usage statistics within the last one |
— |
| 24hour |
Displays CPU usage statistics within the last 24 |
— |
| 72hour |
Displays CPU usage statistics within the last 72 |
— |
| slave |
Displays the CPU usage statistics of |
— |
| slot slot-id |
Displays the CPU usage statistics of a specified |
The value varies with the device configuration. |
| vcpu vcpu |
Displays the CPU usage statistics of a specified |
Specify the vcpu parameter based |
Default Level
1: Monitoring level
Usage Guidelines
Usage Scenario
The system collects CPU usage
statistics at a specified interval (usually 60s) and saves them in
the historical record table. To check CPU usage statistics within
a period, run the display cpu-usage history command,
and the command output helps you determine whether the CPU is working
properly.
In the display cpu-usage history command output, the x-coordinate indicates the specified period,
and the y-coordinate indicates the CPU usage.
Precautions
If CPU usage is constantly higher than the upper alarm threshold
(95% by default) before the feature is deployed on a large scale,
check the device to troubleshoot the fault.
Example
# Display CPU usage statistics within the last one
hour.
<HUAWEI> display cpu-usage history 1hour
100%|
 95%|
 90%|
 85%|
 80%|
 75%|
 70%|
 65%|
 60%|
 55%|
 50%|
 45%|
 40%|
 35%|                  H
 30%|                  H
 25%|                  H
 20%|                  H
 15%|                  H
 10%|                  H
  5%|HHHHHHHHHHHHHHHHHHHHHHHHHHHHHHHHHHHHHHHHHHHHHHHHHHHHHHHHHHHH
     ---------+---------+---------+---------+---------+---------+>
              10        20        30        40        50        60
              System cpu-usage last 60 minutes(Per Min)
# Display CPU usage statistics within the last 24 hours.
<HUAWEI> display cpu-usage history 24hour

100%|
 95%|
 90%|
 85%|
 80%|
 75%|*
 70%|*
 65%|*
 60%|*
 55%|*
 50%|*
 45%|*
 40%|*
 35%|*                         **
 30%|*                         **
 25%|*                         **
 20%|*                         **
 15%|*                         **
 10%|H                         **
  5%|HHHHHHHHHHHHHHHHHHHHHHHHHHHHH
     ---------+---------+---------+---------+-------->
              10        20        30        40
       System cpu-usage last 24 hours(Per Halfhour)
      * = maximum cpu-usage    H = average cpu-usage
#
Display CPU usage statistics within the last 72 hours.
<HUAWEI> display cpu-usage history 72hour

100%|
 95%|
 90%|
 85%|
 80%|
 75%|*
 70%|*
 65%|*
 60%|*
 55%|*
 50%|*
 45%|*
 40%|*
 35%|*            *
 30%|*            *
 25%|*            *
 20%|*            *
 15%|*            *
 10%|*            *
  5%|HHHHHHHHHHHHHH
     ---------+---------+---------+---------+---------+---------+---------+-->
              10        20        30        40        50        60        70
                   System cpu-usage last 72 hours(Per Hour)
                  * = maximum cpu-usage    H = average cpu-usage
Table 3-4 Description of the display cpu-usage history command output
|
Item |
Description |
|---|---|
|
System cpu-usage last 60 minutes(Per Min) |
CPU usage statistics within the last one hour, with a step |
|
System cpu-usage last 24 hours(Per Halfhour) |
CPU usage statistics within the last 24 hours, with a step |
|
System cpu-usage last 72 hours(Per Hour) |
CPU usage statistics within the last 72 hours, with a step |
|
* = maximum cpu-usage |
Maximum CPU usage |
|
H = average cpu-usage |
Average CPU usage |
display device
Function
The display device command displays the type and
status of the components on a device.
Format
display device [ slot slot-id ]
Parameters
|
Parameter |
Description |
Value |
|---|---|---|
|
slot slot-id |
|
The value is an integer, and the value must |
Default Level
1: Monitoring level
Usage Guidelines
If you need to check whether a switch is working properly,
run the display device command to view hardware information
of the components and device registration status on the switch.
This command can also display the working status
of the battery or redundant power supply (RPS) used for a device.
The following product models
support the use of an RPS:
- S5720S-SI: S5720S-28P-SI-AC, S5720S-52X-SI-AC, S5720S-28X-SI-AC,
S5720S-52P-SI-AC, S5720S-28X-SI-DC, S5720S-52X-SI-DC - S5720SI: S5720-28X-SI-24S-AC, S5720-28X-SI-24S-DC
- S5720EI series: S5720-32X-EI-24S-AC, S5720-50X-EI-46S-AC,
S5720-32X-EI-AC, S5720-52X-EI-AC, S5720-50X-EI-AC, S5720-32P-EI-AC,
S5720-52P-EI-AC, S5720-32X-EI-DC, S5720-50X-EI-DC, S5720-32X-EI-24S-DC,
S5720-50X-EI-46S-DC - S5700LI series: all models except S5700-10P-LI-AC, S5700-28P-LI-BAT,
S5700-28P-LI-24S-BAT, and S5700-10P-PWR-LI-AC - S5700S-LI series: all models
- S5710-X-LI series: all models
- S5720LI series: S5720-28X-LI-AC, S5720-28X-LI-DC, S5720-28X-PWR-LI-AC,
S5720-52X-LI-AC, S5720-52X-LI-DC, S5720-52X-PWR-LI-AC, S5720-28X-LI-24S-AC,
S5720-28X-LI-24S-DC, S5720-28X-PWH-LI-AC, S5720-52X-PWR-LI-ACF - S5720S-LI series: S5720S-28X-LI-24S-AC
- S6720LI series: all models
- S6720S-LI series: all models
The following
product models support the use of a battery: S5700-28P-LI-BAT, S5700-28P-LI-24S-BAT.
Example
# Display information about the components on a device (with a built-in power supply unit or power module).
<HUAWEI> display device
S5700-52P-LI-AC's Device status:
Slot Sub  Type                Online    Power      Register     Status   Role
-------------------------------------------------------------------------------
0    -    S5700-52P-LI        Present   PowerOn    Registered   Normal   Master
# Display information about
components on a device (connected to an RPS).
<HUAWEI> display device
S5700-28X-LI-AC's Device status:
Slot  Sub  Type               Online    Power      Register     Status   Role
--------------------------------------------------------------------------------
0     -    S5700-28X-LI       Present   PowerOn    Registered   Normal   Master
           RPS                Present   PowerOn    Registered   Self-powered
# Display information
about components on a device (with a battery installed).
<HUAWEI> display device
S5700-28P-LI-24S-BAT's Device status:
Slot Sub  Type                Online    Power      Register     Status   Role
-------------------------------------------------------------------------------
0    -    S5700-28P-LI-24S    Present   PowerOn    Registered   Normal   Master
     5    BAT-4AHA            Present   PowerOn    Registered   Normal   NA
# Display information about components
on a device (where ports on the device panel and ports on subcards
cannot be used together).
<HUAWEI> display device
S6720-32C-PWH-SI-AC's Device status:
Slot Sub  Type                  Online    Power    Register     Status   Role
-------------------------------------------------------------------------------
0    -    S6720-32C-PWH-SI      Present   PowerOn  Registered   Normal   Master
     1    -                     Present   PowerOn  Unregistered -        NA
     PWR1 POWER                 Present   PowerOn  Registered   Normal   NA
     FAN1 FAN                   Present   PowerOn  Registered   Normal   NA
Info: Slot 0 is in the port-on-card disable mode, so subcard 1 is unavailable and unregistered.
# Display information about the component in slot
0.
<HUAWEI> display device slot 0
*down: administratively down

S5700-52P-LI-AC's Device status:
Slot Sub  Type                Online    Power      Register     Status   Role
-------------------------------------------------------------------------------
0    -    S5700-52P-LI        Present   PowerOn    Registered   Normal   Master
-------------------------------------------------------------------------------
  Board Type        : S5700-52P-LI
  Board Description : 48 Ethernet 10/100/1000 ports,4 Gig SFP,AC 110/220V
-------------------------------------------------------------------------------
-------------------------------------------------------------------------------
Port      Port     Optic     MDI     Speed   Duplex  Flow-    Port   PoE
          Type     Status            (Mbps)          Ctrl     State  State
------------------------------------------------------------------------------
0/0/1     GE(C)    Absent    Auto    1000    Full    Disable  Down   -
0/0/2     GE(C)    Absent    Auto    1000    Full    Disable  Up     -
0/0/3     GE(C)    Absent    Auto    1000    Full    Disable  Down   -
0/0/4     GE(C)    Absent    Auto    1000    Full    Disable  Down   -
0/0/5     GE(C)    Absent    Auto    1000    Full    Disable  Down   -
0/0/6     GE(C)    Absent    Auto    1000    Full    Disable  Down   -
0/0/7     GE(C)    Absent    Auto    1000    Full    Disable  Down   -
0/0/8     GE(C)    Absent    Auto    1000    Full    Disable  Down   -
0/0/9     GE(C)    Absent    Auto    1000    Full    Disable  Down   -
0/0/10    GE(C)    Absent    Auto    1000    Full    Disable  Down   -
0/0/11    GE(C)    Absent    Auto    1000    Full    Disable  Down   -
0/0/12    GE(C)    Absent    Auto    1000    Full    Disable  Down   -
0/0/13    GE(C)    Absent    Auto    1000    Full    Disable  Down   -
0/0/14    GE(C)    Absent    Auto    1000    Full    Disable  Down   -
0/0/15    GE(C)    Absent    Auto    1000    Full    Disable  Down   -
0/0/16    GE(C)    Absent    Auto    1000    Full    Disable  Down   -
0/0/17    GE(C)    Absent    Auto    1000    Full    Disable  Down   -
0/0/18    GE(C)    Absent    Auto    1000    Full    Disable  Down   -
0/0/19    GE(C)    Absent    Auto    1000    Full    Disable  Down   -
Table 3-5 Description of the display device command output
|
Item |
Description |
|---|---|
|
Slot |
|
|
Sub |
Card ID. The value can be:
|
|
Type |
Component type. A component can be a device, RPS, or a card. The device types are displayed as S5700-52P-LI. The -AC or -DC field is not displayed. Subcards are classified
Redundant power supply: RPS |
|
Online |
Whether a component is available. If the component is available, |
|
Power |
Power supply status. The value can be:
If the device has a battery installed,
If no lithium battery or lead-acid battery board is installed, |
|
Register |
Whether the device is registered:
|
|
Status |
Status of the component. The value can be:
If the device is connected to an RPS
|
|
Role |
Role of a component.
|
|
Board Type |
Device type. |
|
Board Description |
Device description. |
|
Port |
Number of an interface on a device. |
|
Port Type |
Type of an interface.
|
|
Optic Status |
Whether an optical module is available on an interface.
|
|
MDI |
Medium dependent interface (MDI) type, which can be any
If this field displays -, the MDI type of the interface |
|
Speed (Mbps) |
Interface speed. |
|
Duplex |
Duplex mode of an interface.
To set the duplex mode for an interface, run the duplex command. |
|
Flow-Ctrl |
Flow control status on an interface.
To configure flow control, run the flow-control command. |
|
Port State |
Status of an interface:
|
|
PoE State |
Status of the PoE function on an interface.
|
display device capability
Function
The display device capability command
displays the hardware and software capabilities of a device.
Only the S5720EI supports this command.
Format
display device capability [ slot slot-id ]
Parameters
| Parameter | Description | Value |
|---|---|---|
| slot slot-id |
|
In a stack, the value is an integer and must be |
Default Level
1: Monitoring level
Usage Guidelines
Usage Scenario
Whether a device supports
a function depends on whether the hardware has the capability of the
function and whether the running system software provides this function.
You can use this command to check the hardware and software support
for a function and determine whether you need to update the system
software or use other methods to obtain the function.
Precautions
Currently, this command can only display the hardware and
software support for the MPLS feature.
Example
# Display the hardware and software capabilities of
a device.
<HUAWEI> display device capability
Slot  Feature  Hardware  Software
--------------------------------------------------------
0     MPLS     NO        YES
--------------------------------------------------------
Table 3-6 Description of the display device capability command
output
|
Item |
Description |
|---|---|
|
Slot |
Slot ID. |
|
Feature |
Name of a feature. Currently, the feature name can only |
|
Hardware |
Hardware support for the feature. |
|
Software |
Software support for the feature. |
display device manufacture-info
Function
The display device manufacture-info command displays manufacture information about the device.
Format
display device manufacture-info [ slot slot-id ]
Parameters
|
Parameter |
Description |
Value |
|---|---|---|
| slot slot-id |
|
|
Default Level
1: Monitoring level
Usage Guidelines
You can run the display device manufacture-info command to view manufacture information about the device, including
the serial number and manufacture date. The command
output contains information about only service subcards and does not
contain information about fans and power
modules.
Example
# Display manufacture information about the device.
<HUAWEI> display device manufacture-info
Slot  Sub  Serial-number          Manu-date
- - - - - - - - - - - - - - - - - - - - - -
0     -    2102353169107C800132   2011-08-24
      1    021ESN1234567890       2000-01-01
# Display manufacture information about devices in
a stack.
<HUAWEI> display device manufacture-info
Slot  Sub  Serial-number          Manu-date
- - - - - - - - - - - - - - - - - - - - - -
0     -    2102353169107C800132   2011-08-24
      1    021ESN1234567890       2000-01-01
3     -    2102353170107C800132   2011-08-23
4     -    2102353170107C800132   2011-08-23
      1    020WYG1234567892       2010-12-02
8     -    2102353170107C800235   2000-01-01
Table 3-7 Description of the display device manufacture-info command
output
|
Item |
Description |
|---|---|
| slot | Stack ID. |
| Sub | Subcard number. |
| Serial-number | Serial number. |
| Manu-date | Manufacture date of the device. |
display diagnostic-information
Function
The display diagnostic-information command
collects and displays all the current diagnostic information or saves
diagnostic information in a specified file.
Format
display diagnostic-information [ acl | ap | arp | bfd | defend | dhcp | l2adp | l3adp | lbdt | lldp | mcast | mpls | qos | rrpp | sdk | smlk | srm | sta | stack | stat | stp | ucm ] [ file-name ]
- The S1720 does not support defend.
-
Only the S5720S-SI, S5720SI, S5720EI, S5720HI, S5730SI, S5730S-EI, S6720SI, S6720S-SI,
S6720S-EI, and S6720EI support bfd. -
Only the S5720EI, S5720HI, S6720S-EI, and S6720EI support mpls.
-
Among S5720EI switches
running V200R009C00 and later versions, only some switches support
the MPLS feature. Run the display device capability command on the switch to check the switch’s software and hardware
capabilities. The switch supports the MPLS feature only when chips
also support the MPLS feature. -
Only the S5720EI, S5720HI, S6720S-EI, and S6720EI support sdk.
-
The stack parameter is supported
on a stack only. -
Only the S5720HI supports ap and sta.
Parameters
|
Parameter |
Description |
Value |
|---|---|---|
| acl |
Displays ACL information. |
— |
| ap |
Displays AP information. |
— |
| arp |
Displays ARP information. |
— |
| bfd |
Displays BFD information. |
— |
| defend |
Displays attack defense information. |
— |
| dhcp |
Displays DHCP information. |
— |
| l2adp |
Displays L2 information. |
— |
| l3adp |
Displays L3 information. |
— |
| lbdt |
Displays LBDT information. |
— |
| lldp |
Displays LLDP information. |
— |
| mcast |
Displays multicast information. |
— |
| mpls |
Displays MPLS information. |
— |
| qos |
Displays QoS information. |
— |
| rrpp |
Displays RRPP information. |
— |
| sdk |
Displays sdk information. |
— |
| smlk |
Displays Smart Link information. |
— |
| stack |
Displays stack information. |
— |
| srm |
Displays device information. |
— |
| sta |
Displays STA information. |
— |
| stat |
Displays basic statistic information. |
— |
| stp |
Displays STP information. |
— |
| ucm |
Displays UCM module information. |
— |
|
file-name |
Specifies the name of the file where diagnostic information |
The value is a string of 5 to 64 characters. The file name |
Default Level
1: Monitoring level
Usage Guidelines
Usage Scenario
When a fault occurs in the
system, you can use the display diagnostic-information command to collect diagnostic information for fault location.
The display diagnostic-information command
output includes the output for multiple display commands, such
as display clock, display version, and display current-configuration. Running the display diagnostic-information command is like running
these display commands in batches.
Precautions
- If the file-name parameter is not specified,
diagnostic information is only displayed on the screen. If the file-name parameter is specified, diagnostic information
is only stored to a specified file but not displayed on the screen, and the command level is management level (3). -
If this command displays a long output, press Ctrl+C to abort this command.
-
This command displays diagnostic information, which helps locate
faults but may affect system performance. For example, CPU usage may
become high. Therefore, do not use this command when the system is
running properly. -
Running the display diagnostic-information command simultaneously
on multiple terminals connected to the device is prohibited. This
is because CPU usage of the device may obviously increase and the
device performance may be degraded. -
When you run this command, the device obtains or uses some
personal data of users, such as the STA MAC address. Delete the personal
data immediately after the command is executed to ensure user data
security.
Example
# Display diagnostic information about the device.
<HUAWEI> display diagnostic-information
===========================================================
  ===============display interface brief===============
===========================================================
PHY: Physical
*down: administratively down
#down: LBDT down
(l): loopback
(s): spoofing
(E): E-Trunk down
(b): BFD down
(e): ETHOAM down
(dl): DLDP down
(lb): LBDT block
InUti/OutUti: input utility/output utility
Interface                   PHY   Protocol  InUti OutUti   inErrors  outErrors
Eth-Trunk5                  down  down         0%     0%          0          0
Eth-Trunk9                  down  down         0%     0%          0          0
GigabitEthernet0/0/1        *down down         0%     0%          0          0
GigabitEthernet0/0/2        *down down         0%     0%          0          0
GigabitEthernet0/0/3        *down down         0%     0%          0          0
GigabitEthernet0/0/4        *down down         0%     0%          0          0
GigabitEthernet0/0/5        up    up           0%     0%          0          0
GigabitEthernet0/0/6        *down down         0%     0%          0          0
GigabitEthernet0/0/7        down  down         0%     0%          0          0
GigabitEthernet0/0/8        *down down         0%     0%          0          0
GigabitEthernet0/0/9        down  down         0%     0%          0          0
GigabitEthernet0/0/10       down  down         0%     0%          0          0
GigabitEthernet0/0/11       up    up           0%     0%          0          0
GigabitEthernet0/0/12       down  down         0%     0%          0          0
GigabitEthernet0/0/13       down  down         0%     0%          0          0
GigabitEthernet0/0/14       down  down         0%     0%          0          0
GigabitEthernet0/0/15       down  down         0%     0%          0          0
GigabitEthernet0/0/16       down  down         0%     0%          0          0
GigabitEthernet0/0/17       down  down         0%     0%          0          0
GigabitEthernet0/0/18       down  down         0%     0%          0          0
GigabitEthernet0/0/19       down  down         0%     0%          0          0
GigabitEthernet0/0/20       *down down         0%     0%          0          0
GigabitEthernet0/0/21       down  down         0%     0%          0          0
GigabitEthernet0/0/22       *down down         0%     0%          0          0
GigabitEthernet0/0/23       down  down         0%     0%          0          0
GigabitEthernet0/0/24       up    up           0%     0%          0          0
......
# Save diagnostic information to the
file aa.txt in the flash memory.
<HUAWEI> display diagnostic-information aa.txt
Now saving the diagnostic information to the device
 100%
Info: The diagnostic information was saved to the device successfully.
display elabel
Function
The display elabel command displays
the electronic label of the device.
Format
display elabel [ slot slot-id [ subcard-id ] ]
Parameters
|
Parameter |
Description |
Value |
|---|---|---|
|
slot slot-id |
Specifies a slot ID |
The value depends |
| subcard-id |
Specifies the subcard ID. This parameter can be specified |
The value must be set according to the device configuration. |
Default Level
1: Monitoring level
Usage Guidelines
Electronic labels identify the hardware. You can use the display elabel command to view the electronic label information.
No electronic label is displayed for an electrical interface or a combo interface working
as an electrical interface.
For a new device
delivered since V200R011, its electronic label version has been updated
to version 4.0, which has the following changes compared to earlier
versions:
- The Model field is added to indicate the hardware external model
of the device. - The ExInfo field is added to indicate the hardware extension information
of the device. This field does not exist in electronic labels of optical
modules. - The ElabelVersion is added to indicate the version of the elabel.
Example
# Display the electronic label of the
device with stack ID 0.
<HUAWEI> display elabel slot 0
/$[System Integration Version]
/$SystemIntegrationVersion=3.0


[Slot_0]
/$[Board Integration Version]
/$BoardIntegrationVersion=3.0


[Main_Board]

/$[ArchivesInfo Version]
/$ArchivesInfoVersion=3.0


[Board Properties]
BoardType=S5752S-LI
BarCode=2102353174107C800132
Item=
Description=S5752S-LI Mainframe(48 10/100/1000 BASE-T ports  and 4 SFP GE (100/1
000 BASE-X) ports (SFP Req.) and DC -48V)
Manufactured=2011-08-22
VendorName=Huawei
IssueNumber=
CLEICode=
BOM=


[Port_GigabitEthernet0/0/1]
/$[ArchivesInfo Version]
/$ArchivesInfoVersion=3.0


[Board Properties]
BoardType=
BarCode=
Item=
Description=
Manufactured=
/$VendorName=
IssueNumber=
CLEICode=
BOM=
Table 3-8 Description of the display elabel command output
|
Item |
Description |
|---|---|
|
BoardIntegrationVersion |
Version of the board software integration format. |
|
ArchivesInfoVersion |
Electronic label information version. |
|
SystemIntegrationVersion |
Version of the host software integration format. |
|
BoardType |
Vendor’s |
|
BarCode |
Bar code of the specified component. |
|
Item |
BOM code of the specified component. |
|
Description |
English description of the specified component. |
|
Manufactured |
Production date of the specified component. |
|
VendorName |
Vendor name of the specified component. |
|
IssueNumber |
Issuing number of the specified component. |
|
CLEICode |
CLEI code of the specified component. |
|
BOM |
Sales BOM code of the specified component, which is an item |
display esn
Function
The display esn command displays the
Equipment Serial Number (ESN) of a device.
The S2750EI, S5700LI, S5700S-LI,
and S5720EI do not support this command.
Default Level
1: Monitoring level
Usage Guidelines
An ESN uniquely identifies a device.
In a stack, the display esn command
displays the ESNs of all member devices.
Example
# Display the
ESN of the device.
<HUAWEI> display esn
ESN of slot 0: 21023586001234567890
Table 3-9 Description of the display esn command output
|
Item |
Description |
|---|---|
|
ESN of slot 0 |
SN of the device with the slot ID 0. |
display fan
Function
The display fan command displays the fan status.
Default Level
1: Monitoring level
Usage Guidelines
Devices can run properly when fans are working properly.
If proper heat dissipation cannot be ensured for devices, devices
may overheat, damaging the hardware. You can use the display fan command to view the fan status.
Different device models may support different number of fans.
Example
# Display the fan status of the device.
<HUAWEI> display fan
-------------------------------------------------------------------------
 Slot  FanID   Online    Status    Speed     Mode     Airflow
-------------------------------------------------------------------------
 0     1       Absent    -         -         -        -
 0     2       Present   Normal    100%      AUTO     Side-to-Side
 0     3       Absent    -         -         -        -
Table 3-10 Description of the display fan command output
| Item | Description |
|---|---|
|
Slot |
|
|
FAN |
Number of a fan. |
|
Online |
Check whether a fan is available.
|
|
Status |
Running status of a fan.
|
|
Speed |
Percentage of the current fan speed to the full speed. If |
|
Mode |
Working mode of a fan.
|
|
Airflow |
Airflow direction of a fan.
|
display memory-usage
Function
The display memory-usage command displays the memory
usage of the device.
Format
display memory-usage [ slave | slot slot-id ] [ vcpu vcpu ]
The slave parameter is not supported if the switch does not support the stacking
function or does not have the stacking function enabled.
Only the S5720HI supports the vcpu vcpu parameter.
Parameters
| Parameter | Description | Value |
|---|---|---|
| slave |
Displays memory usage of a slave |
— |
| slot slot-id |
|
The |
| vcpu vcpu |
Specifies the virtual CPU number. |
Specify the vcpu parameter based |
Default Level
1: Monitoring level
Usage Guidelines
Memory usage is an important index to evaluate device
performance. A high memory usage will cause service faults. You can
use the display memory-usage command to view memory usage to
check whether devices are working properly.
Example
# Display memory usage of the current device.
<HUAWEI> display memory-usage
 Memory utilization statistics at 2008-12-15 15:17:42+08:00
 System Total Memory Is: 394152720 bytes
 Total Memory Used Is: 130975664 bytes
 Memory Using Percentage Is: 33%
Table 3-11 Description of the display memory-usage command
output
|
Item |
Description |
|---|---|
|
Memory utilization statistics at |
Time when memory usage is collected. |
|
System Total Memory |
Total memory of the device network operating system. |
|
Total Memory Used |
Total used memory of the device network operating system. |
|
Memory Using Percentage |
Memory usage. |
display memory-usage threshold
Function
The display memory-usage threshold command
displays the memory usage threshold on the device.
Format
display memory-usage threshold [ slot slot-id ]
Parameters
| Parameter | Description | Value |
|---|---|---|
| slot slot-id |
Displays the |
The value is 0 if stacking is not configured; the value ranges from |
Default Level
2: Configuration
level
Usage Guidelines
You can view the memory usage alarm threshold to learn
about the conditions for triggering alarms.
- When memory usage reaches the alarm threshold, the system generates
an alarm. - When memory usage falls within the alarm threshold, the system
generates a clear alarm.
Example
# Display the memory usage threshold on the main control board.
<HUAWEI> display memory-usage threshold
 Current memory threshold of the main board is 95%.
Table 3-12 Description of the display memory-usage threshold command output
|
Item |
Description |
|---|---|
|
Current memory threshold of the main board is 95%. |
The memory usage threshold of the main control board is |
display power
Function
The display power command displays the information
of all power supply units and
battery on the device.
Default Level
1: Monitoring level
Usage Guidelines
You can use this command to check the status of all power
supply units and battery, and their power. The following
product models support the use of a battery: S5700-28P-LI-BAT, S5700-28P-LI-24S-BAT.
No information is displayed
for built-in power supplies.
Example
# Display the current power supply status.
<HUAWEI> display power
------------------------------------------------------------
 Slot    PowerID  Online   Mode   State      Power(W)
------------------------------------------------------------
 0       PWRI     Present  AC     Supply     500.00
 0       PWRII    Absent   -      -          -
# Display the status of the battery used on the
device.
<HUAWEI> display power
------------------------------------------------------------
 Slot    PowerID  Online   Mode   State      Power(W)
------------------------------------------------------------
 0       PWRI     Present  BAT    Charge     80.00
Table 3-13 Description of the display power command output
| Item | Description |
|---|---|
|
Slot |
|
|
PowerID |
ID of a power supply slot:
On the S5720S-SI, S5720SI, S5720EI, S5720HI, S5730SI, S5730S-EI, S6720SI, S6720S-SI, |
|
Online |
Whether a power supply is installed properly.
|
|
Mode |
Type of the power module, lithium
|
|
State |
Working status of a power module or battery.
|
|
Power(W) |
Rated power of a power supply. – indicates that the power |
display transceiver
Function
The display transceiver command displays information
about the optical module on an interface.
The command displays only information about optical interfaces.
Format
display transceiver [ interface interface-type interface-number | slot slot-id ] [ verbose ]
Parameters
|
Parameter |
Description |
Value |
|---|---|---|
|
interface interface-type interface-number |
Specifies the type and number of an interface.
|
— |
|
slot slot-id |
|
The value range depends on the |
|
verbose |
Displays detailed information about the optical module on |
— |
Default Level
1: Monitoring level
Usage Guidelines
You can run this command to view general information,
manufacture information, and alarm information about an optical module.
If you specify the verbose keyword, diagnostic
information is also displayed in addition to the preceding information.
If a device does not support optical modules, a
message will be displayed after you run this command.
Some parameters
including the current and optical power will be displayed for each
lane of the 40GE interfaces.
Example
# Display general information, manufacture information,
and alarm information about the optical module on a specified interface.
<HUAWEI> display transceiver interface gigabitethernet 0/0/1
GigabitEthernet0/0/1 transceiver information:
-------------------------------------------------------------
Common information:
  Transceiver Type               :1000_BASE_SX_SFP
  Connector Type                 :LC
  Wavelength(nm)                 :850
  Transfer Distance(m)           :0(9um),300(50um),150(62.5um)
  Digital Diagnostic Monitoring  :YES
  Vendor Name                    :HUAWEI
  Vendor Part Number             :02318169
  Ordering Name                  :
-------------------------------------------------------------
Manufacture information:
  Manu. Serial Number            :CD25HP12M
  Manufacturing Date             :2013-06-184
  Vendor Name                    :HUAWEI
-------------------------------------------------------------
# Display general information, manufacture information,
alarm information and diagnostic information about the optical module
on a specified interface.
<HUAWEI> display transceiver interface gigabitethernet 0/0/3 verbose
GigabitEthernet0/0/3 transceiver information:
-------------------------------------------------------------
Common information:
  Transceiver Type               :GPS_SFP
  Connector Type                 :SMA Coaxial Connector
  Wavelength(nm)                 :-
  Transfer Distance(m)           :100(copper)
  Digital Diagnostic Monitoring  :NO
  Vendor Name                    :HUAWEI
  Vendor Part Number             :HUAWEI AE 905S A
  Ordering Name                  :
-------------------------------------------------------------
Manufacture information:
  Manu. Serial Number            :031TUX10HB000065
  Manufacturing Date             :2017-11-28
  Vendor Name                    :HUAWEI
-------------------------------------------------------------
Diagnostic information:
  Temperature(¡ãC)              :26.00
  Temp High Threshold(¡ãC)      :85.00
  Temp Low  Threshold(¡ãC)      :-40.00
  Voltage(V)                    :3.29
  Volt High Threshold(V)        :3.64
  Volt Low  Threshold(V)        :2.95
  Bias Current(mA)              :4.57
  Bias High Threshold(mA)       :9.00
  Bias Low  Threshold(mA)       :2.00
  RX Power(dBM)                 :-40.00
  RX Power High Threshold(dBM)  :0.00
  RX Power Low  Threshold(dBM)  :-16.99
  TX Power(dBM)                 :-5.03
  TX Power High Threshold(dBM)  :-2.22
  TX Power Low  Threshold(dBM)  :-6.99
  Transceiver phony alarm       :Yes
-------------------------------------------------------------
Table 3-14 Description of the display transceiver command output
|
Item |
Description |
|---|---|
|
Common information |
Generic information about the optical module. |
|
Transceiver Type |
Type of the optical module. |
|
Connector Type |
Type of the fiber connector required by the optical module. |
|
Wavelength (nm) |
Wavelength of the optical module. |
|
Transfer Distance (m) |
Transmission distance of the optical module. 50 um and 62.5 |
|
Digital Diagnostic Monitoring |
Whether diagnostic information about the optical module |
|
Vendor Name |
Vendor name of the optical module. If the system has not If the vendor name of an optical |
|
Vendor Part Number |
The vendor part number or product name. If the system has |
|
Ordering Name |
External name of the optical module. Currently, this field |
|
Manufacture information |
Manufacture information of the optical module. |
|
Manu. Serial Number |
Vendor sequence number of the optical module. |
|
Manufacturing Date |
Manufacturing date of the optical module. |
|
Diagnostic information |
Diagnostic information about the optical module. |
|
Temperature (°C) |
Current temperature of the optical module. |
|
Temp High Threshold (°C) |
Upper temperature threshold for the optical module. |
|
Temp Low Threshold (°C) |
Lower temperature threshold for the optical module. |
|
Voltage (V) |
Current voltage of the optical module. |
|
Volt High Threshold(V) |
Upper voltage threshold for the optical module. |
|
Volt Low Threshold(V) |
Lower voltage threshold for the optical module. |
|
Bias Current (mA) |
Bias current of the optical module. |
|
Bias High Threshold (mA) |
Upper threshold for the bias current of the optical module. |
|
Bias Low Threshold (mA) |
Lower threshold for the bias current of the optical module. |
|
RX Power (dBM) |
Input power of the optical module. when the Input power |
|
RX Power High Warning(dBM) |
Upper warning threshold for the receive power of the optical |
|
RX Power Low Warning(dBM) |
Lower warning threshold for the receive power of the optical |
|
RX Power High Threshold (dBM) |
Upper input power threshold for the optical module. |
|
RX Power Low Threshold (dBM) |
Lower input power threshold for the optical module. |
|
TX Power (dBM) |
Output power of the optical module. when the output power |
|
TX Power High Warning(dBM) |
Upper warning threshold for the transmit power of the optical |
|
TX Power Low Warning(dBM) |
Lower warning threshold for the transmit power of the optical |
|
TX Power High Threshold (dBM) |
Upper output power threshold for the optical module. |
|
TX Power Low Threshold (dBM) |
Lower output power threshold for the optical module. |
| Transceiver phony alarm:Yes | The device has generated an alarm on an optical module not certified for Huawei switches. This field is displayed only when the following conditions are met:
|
display transceiver diagnosis interface
Function
The display transceiver diagnosis interface command
displays the diagnosis parameters of an optical transceiver.
Format
display transceiver diagnosis interface [ interface-type interface-number ]
Parameters
|
Parameter |
Description |
Value |
|---|---|---|
|
interface-type interface-number |
Specifies the type and number of an interface.
|
— |
Default Level
1: Monitoring level
Usage Guidelines
You can run the display transceiver diagnosis interface command to check the digital diagnostic monitoring (DMM) information
about an optical module.
Example
# Display the diagnosis parameters of the optical module
installed on GigabitEthernet0/0/4.
<HUAWEI> display transceiver diagnosis interface gigabitethernet 0/0/4
Port GigabitEthernet0/0/4 transceiver diagnostic information:
Parameter        Current     Low Alarm    High Alarm
  Type            Value      Threshold    Threshold    Status
-------------   ---------    ---------    ----------   --------
TxPower(dBm)    -4.64        0.00         0.00         abnormal
RxPower(dBm)    -4.37        33.00        0.00         abnormal
Current(mA)     7.42         0.00         0.00         abnormal
Temp.(ºC)       30.00        0.00         0.00         abnormal
Voltage(V)      3.28         0.00         8.19         normal
Table 3-15 Description of the display transceiver diagnosis interface command output
|
Item |
Description |
|---|---|
|
Parameter Type |
Parameter type:
|
|
Current Value |
Current value of a parameter. |
|
Low Alarm Threshold |
Lower alarm threshold of a parameter. |
|
High Alarm Threshold |
Upper alarm threshold of a parameter. |
|
Status |
Status of the optical transceiver:
|
display temperature
Function
The display temperature command displays the device
temperature.
Format
display temperature { all | slot slot-id }
Parameters
| Parameter | Description | Value |
|---|---|---|
| all |
Displays temperature of all slots on the device. |
— |
| slot slot-id |
Displays temperature of the specified slot. |
The value is an integer, and the value must |
Default Level
1: Monitoring level
Usage Guidelines
A high or low device temperature may damage the hardware.
This command displays the current device temperature instead of the
operating temperature that indicates the temperature range of the
surrounding environment. When the device temperature exceeds the upper
threshold or falls below the lower threshold, the device generates an alarm to alert you that the device temperature
is abnormal.
Example
# Display the temperature of all slots.
<HUAWEI> display temperature all
-------------------------------------------------------------------------------
 Slot  Card  Sensor Status    Current(C) Lower(C) Lower     Upper(C) Upper
                                                  Resume(C)          Resume(C)
-------------------------------------------------------------------------------
 0     NA    NA     Normal     44        0        4         72       68
Table 3-16 Description of the display temperature command output
|
Item |
Description |
|---|---|
|
Slot |
Slot ID. |
|
Card |
Subcard ID. This field is invalid on |
|
Sensor |
Number of a sensor on a card. This field |
|
Status |
Temperature status of a device.
|
|
Current(C) |
Current temperature of a device, expressed in the centigrade scale (°C). This field displays — when the sensor is abnormal |
|
Lower(C) |
Low-temperature alarm threshold, expressed in the centigrade To set the |
|
Lower Resume(C) |
Low-temperature alarm clear threshold, expressed in the To set the low-temperature alarm clear threshold, run the temperature threshold command. The low-temperature alarm clear threshold is 4°C |
|
Upper(C) |
High-temperature alarm threshold, expressed in the centigrade To set the On the devices |
|
Upper Resume(C) |
High-temperature alarm clear threshold, expressed in the To set the high-temperature alarm clear threshold, run the temperature threshold command. The high-temperature alarm clear threshold is 4°C |
display version
Function
The display version command displays the device
version.
Format
display version [ slot slot-id ]
Parameters
| Parameter | Description | Value |
|---|---|---|
| slot slot-id |
|
The |
Default Level
1: Monitoring level
Usage Guidelines
You can use the display version command to view
the device version to determine whether the device needs to be upgraded.
Example
# Display the device version.
<HUAWEI> display version
Huawei Versatile Routing Platform Software
VRP (R) software, Version 5.170 (S6720 V200R011C10)
Copyright (C) 2000-2017 HUAWEI TECH Co., Ltd.
HUAWEI S6720-54C-EI-48S-AC Routing Switch uptime is 0 week, 0 day, 0 hour, 5 minutes

ES5D2S50Q002 1(Master)  : uptime is 0 week, 0 day, 0 hour, 2 minutes
DDR             Memory Size : 2048  M bytes
FLASH Total     Memory Size : 512   M bytes
FLASH Available Memory Size : 446   M bytes
Pcb           Version   : VER.B
BootROM       Version   : 020b.0001
BootLoad      Version   : 020b.0001
CPLD          Version   : 0108
Software      Version   : VRP (R) Software, Version 5.170 (V200R011C10)
CARD1 information
Pcb           Version   : ES5D21Q04Q01 VER.A
CPLD   Version          : 0105
PWR2 information
Pcb           Version   : PWR VER.A
FAN1 information
Pcb           Version   : NA
Table 3-17 Description of the display version command output
|
Item |
Description |
|---|---|
|
Huawei Versatile Routing Platform Software |
— |
|
VRP (R) software, Version |
Versions of the VRP and the software of the device. |
|
Copyright (C) 2000-2017 HUAWEI TECH Co., Ltd. |
Huawei copyright. |
|
Routing Switch uptime |
System power-on time. |
|
ES5D2S50Q002 1(Master) : uptime |
Hardware type, role, and startup time of the device.
NOTE: The names in the instance are taken as an example. |
|
DDR Memory Size |
Device’s physical memory capacity, which stores data The System Total Memory field value displayed using the display memory-usage command is part of |
|
FLASH Total Memory Size |
Total size of the flash memory. |
|
FLASH Available Memory Size |
Available flash memory size.
This value is the total field value displayed using the dir command divided by 1024. |
|
Pcb Version |
Version of the printed circuit board (PCB). |
|
BootROM Version |
Version of the BootROM software. |
|
BootLoad Version |
Version of the BootLoad software.
NOTE: This field can be not displayed |
|
CPLD Version |
Version of the complex programmable logic device (CPLD). |
|
MCU Version |
Micro Control Unit ( MCU) version.
NOTE: The information is displayed only for the S5720-16X-PWH-LI-AC, |
|
Software Version |
Versions of the VRP and the software of the device. |
|
CARD1 information |
Information about a front card. If no front card is available, this field is not displayed. |
|
CARD2 information |
Information about a rear card. If no rear card is available, this field is not displayed. |
|
FAN1 information |
Information about a pluggable fan module. If pluggable fan module is available, this field is not displayed. If a pluggable fan module does not have an electronic label, its PCB version is displayed as NA. |
|
PWR2 information |
Information about a pluggable power module. If no pluggable power module is available, this field is not displayed. If a pluggable power module does not have an electronic label, its PCB version is displayed as NA. |
|
RPS Version |
RPS management software version. If the device does not support RPS, this information is not displayed. |
- Command Support
- display compatible-information
- display cpu-usage
- display cpu-usage configuration
- display cpu-usage history
- display device
- display device capability
- display device manufacture-info
- display diagnostic-information
- display elabel
- display esn
- display fan
- display memory-usage
- display memory-usage threshold
- display power
- display transceiver
- display transceiver diagnosis interface
- display temperature
- display version
Checking Service Interface Indicators to Determine the Interface Status
Observe service interface indicators to quickly identify the service interface status. The following uses the S6730-H48X6C as an example. In Figure 1-1, the indicator numbered 4 is a 10GE optical interface indicator, and the indicator numbered 5 is a 40GE/100GE optical interface indicator.
Figure 1-1 Service interface indicators on the S6730-H48X6C
Table 1-1 Service interface indicators
|
Color |
Status |
Description |
|---|---|---|
|
— |
Steady off |
The interface is not connected or has been shut down. The interface cannot send or receive packets normally. |
|
Green |
Steady on |
A link has been established on the interface. |
|
Green |
Blinking |
The interface is sending or receiving data. |
|
Yellow |
Blinking |
The interface is sending or receiving data. |
Running the display interface brief or display interface interface-type interface-number Command to Check the Interface Physical Status
You can run the display interface brief command in any view to check the physical status of all interfaces (based on the PHY field in the command output).
<HUAWEI> display interface brief
PHY: Physical   //Physical status of the interface
*down: administratively down
^down: standby
~down: LDT down
#down: LBDT down
(l): loopback
(s): spoofing
(E): E-Trunk down
(b): BFD down
(e): ETHOAM down
(dl): DLDP down
(d): Dampening Suppressed
(ld): LDT block
(lb): LBDT block
(lp): Loop-detect block
(ms): MACsec down
(o): Observe-port forwarding down
InUti/OutUti: input utility/output utility
Interface                   PHY   Protocol InUti OutUti   inErrors  outErrors
Ethernet0/0/0               up    up       0.01%  0.01%          0          0
GigabitEthernet1/0/0        down  down        0%     0%          0          0
GigabitEthernet1/0/1        down  down        0%     0%          0          0
GigabitEthernet1/0/2        down  down        0%     0%          0          0
GigabitEthernet1/0/3        down  down        0%     0%          0          0
GigabitEthernet1/0/4        down  down        0%     0%          0          0
GigabitEthernet1/0/5        down  down        0%     0%          0          0
GigabitEthernet1/0/6        up    up          0%     0%          0          0
GigabitEthernet1/0/7        up    up          0%     0%          0          0
GigabitEthernet1/0/8        up    up          0%     0%          0          0
GigabitEthernet1/0/9        up    up          0%     0%          0          0
GigabitEthernet1/0/10       down  down        0%     0%          0          0
...
Alternatively, run the display interface interface-type interface-number command in any view to check the physical status of a specified interface (based on the current state field in the command output).
<HUAWEI> display interface gigabitethernet 0/0/12
GigabitEthernet0/0/12 current state : Administratively DOWN
Line protocol current state : DOWN
Description:
Switch Port, Link-type : access(negotiated),
PVID :1, TPID : 8100(Hex), The Maximum Frame Length is 9216
IP Sending Frames' Format is PKTFMT_ETHNT_2, Hardware address is 000b-0974-a475
Last physical up time: 2013-08-10 21:09:51
Last physical down time : 2013-08-10 21:10:51
Current system time: 2013-08-10 21:15:06
Port Mode: COMMON FIBER
Speed : 1000,Loopback: NONE
Duplex: FULL,Negotiation: ENABLE
Mdi: -,Flow-control: DISABLE
Last 300 seconds input rate 96 bits/sec, 0 packets/sec
Last 300 seconds output rate 96 bits/sec, 0 packets/sec
Input peak rate 15184 bits/sec, Record time: 2013-08-10 17:45:05
Output peak rate 15184 bits/sec, Record time: 2013-08-10 17:45:05
In the preceding command output, the physical status of GE0/0/12 is Administratively DOWN, indicating that the shutdown command has been run on the interface. To enable the interface to go up, run the undo shutdown command in the interface view.
- For a Layer 2 physical interface (an Ethernet interface works at Layer 2 mode by default): If its physical status indicated by the current state field displays up, its protocol status indicated by the Line protocol current state field displays up. For example, if a Layer 2 physical interface is connected correctly and its attribute configuration is correct, its physical status and protocol status are both up.
- For a Layer 3 physical interface (The undo portswitch command has been run on the interface to change the working mode of the interface from Layer 2 mode to Layer 3 mode): Its protocol status indicated by the Line protocol current state field displays up only when its physical status indicated by the current state field displays up and its protocol negotiation succeeds. For example, if a Layer 3 physical interface is connected correctly, its attribute configuration is correct, and it is not configured with an IP address, its physical status and protocol status are up and down respectively.
The following table lists more commands for checking interface configurations or statistics.
|
Command |
Description |
|---|---|
|
display interface counters |
Display statistics about packets sent or received on physical interfaces. |
|
display interface ethernet brief |
Display brief information about Ethernet interfaces, including the physical status, auto-negotiation mode, duplex mode, rate, and average bandwidth usages in the inbound and outbound directions in the recent period. |
|
display counters error |
Display error packet statistics on interfaces. |
|
display error-down recovery |
Display information about the interfaces in error-down state, including the interface name, cause of the error-down event, delay after which an interface changes to up, and remaining time for the up event. |
Checking Interface Logs to Identify the Interface Status
You can run the display logbuffer command in any view to check interface logs. For example, if the following log information of the IFNET module is displayed, interfaces GigabitEthernet1/0/1 and GigabitEthernet3/0/0 are down.
Apr 15 2014 03:46:10-05:13 dgg62aslhw3i %%01IFNET/4/IF_STATE(l)[47]:Interface GigabitEthernet1/0/1 has turned into DOWN state.
Apr 15 2014 03:45:31-05:13 dgg62aslhw3i %%01IFNET/4/IF_STATE(l)[49]:Interface GigabitEthernet3/0/0 has turned into DOWN state.
Несколько часто используемых команд:
system-view — привелегированый режим
save – запись текущих настроек в энергонезависимую память устройства;
undo — отмена команды
display this — показ текущей конфигурации
display current-configuration – вывод текущего файла конфигурации
quit — выход
—
Создание vlan
vlan 1
description примечание для пользователей
quit
vlan 2
description для управления
management-vlan
quit
vlan 3
description супервлан
supervlan
aggregate-vlan
access-vlan 1 2
management-vlan
quit
Добавление интерфейса в vlan
interface Vlanif 1
ip address 192.168.1.2 255.255.255.0
quit
—
Маршрут по умолчанию
ip route 0.0.0.0 0.0.0.0 192.168.1.1
—
SNMP
Настроим SNMP:
snmp-agent
snmp-agent sys-info version v2c
snmp community read КОМЬЮНИТИ
Чтобы принимались простые community введем команду:
snmp-agent community complexity-check disable
—
Http
http secure-server enable
http server enable
display http server
Если возникнет ошибка «Error: Starting the HTTP server failed.«,
то значет не загружен web пакет который является web-интерфейсом (http сервером).
Посмотрим какие есть файлы в памяти коммутатора следующей командой
(нам нужен файл заканчивающийся расширением .web.zip):
dir
Если файла нету, то его необходимо закачать в память коммутатора.
Когда он будет находится в памяти коммутатора, запустим его командой:
http server load flash:/имя_файла.web.zip
Теперь включим его командами:
http secure-server enable
http server enable
http secure-server ssl-policy 1
—
Таблица аналогов CISCO-вских команд у HUAWEI
| CISCO | HUAWEI |
| ping | ping |
| traceroute | tracert |
| show | display |
| show interfaces | display interface |
| Show ip route | display routing-table |
| Show ip interface | Display ip interface |
| Show version | Display version |
| Show ip bgp | Display bgp routing-table |
| Show clock | Display clock |
| Show port | Display port-mapping |
| Show flash | dir flash: (on user view mode) |
| Show logging | Display logbuffer |
| Show snmp | Display snmp-agent statistics |
| Show frame-relay pvc | Display fr pvc-info |
| Show users | Display users |
| Show terminal length | screen-length disable |
| undo screen-length disable | |
| enable | Super |
| disable | Super 0 (number is privilege level from 0 to 3, where 3 is default and equivalent to “enable” on Cisco) |
| Conf t | System-view |
| exit | quit |
| end | return |
| Show policy-map interface | Display qos policy interface |
| send | send (on user view mode) |
| write terminal (sh run) | display current-configuration |
| Sh startup | Display saved-configuration |
| [no equivalent: shows the files used for startup] | Display startup |
| Write erase | Reset saved-configuration |
| Write mem (or wr or copy run start) | save |
| clear counters | reset (on user view mode) |
| Reset counters interface | |
| ? | ? |
| telnet | telnet |
| Enable secret (conf mode) | Super pass cipher (system mode) |
| Term mon | term debu |
| clock | clock |
| no | undo |
| debug / no debug | debugging / undo debugging |
| copy running-config | Save safely |
| terminal monitor | terminal monitor |
| terminal length | screen-length disable |
| undo screen-length disable | |
| terminal no monitor | undo terminal monitor |
| clear counters | reset counters interface |
| clear interface | reset counters interface |
| clear crypto | ipsec sa |
| ike sa | |
| clear access-list counters | reset acl counter all |
| reload | reboot |
| shutdown | shutdown |
| boot | boot bootrom |
| Aaa | hwtacacs scheme |
| terminal no monitor | undo terminal monitor |
| tacacs-server | hwtacacs scheme (in conf command) |
| snmp-server | tftp-server (in conf command) |
| router bgp | bgp |
| Router rip | rip |
| ip tacacs | hwtacacs nas-ip (this command doesn’t exist !!!) |
| mtu | Mtu (this command doesn’t exist !!!) |
| clear ip cef | reset ip fast-forwarding |
| clear ip route * | reset ip routing-table statistics protocol all |
| Clear ip bgp | Reset bgp all |
| Show tech | display diagnostic-information |
| Sh ip nat translation | Display nat session |
| Show Controller | display controller (but not relevant for non-modular chassis) |
| show dsl int atm 0 | display dsl status interface Atm 2/0 |
| sho atm pvc | Display atm pvc-info |
| debug pvc nego | Debug atm all (very dangerous – might crash router) |
| sho crypto isakmp sa | Display ike sa |
| sho crypto isakmp key | Display ike peer |
| sho crypto isakmp police | Display ike proposal |
Источники:
Раз — ixnfo.com
Два — ixnfo.com
Три — tokarchuk.ru
Категории: Huawei
Метки: huawei, сети
Команды для оборудования Huawei
ТД ВоронежДля подключения к коммутатору необходимо в программе SecureCRT выбрать File — Connect in Tab/Tile…

Далее в появившемся окне выбираем любой агрегатор и нажимаем Connect (либо дабл-клик по агрегатору).
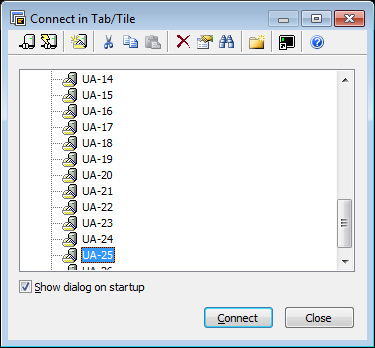
В итоге мы будем подключены по telnet к агрегатору.

Далее необходимо подключиться непосредственно к коммутатору. Для этого прописываем команду telnet %ip-адрес_коммутатора%. После запроса системы вводим логин и пароль.

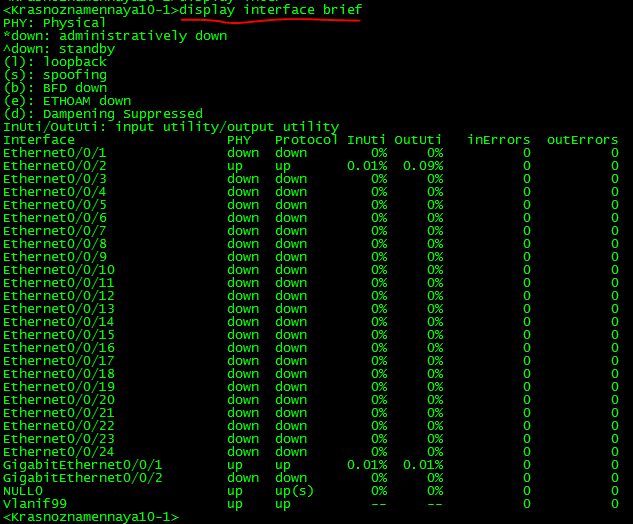
Для просмотра суммарной информации по статусам и конфигурациям интерфейсов коммутатора в виде сводной таблицы используется команда display interface brief
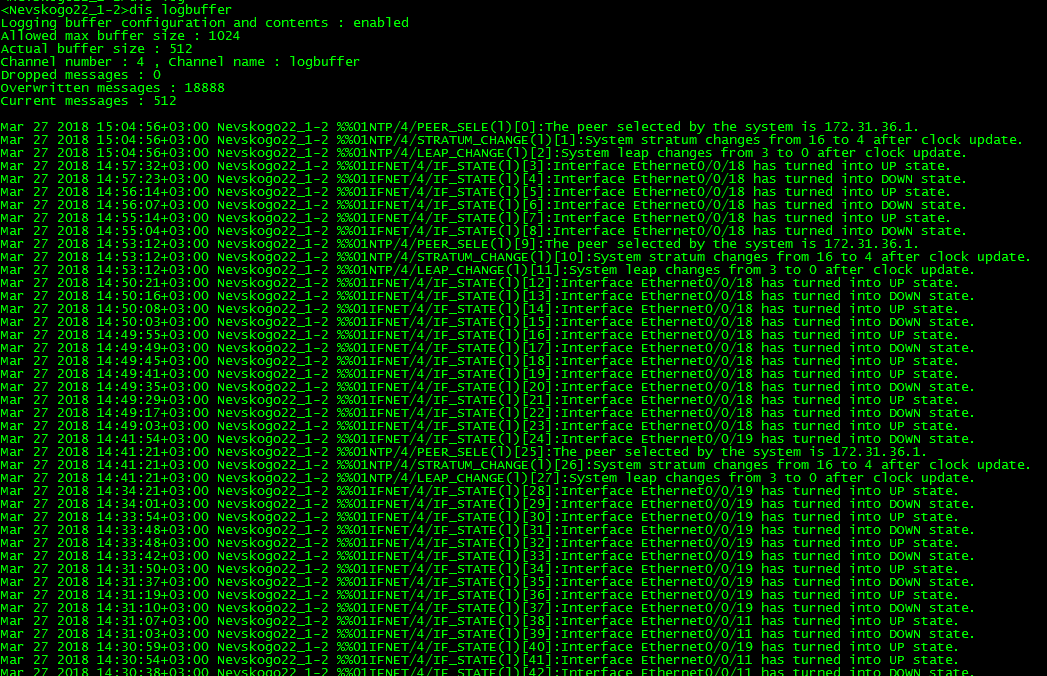
Для просмота логов коммутатора используется команда display logbuffer
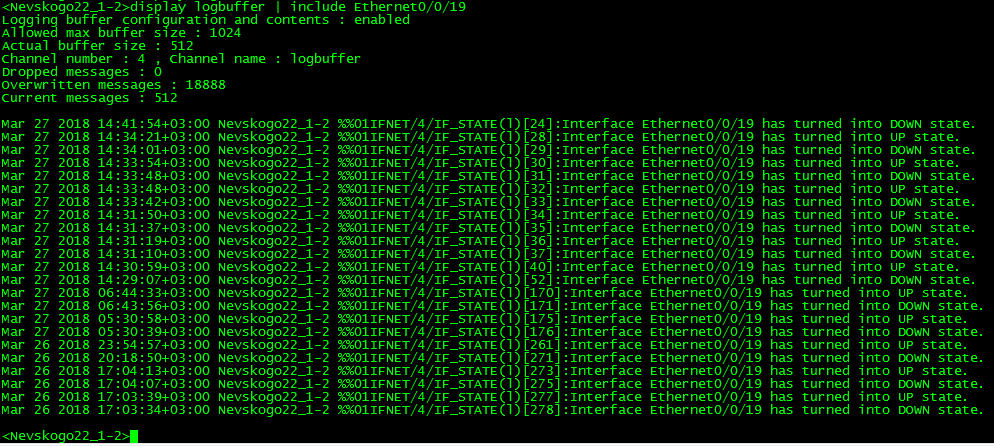
Если нам необходимо посмотреть, к примеру, информацию по какому-то конкректному интерфейсу, то используем дополнительные параметры команды. В нашем случае команда будет выглядеть так: display logbuffer | include %Имя_интерфейса%
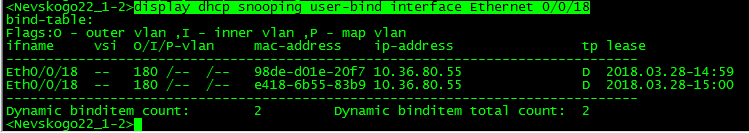
Команда для просмотра таблички с МАС-адресами клиентов и IP-адресами, которые им присвоены: display dhcp snooping user-bind all

Если нам необходимо посмотреть табличку по конкретному интерфейсу, используется команда display dhcp snooping user-bind interface %Имя_интерфейса%
Можно посмотреть «соседа», то есть к какому коммутатору подключен данный коммутатор. Для этого используется команда display lldp neighbor interface %Имя_интерфейса%
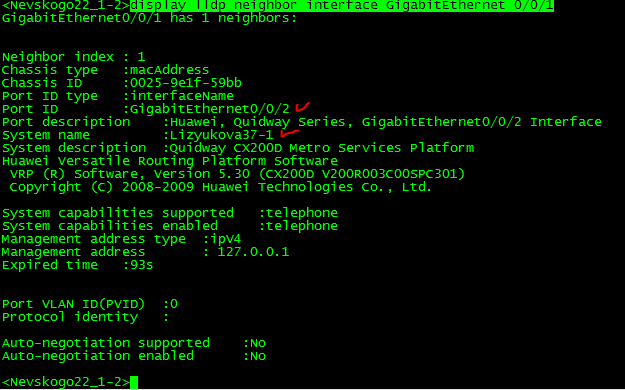
На картинке выше видим, что порт GE0/0/1 коммутатора Nevskogo22_1-2 (к которому мы подключены) соединен с портом GE0/0/2 коммутатора Lizyukova37-1.
Для отслеживания информации на оборудовании в режиме реального времени используется команда terminal monitor

Переход в режим конфигурирования осуществляется с помощью команды system-view. Стоит обратить внимание, что sysname оборудования при этом будет указываться не в треугольных скобках <>, а в квадратных – [].

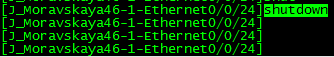
В этом режиме мы можем, к примеру, отключить административно какой-либо из интерфейсов. Для этого заходим на сам интерфейс: interface %Имя_интерфейса%

И прописываем команду shutdown
Чтобы проверить отключен ли интерфейс возращаемся из режима конфигурирования с помощью команды quit в обычный пользовательский режим

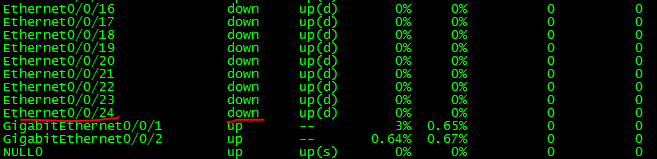
И пропишем команду display interface brief

Как видим порт отключен административно. Теперь включим его. Для этого возращаемся в режим конфигурирования, заходим на интерфейс и отменяем отключение с помощью команды undo %имя_команды%

Проверяем, теперь порт административно включен:
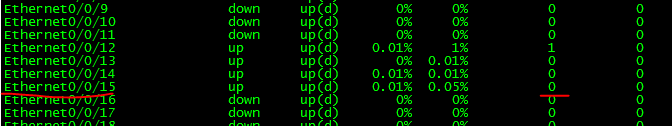
На этом же коммутаторе видим, что на 15 порту есть ошибки:

Сбросим ошибки с помощью команды reset counters interface %Имя_интерфейса%
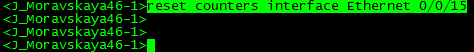
Видим, что после ввода команды ошибки сброшены:
Дополнительные статьи
Настройка сетевого оборудования компании HUAWEI
Заливка софта и конфигурационного файла на Huawei Quidway S2326TP-EI
Настройка коммутатора Huawei Quidway S2326TP-EI
РАБОТА С КОММУТАТОРАМИ QUIDWAY S2326TP-EI
Полезные «лайфхаки»: отвечаем на самые популярные вопросы
Команды траблшутинга / просмотра
| mode | Команда | Описание |
|---|---|---|
| > / ] | display current-configuration | показывает текущую конфигурацию устройства, если на коммутаторе дописать «configuration» то отобразится вся конфигурация кроме портов. |
| > / ] | display interface brief | показывает список и состояние интерфейсов |
| > / ] | display elabel | показывает информацию о железе (серийные номера, модели компонентов и т.д.) |
Базовые команды конфигурации
| mode | Команда | Описание |
|---|---|---|
| > | system-view | переход в режим конфигурации |