Диагностика проблем, возникающих на сайте WordPress, может оказаться сложной. Наглядный способ проследить появление ошибок и получить обратную связь – использование журнала логов. Изучение записей в логах позволит выяснить причину проблемы и устранить ее.
Где хранится лог ошибок ВордПресс и как его посмотреть
Первый шаг к исправлению ошибок на сайте – выяснить, при каких обстоятельствах они возникают. Кроме того, периодически могут появляться неявные ошибки и системные предупреждения, о которых вы не знаете, поскольку ваши действия их никогда не вызывали, но посетители сайта могли это заметить.
Чтобы просмотреть ошибки и предупреждения, необходимо записать их в специальный файл журнала. Ведение журнала логов является хорошей практикой, особенно если сайт находится в стадии разработки. Возможно, вам не удастся понять причину ошибки, когда она впервые возникнет, но как только вы получите больше информации при последующей работе, логи в журнале окажутся очень полезными для анализа ситуации.
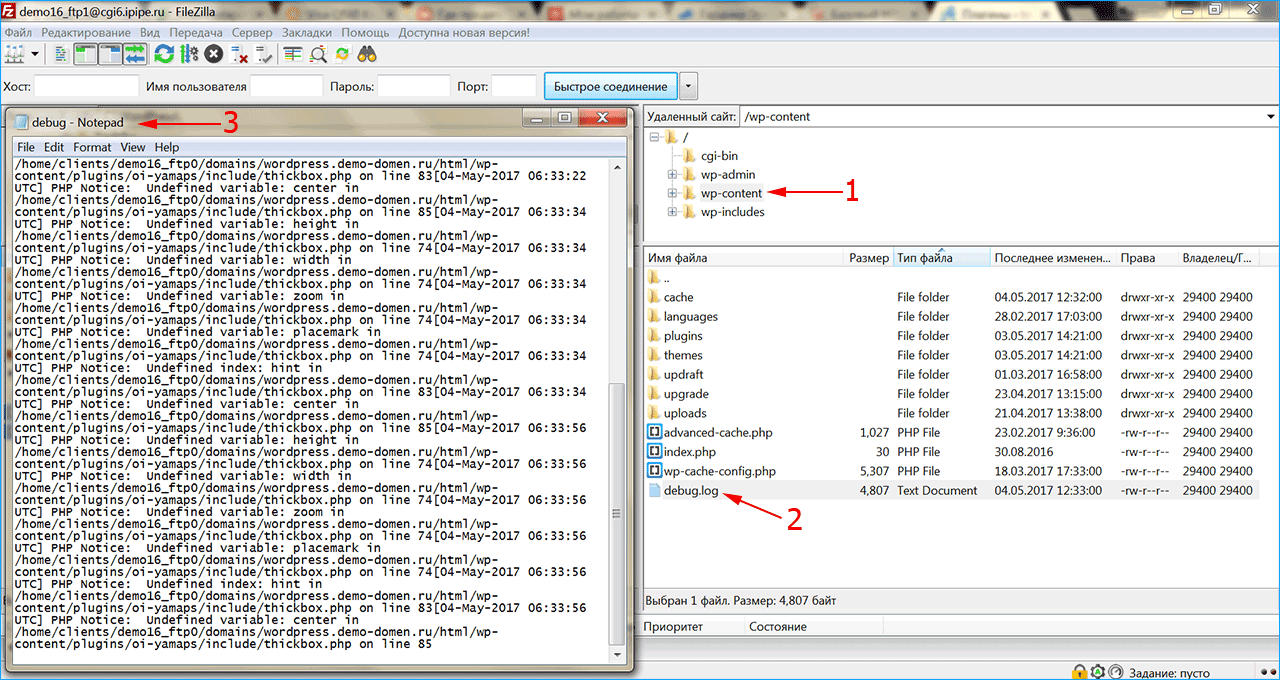
Фактический журнал логов хранится в файле с именем debug.log в каталоге содержимого вашего сайта wp-content на сервере хостинг-провайдера. Как посмотреть логи? Один из способов просмотра и очистки журнала – прямой доступ к этому файлу. Скачайте файл с помощью файлового менеджера и откройте его любым текстовым редактором. Можно воспользоваться плагинами, которые упрощают работу с логами.
Можно ли удалять логи? Файл с отладочной информацией и уведомлениями об ошибках со временем может разрастись до внушительных размеров. Поэтому, если ваш сайт работает нормально, то старые логи можно удалить, чтобы освободить рабочее пространство.
Как включить/выключить логирование
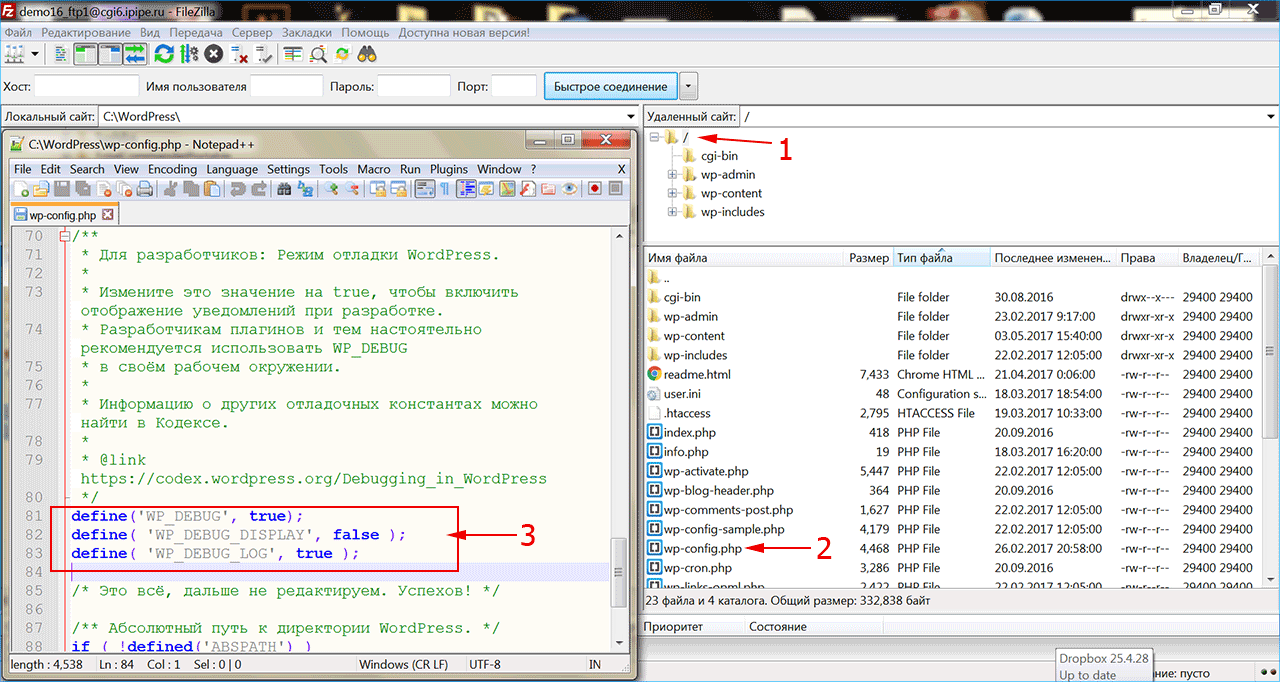
Чтобы включить создание лог-журнала для сайта на WordPress, понадобится внести изменения в системный файл wp-config.php, который расположен на сервере хостинга.
- Запустите файловый менеджер и подключитесь к удаленному серверу со своей учетной записью, который вам предоставил хостинг-провайдер.
- Перейдите в корневой каталог, где установлен ваш сайт.
- Сделайте резервную копию файла wp-config.php, чтобы восстановить систему после завершения отладки.
Откройте файл wp-config.php на удаленном сервере, вставьте или отредактируйте строки, которые управляют созданием логов:
define( 'WP_DEBUG', true );

define( 'WP_DEBUG_DISPLAY', false );

define( 'WP_DEBUG_LOG', true );
Большинство сайтов на WordPress уже имеют запись для константы WP_DEBUG, установленную в значение false, поэтому вам нужно изменить это значение на true. Строка с WP_DEBUG_LOG может отсутствовать, поэтому придется ее добавить, эта команда активирует создание журнала логов для сайта. Константа WP_DEBUG_DISPLAY, установленная в значение false, поможет скрыть запись логов от посетителей сайта. Убедитесь, что каждая константа определена в файле только один раз.
Лог действий в WordPress
После того как запись логов включена, перейдите в папку содержимого сайта на WordPress. Обычно она называется wp-content, если вы не переименовали ее ранее. Откройте файл журнала debug.log, перейдите в конец и найдите строки с метками времени, соответствующими вашим недавним действиям над сайтом.
Каждый раз, когда возникает предупреждение или ошибка в работе сайта, WordPress генерирует уведомление, которое записывается в журнал логов с отметкой времени в формате UTC. По этим причинам на работающем сайте рекомендуется оставить WP_DEBUG включенным. Устраните выявленные проблемы, при необходимости восстановите оригинальный файл wp-config.php.
Ведение логов на сайте полезно, поскольку позволяет выяснить, какие именно действия вызывают ошибки, какие действия пользователей или администраторов сайта чаще всего провоцируют их возникновение. Кроме того, в логах фиксируется вся информация об изменениях на сайте, что позволяет отслеживать динамику сайта.
Плагины для логирования действий
Разработано несколько специальных плагинов, позволяющих просмотреть журнал логов напрямую из админки WordPress. Вы можете установить их прямо в админпанели в разделе «Плагины»
Activity Log – популярный плагин с большим количеством активных установок. Позволяет записать хронологию действий пользователей, их вход в админку и выход. Будут зафиксированы последние действия со страницами и записями, удаление и установка тем и плагинов.
WP Security Audit Log – плагин для мониторинга действий пользователей в админке сайта. Можно использовать для ведения лог-журнала электронного магазина WooCommerce и отслеживать изменение состояния продукта. Плагин создает предупреждение о безопасности, когда в системе создается новый пользователь, и позволяет отследить подозрительную активность, прежде чем это станет проблемой безопасности.
WP Log Viewer – плагин создает виджет панели администратора и позволяет включить/отключить запись лога одним щелчком мыши, при этом не требуется вручную редактировать файл wp-config.php. Можно выполнить фильтрацию ошибок, очистить журнал, сортировать записи по дате или провести поиск ошибок по времени. Пользовательские ошибки обозначаются разными цветами.
Error Log Monitor – этот плагин добавляет виджет, который видим только для администраторов. Он отображает последние сообщения из журнала логов, а также умеет отправлять уведомления по электронной почте о новых возникших ошибках. Частота уведомлений и количество отображаемых записей в журнале настраивается. Плагин оптимизирован для работы с очень большими лог-файлами.
iPipe – надёжный хостинг-провайдер с опытом работы более 15 лет.
Мы предлагаем:
- Виртуальные серверы с NVMe SSD дисками от 299 руб/мес
- Безлимитный хостинг на SSD дисках от 142 руб/мес
- Выделенные серверы в наличии и под заказ
- Регистрацию доменов в более 350 зонах
No one likes to see errors on their website. Not only do they look bad to visitors and potential customers, but they also indicate that something’s wrong. But they’re, unfortunately, an inevitable part of running a site. The good news is that following a few best practices and being proactive can dramatically reduce the number of errors you experience.
One way to monitor potential site issues — or troubleshoot existing ones — is to keep and review an error log. Let’s dive into this a bit more.
What is error logging and why is it important?
Error logging is the process of tracking and monitoring issues that occur on a website. This is usually done with a record of simple text files that live on your web server and are updated whenever an error occurs. Error logs are used to identify the number of problems that occur, provide details about each one, and show when it took place.
How to enable error logging
To enable error logging on your WordPress site, you’ll need sFTP access, available with WordPress.com plugin-enabled plans. This allows you to edit your website files remotely. In this case, you’ll be working with the wp-config.php file, which holds the basic configuration settings for your website.
A word of warning: you should only use sFTP and edit your wp-config.php file if you feel comfortable doing so. Mistakes can cause catastrophic errors on your website. If you don’t have experience changing these types of files, you may want to hire a developer or reach out to WordPress.com support for help.
1. Connect to your website via sFTP
You’ll need to start by enabling sFTP on your site. Go to My Site(s) → Settings → Hosting Configuration and click the Enable SFTP button.
Then, you’ll see your sFTP login details: URL, Port Number, Username, and Password. You’ll need to input these into FTP software, like FileZilla, to access your site. Follow these detailed instructions to connect to your WordPress.com website.
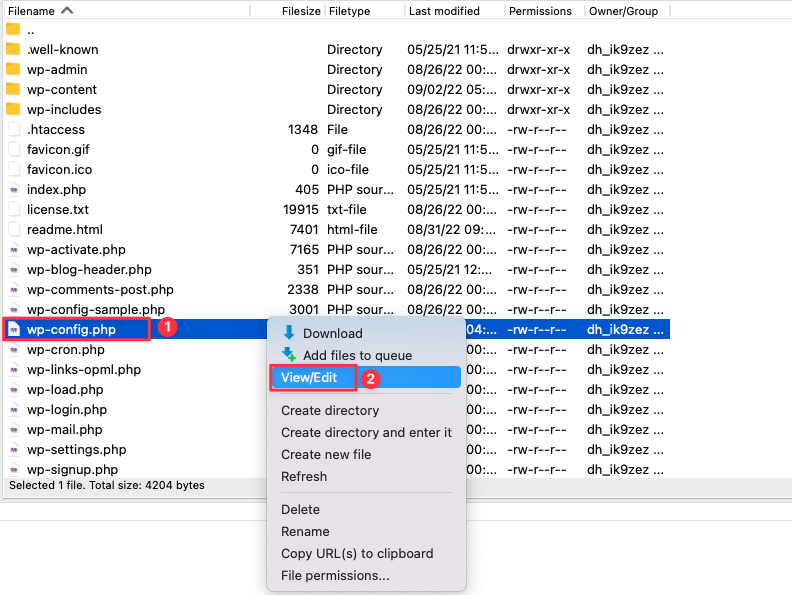
2. Find and download your wp-config.php file
Navigate to your wp-config.php file. This sits in the root directory of your file structure, alongside folders such as wp-content. Download this file, so you have a backup copy on hand.
3. Edit the wp-config.php file
Edit your wp-config.php file using a text editor such as Notepad.
Look for define( ‘WP_DEBUG’, false ); and replace this text with the following:
define( ‘WP_DEBUG’, true );
if ( WP_DEBUG ) {
@error_reporting( E_ALL );
@ini_set( ‘log_errors’, true );
@ini_set( ‘log_errors_max_len’, ‘0’ );
define( ‘WP_DEBUG_LOG’, true );
define( ‘WP_DEBUG_DISPLAY’, false );
define( ‘CONCATENATE_SCRIPTS’, false );
define( ‘SAVEQUERIES’, true );
}
You’ve now successfully enabled error logging. You should only have this feature turned on while troubleshooting. Otherwise, it can leave your site more vulnerable to hacking attempts. To disable logging, simply delete the code you just added and restore the following:
define( ‘WP_DEBUG’, false );
How to view the error log manually
Once the log is enabled, you’ll need to load your website to trigger any error codes. Those codes are stored in a file called debug.log, which you can access via sFTP by following the same steps as above.
You can find the debug.log file inside of the wp-content folder. If there are errors, the file will appear. However, if there aren’t any errors, then you won’t see it at all — congratulations!
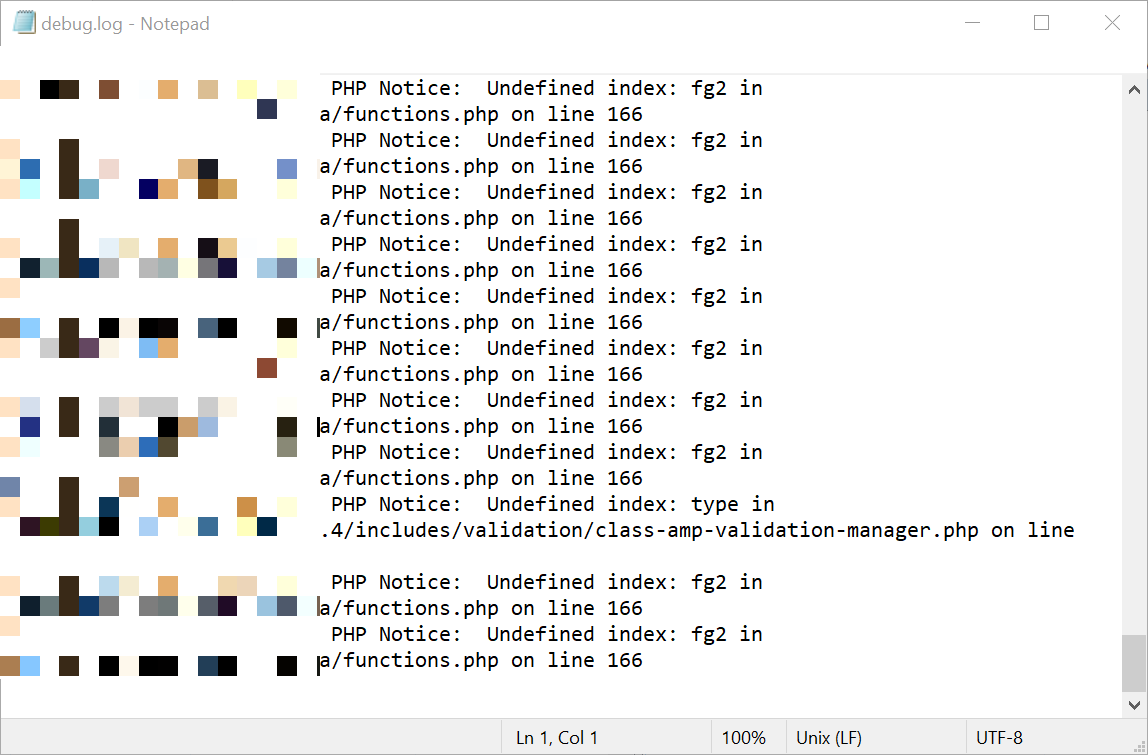
Once you find the file, download it to your computer to view the full log, using a text editing software like Notepad. It will look something like this:

This file will provide valuable information that will point you, or your developer, to the source of your problem.
How to view the error log using a plugin
Using a plugin to find your error log can be an easier and faster method, depending on your level of experience. In the WordPress dashboard, click on Plugins → Add New. Search for “Error Log Monitor” and click Install → Activate.
This plugin installs a widget on your WordPress dashboard that allows you to access your error log. If you haven’t enabled error logging correctly, the widget will display instructions on how to do so. However, you should ignore these instructions, as they’re incorrect for a WordPress.com installation. Instead, use the ones listed above.

If you can’t see the dashboard widget, click on the Screen options tab at the top of the WordPress dashboard and ensure that “PHP error log” is checked.

How to find the plugin or theme that’s causing an error
Error logs are not inherently easy to read, but they do give insightful information into the cause of an error.
Typically, each line in your error log will display a message, alongside the date and time it happened and the file in which the error occurred. It also lists the line number where the error is located. For example:
Apr 20, 15:08:59
Notice: Undefined index: fg2 in /wordpress/themes/pub/varia/functions.php on line 166
Let’s break this down. First of all, there’s the date and time of the error: April 20, 15:08:59. This helps you determine if this was a one-off glitch or a recurring issue.
Then, you can see the type of error that’s been logged. Here are a few common types of error you may see here:
- Notice. These are more warnings than errors, as they don’t actually stop your website code from executing. While you should still address a notice, your site will most likely still function, although potentially not as designed.
- Parse error. This is typically the result of a mistake in the syntax of the underlying PHP code of the website (often in a theme or plugin). Parse errors include things like missing semicolons, parentheses, and other similar mistakes. A parse error will stop executing code when it hits the problem, so your site may look visibly broken or not function as intended.
- Fatal error. This is often caused by undefined functions or classes, like a typo or poor coding practice. You can avoid it by using high-quality code, along with functions such as class_exists or function_exists.
In this case, the error is a notice.
Next, we see the error itself. In the example above the error is “undefined index.” This is followed by the specific location of the problem. In the above example, the error is occurring with the functions.php file of the Varia theme.
How to fix errors
Now that you can see your errors, it’s time to troubleshoot. Here’s a few things you can try:
- If you’re a developer and the error is in your custom code, go to the line number in the log entry and work to debug.
- If the error is within a theme or plugin, start by checking for any available updates. Keeping your plugins and themes up to date is critical for avoiding bugs and maintaining website security. Once you’ve applied any updates, re-check the error log to see if there are any new entries. If the error still exists, reach out to the plugin author or consider switching to an alternative.
- The error may also be caused by a conflict between two plugins. Try using the WordPress troubleshooting mode to fix this problem.
- If the problem occurred immediately after installing or updating a plugin, deactivate it to see if the error persists. If it doesn’t, the plugin is the likely cause and you may want to find an alternative. If the error occured after a core update, you may need to manually deactivate plugins to find the source.
Troubleshooting with the WordPress error log
WordPress, like any software, may occasionally run into problems. It may seem confusing to find and fix those problems, but the error log can be a huge help! It enables you to learn valuable information that can help you troubleshoot and solve site errors in a timely manner.
To avoid errors, always use well-maintained plugins and themes, and keep on top of updates. Need more help? If you have a WordPress plugin-enabled plan, you benefit from world-class Happiness Engineers that can provide guidance.
Do you need to access the WordPress error logs to troubleshoot a problem on your site?
WordPress comes with a debugging system that can log any error messages displayed on your site. This can help you discover and fix problems on your website.
In this article, we’ll show you how to find and access your WordPress error logs.

How and When Can WordPress Error Logs Help?
Are you having problems with your WordPress website? Checking your WordPress error logs can help you find the source of the issues, such as slow website performance, plugins that aren’t working properly, and website crashes.
What Is an Error Log?
An error log is a list of error messages generated by your website and the dates and times they occurred. Once WordPress debug mode is turned on, these messages are collected in a file so that you can review them later.
Your WordPress error log is a troubleshooting tool that can help you identify plugins, themes, or code that are causing problems. You can then go ahead and find a fix for those WordPress errors.
For example, checking the error logs can help troubleshoot errors like the WordPress white screen of death, PHP errors, the invalid JSON error, and the “Sorry, you are not allowed to access this page” error.
That being said, let’s look at how to find and access your WordPress error logs. The first step is to enable WordPress debug mode, which you can do using either a plugin or code.
- Enabling WordPress Debug Mode With a Plugin
- Enabling WordPress Debug Mode Using Code
- How to Find and Access WordPress Error Logs
- How to Fix Issues Found in WordPress Error Logs
- Disabling WordPress Debug Mode
Enabling WordPress Debug Mode With a Plugin
WordPress debugging is turned off by default, so WordPress will not be logging any errors. If you can still log in to your WordPress site, then you can enable debug mode using a plugin.
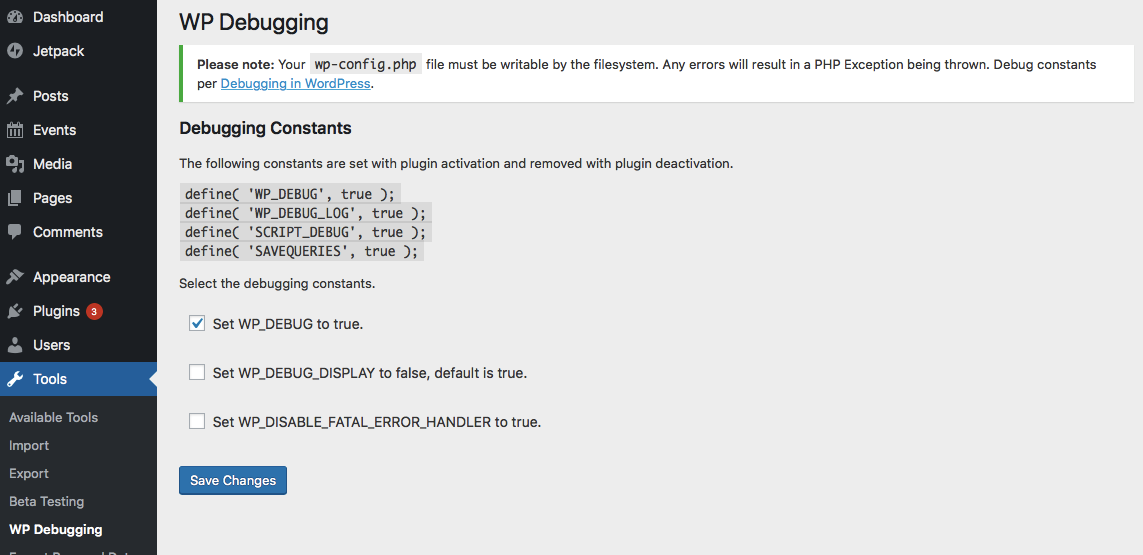
The first thing you need to do is install the WP Debugging plugin. For more details, see our step-by-step guide on how to install a WordPress plugin.

Upon activation, the plugin automatically activates WordPress debug mode, and error messages on your site will now be logged.
Enabling WordPress Debug Mode Using Code
You can also turn on WordPress debug mode using code. This method is suitable for more advanced users or if you can’t log in to your WordPress admin area.
You will need to edit your wp-config.php file using an FTP client or the file manager option in your WordPress hosting control panel.

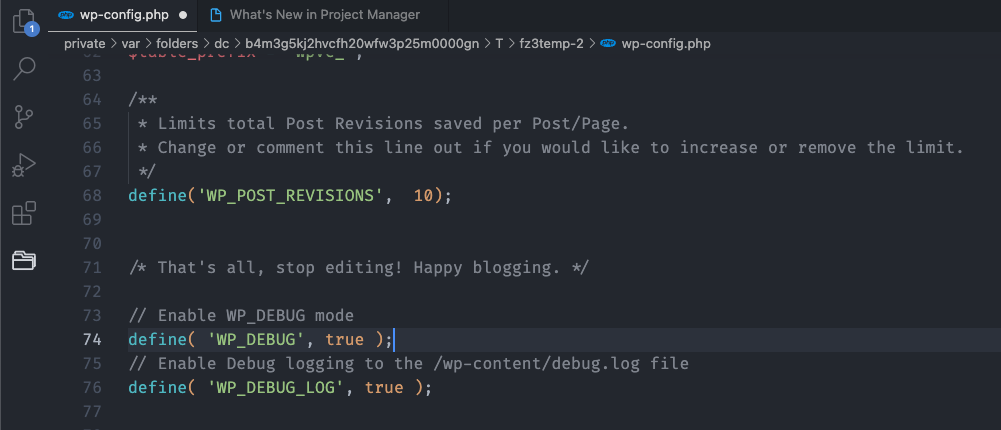
Once you have the file open, simply find the text where it says, ‘That’s all, stop editing! Happy blogging.’
Just before this line, go ahead and add the following code:
define( 'WP_DEBUG', true );
define( 'WP_DEBUG_LOG', true );
For step-by-step instructions, you can see our guide on how to set up WordPress error logs in wp-config with code.
How to Find and Access WordPress Error Logs
Now that you have enabled WordPress debug mode, any future error messages on your website will be stored in the WordPress error logs.
That means that your logs will be empty at first. You will need to try to recreate the problem on your site so that the error messages can be saved to the log file.
For example, you should revisit any posts or pages that are causing an error.
Next, you must connect to your website using an FTP client or the file manager option in your WordPress hosting control panel. If you haven’t used FTP before, then you may want to see our guide on how to use FTP to upload files to WordPress.
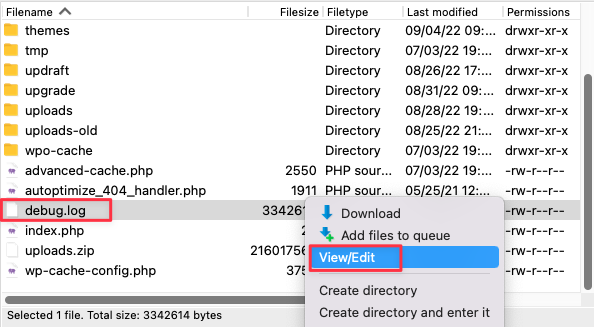
Once you are connected to your site, navigate to the /wp-content/ folder. Inside the folder, you will find a file called debug.log. This file contains every WordPress error message, warning, and notice that has been logged.

To see the contents of this file, you will need to download, view, or edit it.
You can then inspect the error messages along with the date and time they occurred. This information can help you find a solution to the problems you are encountering on your website.

How to Fix Issues Found in WordPress Error Logs
Once you have accessed your WordPress error logs, you can find the error message that was logged when the problem on your website happened. Remember that the times displayed are UTC, not your local time.
While most users won’t understand the error messages, they are a good place to start troubleshooting. Once you note the error message and code, you may find a solution to your problem in our guide on the 50 most common WordPress errors and how to fix them.
If you can’t find the solution on your own, then you can reach out for help on our free WPBeginner Engage Facebook Group, where you can get support from our WordPress experts and over 80,000 users. Just make sure to quote the error code or message you found in the WordPress error logs.
Other places you can turn for help are the official WordPress forums, your WordPress web hosting company’s support team, or the designated support area for the plugin or theme you are having trouble with.
When asking for support, we recommend reading our guide on how to properly ask for WordPress support and get it to learn the right way to ask questions and the best places to find help.
Disabling WordPress Debug Mode
Once you have fixed the issue on your WordPress site, we recommend disabling debug mode. Leaving it on may slow down your website and potentially leak unwanted information, which is a security risk.
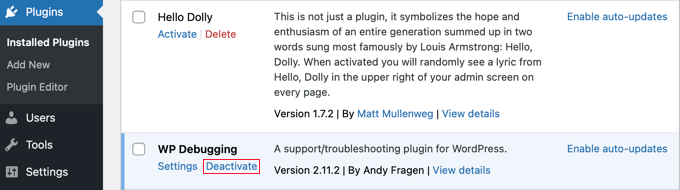
If you enabled debug mode with a plugin, then simply navigate to Plugins » Installed Plugins and deactivate the WP Debugging plugin.

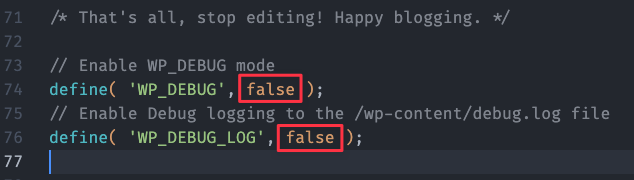
If you enabled debug mode with code, then simply edit the wp-config file as you did before.
You will need to change the WP_DEBUG and WP_DEBUG_LOG lines to ‘false’.

We hope this tutorial helped you learn how to find and access your WordPress error logs. You may also want to learn how to get a free SSL certificate for your website or read our tips on how to speed up WordPress performance.
/cta
Disclosure: Our content is reader-supported. This means if you click on some of our links, then we may earn a commission. See how WPBeginner is funded, why it matters, and how you can support us. Here’s our editorial process.
Editorial Staff at WPBeginner is a team of WordPress experts led by Syed Balkhi with over 16 years of experience in WordPress, Web Hosting, eCommerce, SEO, and Marketing. Started in 2009, WPBeginner is now the largest free WordPress resource site in the industry and is often referred to as the Wikipedia for WordPress.
For agency owners providing website development and maintenance services, encountering errors on clients’ websites can be challenging. Not only do errors create a negative impression for visitors and potential customers, but they also indicate that something is amiss.
It’s important to remember that no software is flawless, and problems or bugs may arise, especially when WordPress is enhanced with various themes and plugins.
Adopting best practices and taking a proactive approach is crucial to address these concerns and ensure smoother operations. One effective method to monitor and troubleshoot potential site issues is maintaining and reviewing an error log.
By configuring WordPress error logs in the wp-config file, agency owners can simplify the process of monitoring and diagnosing errors, thereby enhancing their website development and maintenance services.
In this article, I will guide you through the process of locating and accessing your WordPress error logs.
- What Are WordPress Logs, and Why Are They Essential for Troubleshooting?
- Enabling WordPress Error Logs
- Method 1: Enabling WordPress Debug Mode with a Plugin
- Method 2: Enabling WordPress Debug Mode Using Code
- Accessing WordPress Error Logs
- Analyzing and Fixing Issues Found in WordPress Error Logs
- Using Error Logs to Identify and Resolve Performance-Related Issues
- Leveraging SafeUpdates for Enhanced Development Workflow
- Utilizing SafeUpdates’ Automated Testing feature
What Are WordPress Logs, and Why Are They Essential for Troubleshooting?
Error logging involves tracking and monitoring website issues by maintaining a record of simple text files on the web server. These files are updated whenever an error occurs, allowing for the identification and analysis of problems.
The error log comprises error messages, along with their respective dates and times of occurrence. By enabling WordPress debug mode, these messages are gathered in a file for future review.
WordPress error logs serve as a valuable troubleshooting tool, aiding in identifying problematic plugins, themes, or code. By examining the error logs, you can pinpoint common WordPress errors such as the WordPress White Screen of Death, 408 Request Timeout Error, or the SSH Connection Refused Error.
Now, let’s delve into the process of locating and accessing your WordPress error logs.
Streamline Client Website Updates with SafeUpdates
Automate WordPress updates, enhance security, and save valuable time with SafeUpdates. Experience an average of 42 hours saved on WordPress maintenance and triple your productivity.
Get SafeUpdates
The initial step involves activating WordPress debug mode, which can be accomplished either through a plugin or by implementing specific code.
Method 1: Enabling WordPress Debug Mode with a Plugin
By default, WordPress does not enable error logging as debugging is turned off. To initiate error logging, the initial step is to install a WordPress debugging plugin such as the WP Debugging plugin or any other best WordPress debugging plugin.
Once you have successfully activated the plugin, it automatically enables WordPress debug mode, allowing error messages on your website to be recorded and logged for analysis and troubleshooting purposes.
Method 2: Enabling WordPress Debug Mode Using Code
If you are an advanced user, you can enable error logging and WordPress debug mode by modifying the wp-config.php file through sFTP access.
However, please note that this method requires caution, as making mistakes in the code can have severe consequences for your website.
1. Connect to Your Website via sFTP
To begin, enable sFTP on your site by navigating to My Site(s) → Settings → Hosting Configuration. Click on the “Enable SFTP” button. You will then receive your sFTP login details, including the URL, Port Number, Username, and Password. Use FTP software like FileZilla to connect to your site using these credentials.
2. Locate and Download the wp-config.php File
Find the wp-config.php file in the root directory of your website’s file structure, alongside folders such as wp-content. Download a copy of this file to create a backup.
3. Edit the wp-config.php File
Open the wp-config.php file using a text editor such as Notepad. Look for the line that says define(‘WP_DEBUG’, false); and replace it with the following code:
define('WP_DEBUG', true);

if (WP_DEBUG) {

        @error_reporting(E_ALL);

        @ini_set('log_errors', true);

        @ini_set('log_errors_max_len', '0');

        define('WP_DEBUG_LOG', true);

        define('WP_DEBUG_DISPLAY', false);

        define('CONCATENATE_SCRIPTS', false);

        define('SAVEQUERIES', true);

}
With these changes, error logging and WordPress debug mode will be enabled. Remember to keep this feature turned on only while troubleshooting, as leaving it active can potentially make your site more vulnerable to hacking attempts. To disable error logging, simply remove the code you added and restore the following line:
define('WP_DEBUG', false);
Accessing WordPress Error Logs
After enabling WordPress debug mode, you must load your website to trigger any error codes, which will be stored in a file called debug.log. To access this file via sFTP, follow the same steps mentioned earlier.
To locate the debug.log file, navigate to the wp-content folder. If there are errors, the file will be visible. However, if there are no errors, the file won’t appear at all, indicating that everything is working smoothly.
Once you find the debug.log file, download it to your computer. You can then open it using text editing software like Notepad to view the complete log. The log will contain valuable information that can help you or your developer identify the source of the problem.
Analyzing and Fixing Issues Found in WordPress Error Logs
The debug.log file provides valuable information about errors and warnings on your website but is not meant to be directly edited. Instead, you should use it as a reference to identify issues with your site, theme, plugins, or code.
To work with the debug.log file, follow these steps:
- Identify an error or warning in the debug log.
- Take note of the error code associated with the entry.
- Look up the meaning of the error code to understand the specific issue.
- Refer to separate guides or resources to find solutions for fixing that particular error.
When examining the debug.log file, each entry typically includes the date, time, module, process ID, and visitor’s IP address. However, the most important part is the error message itself. For example, you may encounter errors like “File not found,” indicating a missing file and providing its path.
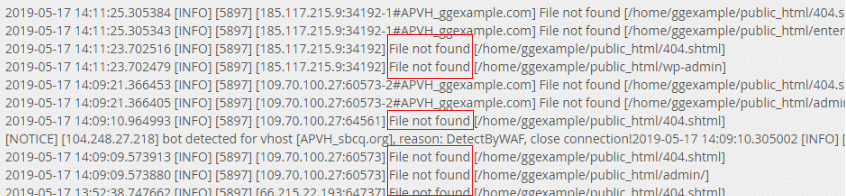
Once you understand the cause of the error, you can proceed to fix it. Common solutions include updating links to files that have been moved or deleted.
Occasionally, you may encounter notice errors (e.g., “bot detected for vhost”), which indicate that the server closed the connection. The debug log should provide further details on why the connection was terminated, such as detecting a potentially harmful bot.
Remember that the debug.log file is primarily for troubleshooting purposes and should not be directly modified. It serves as a valuable tool for diagnosing and resolving issues on your website.
There are numerous types of WordPress error logs that one can encounter, and attempting to list all of them here would result in an extensive and exhaustive compilation.
But still, we can look at one example to see how one can look at error logs to identify and resolve performance-related issues.
For instance, permissions error…
A permissions error in the error log triggers a PHP warning. This type of error occurs when a file is being accessed with incorrect permissions.
One common scenario is when files are uploaded via SFTP without resetting the permissions through the wp-admin dashboard, resulting in incorrect permission settings. It’s important to verify the existence of the file mentioned in the error.
Example 1:
PHP Warning: The stream could not be opened for writing to the file "/path/to/yourblog/wp-content/themes/badperms/lib/css/theme.css" due to permission denied. This error originated in the file "/path/to/yourblog/wp-content/themes/WFTDAtv/lib/less/lessc.inc.php" on line 1418...
Example 2:
[Sat May 31 21:30:22 2023] [error] [client 127.0.0.1] PHP Warning: The stream could not be opened for writing to the file "/path/to/yourblog/wp-content/themes/yoo_phoenix_wp/cache/xml-80a72b04a693554d055946d5ad954588.php" due to permission denied. This error occurred in the file "/path/to/yourblog/wp-content/themes/yoo_regvis_wp/warp/helpers/xml.php" on line 34. Referring page: http://example.com/wp-admin/customize.php
In certain cases, such an error may indicate that a plugin or theme is attempting to perform an action that is not permitted or trying to access a file or directory that it should not have access to.
Example 3:
PHP Warning: Failed to open the stream for writing to the file "/path/to/yourblog/wp-content/cache/autoptimize/autoptimize_f7d7e4c8e9a3146b6b514d7e7f9e2468.php" due to permission denied. This error originated in the file "/path/to/yourblog/wp-content/plugins/plugin_folder/plugin_file.php" on line 22...
Leveraging SafeUpdates for Enhanced Development Workflow
As an agency owner, you are likely responsible for many tasks for your clients, ranging from development and enhancement to regular updates.
For just updating a WordPress website alone, on average, agencies may spend anywhere from a few hours to a couple of days updating client sites.
But what if you can automate some tasks to save time and resources?
If you are tired of encountering confusing errors like the “500 Internal Server” or “503 Service Temporarily Unavailable” when updating plugins or themes on your WordPress site, Cloudways is here to help!
SafeUpdates by Cloudways for WordPress is an optional add-on designed to simplify the process of detecting, testing, and deploying core, theme, and plugin updates on your WordPress site. Whether you’re a busy web creator or a business owner, SafeUpdates automates these tasks with just a few clicks.
SafeUpdates offers flexible update options, allowing you to perform updates instantly or schedule them for later, all within the user-friendly Cloudways Management Platform. With its automated workflow, SafeUpdates ensures efficient and confident update scheduling, freeing up your time for more important business tasks.
Utilizing SafeUpdates’ Automated Testing feature
For developers and agencies responsible for managing client sites, SafeUpdates’ Automated Testing feature is a game-changer. It takes the hassle out of updating WordPress sites.
When updates (core, theme, and plugins) are detected, SafeUpdates automatically triggers a series of actions to initiate the update process. It starts by taking a fresh backup, which is crucial when handling client sites to ensure data integrity and provide a safety net in case anything goes wrong.
Before deploying the updates, SafeUpdates creates a temporary staging environment where it conducts comprehensive tests. These tests cover critical aspects such as Visual Regression, Performance, Logs, and HTML checks.
By thoroughly assessing the updates in a controlled environment, you can identify and address any potential issues before they impact the live site.
Once the updates pass the testing phase, SafeUpdates intelligently handles the deployment. It automatically deploys the updates to the live site, ensuring your clients benefit from the latest features, security enhancements, and bug fixes. If any issues arise during the testing phase, SafeUpdates promptly rolls back the updates, preventing disruptions and maintaining the site’s stability.
As a developer or agency, automating the update process and conducting thorough testing saves you time and reduces the risk of errors or compatibility issues. SafeUpdates keeps you informed throughout the entire process, providing updates and notifications on the status of the updates. This level of transparency allows you to stay on top of the update process and keep your clients informed.
It’s a valuable tool that streamlines your workflow, minimizes risks, and keeps your clients’ websites running smoothly.
Final Thoughts
Enabling error logging on your site is crucial for effective troubleshooting and maintaining a reliable online presence. It allows you to quickly identify and resolve errors, safeguarding your site’s reputation and visitor experience. Additionally, backups and staging environments provide an extra layer of protection.
To further enhance your workflow and save time, Cloudways offers SafeUpdates. This powerful solution automates safe updates for WordPress sites, eliminating the need for manual intervention.
With SafeUpdates, you can ensure that your plugins, themes, and core software are always up-to-date, improving security and performance. Streamline your update process and maximize efficiency with SafeUpdates by Cloudways, and take your site management to the next level.
Q1.Where can I find WordPress logs?
To access your error logs, go to the /wp-content/ folder in your File Manager and locate the debug.log file. This file stores all logged WordPress errors, warnings, and notices for easy review and troubleshooting.
Q2.What are WordPress logs?
The WordPress error log serves as a valuable troubleshooting tool to pinpoint the source of issues caused by plugins, themes, or code. It aids in identifying and resolving problems efficiently.
Q3.What is debug log WordPress?
WordPress offers a built-in debug tool that assists in identifying the root cause of errors on your website. While it provides valuable information, it is not recommended to enable it on a live public website due to potential security risks.
Share your opinion in the comment section.
COMMENT NOW
Share This Article

Abdul Rehman
Abdul is a tech-savvy, coffee-fueled, and creatively driven marketer who loves keeping up with the latest software updates and tech gadgets. He’s also a skilled technical writer who can explain complex concepts simply for a broad audience. Abdul enjoys sharing his knowledge of the Cloud industry through user manuals, documentation, and blog posts.
Whether you’re a seasoned WordPress developer or just getting started, sooner or later, you’re going to run into errors. When that happens, it’s important to know where your WordPress error logs location so you can debug and fix the issue.
You may be confused about how do I check WordPress error log files. We will show you where to find your WordPress error log file and how to interpret the information inside.

What is an Error Log?
An error log records your website’s error messages and when they occur. If you turn on the debug mode in WordPress, these messages are stored in a file for later inspection.
You can use your WordPress error log as a troubleshooting tool to find plugins, themes, or code that may be causing problems. Afterward, you can find a solution to these WordPress errors.
Keeping an eye on the error logs will help you fix problems like “screen death” in WordPress, invalid JSON errors, PHP errors, and “Sorry, you can’t access this page”. Right now, you are wondering where I can find WordPress error logs?
Let’s examine where to look for and how to check your WordPress error logs. The first step is to turn on debug mode in WordPress. You can do this with code or through a plugin. Here are the steps you need to take.
How to Enable WordPress Debug Mode with a Plugin
WordPress does not log any errors by default because debugging is turned off. When you still have access to your WordPress site, you can use a plugin to enable debug mode. Your first step will be to install the WP Debugging plugin on your WordPress site.
Installing the plugin automatically activates WordPress debug mode, and all error messages on your site are now logged.
How to Enable WordPress Debug Mode with Code?
WordPress also allows you to activate debug mode through code. It is for you if you’re an experienced WordPress user or having trouble accessing your WordPress admin area. Your next step is to edit the wp-config.php file using your WordPress hosting control panel’s file manager or FTP client.
Once you’ve opened the file, look for the text that says, “That’s all, stop editing! Happy blogging.”.
You should add the following code just before this line:
define( 'WP_DEBUG', true );
define( 'WP_DEBUG_LOG', true );
WordPress Error Logs: How to Find and Access
Now that you have turned on debug mode in WordPress, You may wonder how do I check WordPress error log? Your WordPress error logs will record any error messages that appear on your website from now.
The first time you see your logs, they will be empty. To save the error messages to the log file, you will need to relocate the problem again on your site. In particular, you should review any posts or pages causing an error again.
In the next step, you will need to connect to your website using an FTP client or the file manager included in your WordPress hosting control panel. If you’ve never used FTP before, you might want to look at a youtube tutorial on how to upload files to WordPress using FTP.
Navigate to the /wp-content/ folder once you have connected. You’ll find a file called debug.log inside the folder. Here you’ll find a record of every mistake, notice, and warning WordPress has ever logged.
You must download, view, or edit this file to see what’s inside the file. Next, review the error messages and the time and date of the occurrence. You can use this information to figure out what’s wrong with your website and how to fix it.
WordPress Error Logs: How to Fix Issues
When you check the WordPress error logs, you can see the error message recorded when there was a problem. Please note that the times displayed are UTC, not your local time.
The error message may not be clear to most people, but it’s a good place to start when determining what went wrong. If you take note of the error message and code associated with the error, you may be able to fix the problem.
You can also get help from the official WordPress forums, the WordPress support team at your web host, or the support area for the plugin or the support section associated with the plugin or theme you’re having trouble with.
Disabling the WordPress Debug Mode
You should turn off debug mode once you’ve resolved the problem with your WordPress site. Leaving it on may cause your website to slow down and leak information you don’t want to get out, which may compromise your security.
If you have enabled debug mode through a plugin, you can disable the WP Debugging plugin from the Plugins » Installed Plugins menu.
You could edit the wp-config.php file as you did before if you used code to turn on debug mode.
In your code, you will need to set the WP_DEBUG and WP_DEBUG_LOG lines to ‘false’
The Takeaway
That’s today’s roundup about finding and accessing WordPress error logs. As this guide shows, activating and accessing WordPress error logs is easy if you have access using the plugin and your hosting control panel. It’s important to understand how to activate the debugging mode so you can read logs in case you run into problems.
We hope this tutorial helped you learn where your WordPress error logs are and how to check them.