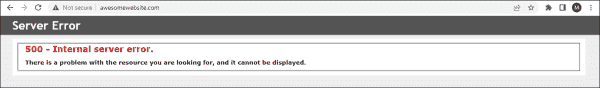
You try to load your classic ASP (Active Server Pages) website and all you can see in your browser is the all too familiar display of 500 Internal Server Error.
This page isn't working

WEBSITE is currently unable to handle this request

HTTP ERROR 500

What is 500 Internal Server Error
First of all, the 500 Internal Server Error is a very general HTTP status code that indicates something has gone wrong on the web server without any specifics on the exact problem.
This instruction is limited to solving a 500 error on IIS server for classic ASP websites, however some other instructions that’s related to IIS in general will help for troubleshooting IIS server for .NET applications as well.
As 500 Server Error message is very often vague, the task now is to find a more specific error message that will help us further analyze and troubleshoot the issue.
Enable Debugging and Send Errors to Browser
If the website is not in a production environment, the easiest way to do it is to enable the ASP Debugging Properties and send the errors to the browser by following these steps:
-
Launch Internet Information Services (IIS) Manager and on the left pane, select your ASP website and click on the ASP icon (Configure properties for ASP applications).

-
Under the ASP window, expand the Debugging Properties and set Enable Client-side Debugging, Enable Server-side Debugging, and Send Errors To Browser to True and click Apply.


Now, when you refresh your ASP website, you will see a more descriptive error message on your browser such as the following example:
System.Xml error '80131509'

There is an error in the XML document.

/itnota/failed-page.asp, line 289

With this information, you can right away open the file (e.g., itnota/failed-page.asp) and check line number 289. Again, this option is not recommended for a production website that’s still actively used and available for public since it exposes too much information publicly. The ideal way to do it is to replicate your production environment on a staging and try to reproduce the error on a lower environment.
Check IIS Log
Another way to check 500 Internal Server Error for your ASP website is by viewing IIS error logs. This is especially true if your ASP website is a public website.
Where to find the IIS Logs?
By default, the log for your website is stored on %SystemDrive%\inetpub\logs\LogFile, but you should not use this settings for a production environment. Always set a custom path for your logs so your websites are easier to maintain in the long run. If you have a different physical hard drive for logs, even better. Make sure it’s set to Enabled.

For the sake of example, the log files are located in folder D:\Logs\ITNota.com:
From the IIS log example below, the easiest way is to look for a pipe character (“|”) on the date and time when the error happens.

The error message can be broken down into two parts:
-
/itnota/failed-page.asp id=2087216&catId=749272
-
|289|80131509|There_is_an_error_in_the_XML_document.
The first part indicates the problematic file with its parameters which can be reconstructed by replacing the white space with a question mark (“?”) like so:
/itnota/failed-page.asp?id=2087216&catId=749272
The second part which starts with a pipe character (“|”) is the line number that caused the error, the error code, and the error description:
|289|80131509|There_is_an_error_in_the_XML_document.
From the above information, we are looking at the following information:
| Item | Description |
|---|---|
| Filename | /itnota/failed-page.asp |
| Line number | 289 |
| Error code | 80131509 |
| Error description | There_is_an_error_in_the_XML_document. |
Check the affected file by opening it in Visual Studio Code or any IDE.
If you use Visual Studio Code to read and write ASP or VBScript, click here for a way how to colorize your ASP code.
If your Internet Information Services (IIS) produces a 500 – Internal server error, your website is in serious trouble. Debugging an IIS 500 – Internal server error can take some time, so you’d better be prepared for the worst-case scenario. You don’t want to research how to deal with this error under time pressure.
Contents
- Cause of 500 – Internal server error
- Debugging an IIS 500 – Internal server error
- Resolving an IIS 500 – Internal server error
- Common 500.x substatus codes
- Author
- Recent Posts

Surender Kumar has more than twelve years of experience in server and network administration. His fields of interest are Windows servers, Active directory, PowerShell, web servers, networking, Linux, virtualization, and Kubernetes. He loves writing for his blog.
Latest posts by Surender Kumar (see all)
- Kubernetes DaemonSets — Wed, Sep 6 2023
- Static Pods in Kubernetes — Fri, Sep 1 2023
- Encrypt Kubernetes Secrets at rest — Mon, Aug 28 2023
In my previous posts, you learned about detailed errors and failed request tracing in IIS (Internet Information Server). I recommend reading those articles first before you proceed with this one.
Cause of 500 – Internal server error
This is the most common error you will encounter with any website hosted with IIS. In most cases, a developer messed up. Thus, the fastest way is often to simply reverse the last action taken, such as restoring an earlier version of your web application. Once your system is running again, you can investigate the cause of the error on your test side in peace.
500 Internal server error
The HTTP 500 error is a server-side error. While we understand that the problem is on the server end, the error is usually ambiguous. It doesn’t exactly tell the administrator what is wrong with the server. Thus, debugging a 500 – Internal server error often takes some time.
Debugging an IIS 500 – Internal server error
Since the above error doesn’t really tell what’s actually wrong with the server, we need to enable detailed errors, as discussed in my previous post. Once detailed errors are enabled, you will see more detailed error information, including an HTTP substatus code. Sometimes even the detailed errors don’t show any useful information right away. For example, see the following screenshot:

The page cannot be displayed because an internal server error has occurred
Here I am getting: The page cannot be displayed because an internal server error has occurred. There is no HTTP status code or substatus code listed on the error page. If you get such an error even when detailed errors are enabled, right-click anywhere in the browser window and select Inspect (or press F12).
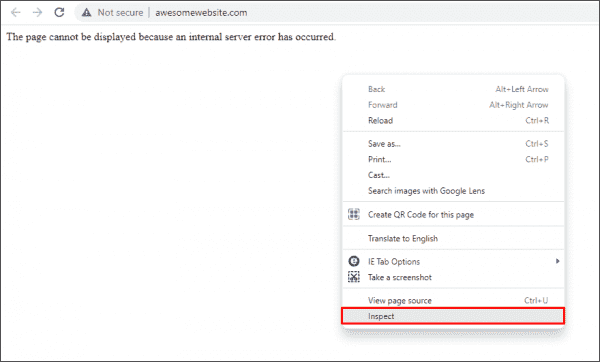
Opening developer tools in web browser to reveal server errors
This opens the developer tools in your browser window. Now, click the Console tab. The actual error thrown by the web server is displayed.
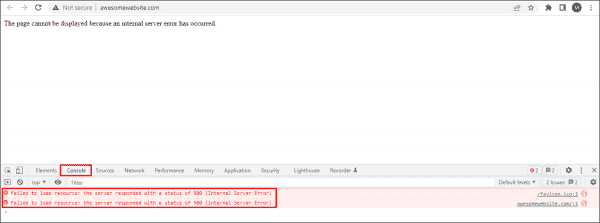
Viewing server errors using the Console tab of the web browser’s developer tools
To further understand the exact cause of 500 errors, enable Failed Request Tracing, as discussed in my previous post. Now, try to replicate the problem. If you can replicate it, open the newly generated XML log file in a web browser. The following screenshot shows the actual cause of a 500 – internal server error with a substatus code of 19 (HTTP 500.19 error):
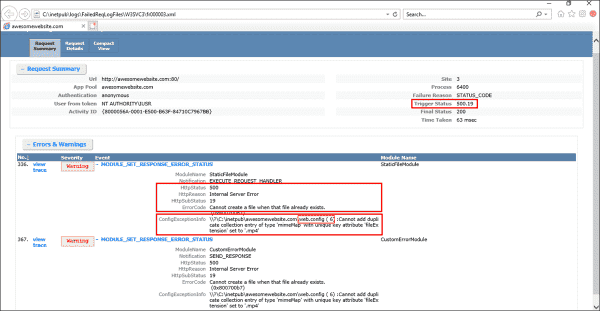
Determining the cause of a 500 error using the Failed Request Tracing log file
Usually, substatus code 19 indicates that the configuration data is invalid. This could be due to some malformed or unidentified element in a server-level config file (ApplicationHost.config) or website-level config file (web.config). If you take a closer look at the ConfigExceptionInfo field of the log file, you will find the exact line number (6 in our case) in the web.config file that caused the exception. Now let’s take a look at the web.config file itself.
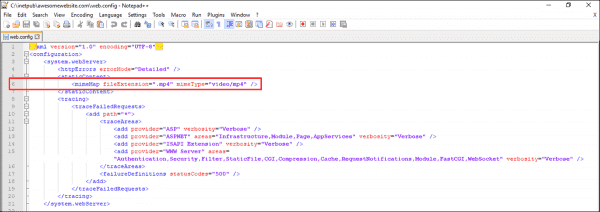
Viewing the problematic element in the web.config file
Here, you can see that the developer tried to add a mime type in the config file, but it was already defined in the server-level configuration file (i.e., ApplicationHost.config). Therefore, the Cannot add duplicate collection entry of type ‘mimeMap’ with unique key attribute ‘fileExtension’ set to ‘.mp4’ exception was returned. Furthermore, if there is some unidentified element, a syntax error, or even a typo in the web.config file, you will most likely get a similar error.
Resolving an IIS 500 – Internal server error
To resolve an IIS 500 – Internal server error, you could simply remove the line that is causing the exception. Alternatively, if you don’t want to remove this line for some reason, add the following code right above line 6 in web.config:
<remove fileExtension=".mp4" />
By doing this, you are essentially overriding the server-level element. In the end, your web.config file should look as shown below:
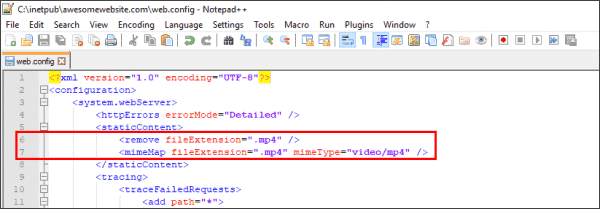
Overriding the server level mime element with web.config file
Now refresh the page, and the error should go away. This was just one example of resolving a 500.19 error. If you get a 500 error with a different substatus code, use the same approach to troubleshoot the problem.
Common 500.x substatus codes
The following table covers some of the most common HTTP 500 substatus codes, along with their probable causes and troubleshooting advice:
Subscribe to 4sysops newsletter!
| Status Code | Probable Cause | Troubleshooting Advice |
| 500.11 | The application is shutting down on the web server | The application pool is shutting down. You can wait for the worker process to finish the shutdown and then try again. |
| 500.12 | The application is busy restarting on the web server | This is a temporary error and should go away automatically when you refresh the page. If the error persists, something is wrong with the web application itself. |
| 500.13 | The web server is too busy | This error indicates that the number of incoming concurrent requests exceeded the number that your IIS application can process. This could be caused when the performance settings are not right. To troubleshoot such issues, a memory dump needs to be captured and analyzed using tools such as Debug Diagnostic. |
| 500.15 | Direct requests for Global.asax file are not allowed | A direct request was made for the Global.asa or Global.asax file, which is not allowed by the web server |
| 500.19 | The configuration data is invalid | We already covered how to fix this error above |
| 500.21 | The module not recognized | This status code is caused by a partial installation of the IIS server, such as missing ISAPI modules. To fix this error, identify the missing IIS components and install them. |
Once you troubleshoot the problem, don’t forget to disable Failed Request Tracing and revert the detailed errors to custom errors on your web server.
So you just moved your application to an IIS7 server, and now you are getting an error when you make a request to it. This seems to be a popular theme on IIS.NET forums these days, and after answering a hundred or so of these posts, I figured I should do something to help people track down and fix their issues with a little less frustration.

Dealing with 500, 503 IIS errors? These are likely hiding bigger application issues that are hurting your application.
It can be very hard to link generic IIS errors to underlying issues that you can fix. Head over to LeanSentry to get a comprehensive application checkup. We’ll find your actual IIS and ASP.NET issues, and even show you how to fix them in code.
Server software, and web servers specifically, are very complex and highly configurable systems that support multi-tier applications using a variety of technologies and subsystems, and endure further complexity due to security, performance, and reliability demands, so it’s a wonder it all works as well as it does in the end. IIS7 strives to improve the experience of diagnosing and solving problems when they do occur, so knowing how to use the new IIS7 diagnostics features can come a long way in helping you become a pro at troubleshooting server problems.
First things first – what’s the problem?
I often find myself asking this question on the forums when someone posts something like “Help, I moved to IIS7 and now my application doesn’t work!”. Huh, what doesnt work? When your site stops working, the first thing you need to do is determine what the error actually is before we can move any further. IIS7 has much better error messages that will often tell you exactly what the problem is, and help you fix it.
Unfortunately, sometimes getting to this error is the main challenge. Let’s look at a few things you may need to do to get there:
1) Disable IE “Friendly HTTP error messages”
IE will by default replace the actual error messages coming from the server with a “friendly” error message, which hides the error contents we need to see. For example, for a 404 Not Found error, you may instead see the following:

To disable this and see the real error coming from the server, you need to go to “Tools > Internet Options”, choose the Advanced tab, and clear the “Show friendly HTTP error messages” checkbox. Then, close the browser, open it again, and re-request the page.

Now, suppose you are still seeing the generic “cannot display the webpage” or “page not found” error. This is typically caused by IE failing to connect to your website, so there is no server error message to look at here. I have a detailed guide to troubleshooting this condition here: Where did my IIS7 server go? Troubleshooting “server not found” errors.
An aside: If you don’t want to mess with IE for troubleshooting (especially if you suspect you are getting cached pages, due to IE’s super- aggressive caching), the best thing to do is break out a trusty simple http tool of choice and make the request with it. I recommend WFETCH, which is included in the IIS6 Resource Kit tools (you can install on XP/Windows 2003 only, and can either run it from there or copy wfetch.exe to your Vista/LHS box).
2) Enable IIS7 detailed errors
IIS7 introduces a new custom errors feature, which by default hides the error responses issued by the server to remote clients, replacing them with a basic error message. This is critical for security of your site, as errors frequently contain sensitive information that you don’t want others to see, but makes getting to the bottom of the problem harder since you cannot see those very error details. So, if you are requesting your site from another machine, you may still get a basic error that looks like this:

You have two options here:
1) Make the request locally from the server machine.
By default, you will get the detailed error.
2) Enable detailed errors for remote clients.
First, if your error is an ASP.NET exception (you can tell if it says “Runtime Error” and has the framework version), please be aware that ASP.NET overrides the IIS custom error mechanism with its own implementation of custom errors, so you should turn the ASP.NET custom errors off to see detailed ASP.NET exceptions. You DO NOT have to configure IIS7 custom errors for ASP.NET exceptions (it would be silly to have to do it in two places). To turn off ASP.NET custom errors, place the following in your web.config:
<system.web>
<customErrors mode=”Off” />
</system.web>
If the error is not an ASP.NET error, turning off IIS7 custom errors will allow error responses from your application to be sent to remote clients without being censored by the IIS7’s custom errors module.
You can do this from the IIS7 Admin tool by running “Start>Run>inetmgr.exe”, selecting your website/application/virtual directory in the left-hand tree view, clicking on the “Error Pages” icon, clicking “Edit Feature Settings” action, and then selecting “Detailed Errors”.

You can alternatively do this from an elevated command line prompt (Run as Administrator):
> %windir%system32inetsrvappcmd.exe set config “Default Web Site/yourapp” /section:httpErrors /errorMode:Detailed
Where “Default Web Site” should be replaced with your site’s name if different, and “/yourapp” with the virtual path you’d like to enable detailed errors for.
NOTE: When you are done debugging, please return the settings back to custom errors for remote requests, or the security of your website may be compromised. Here is how to do it with AppCmd:
> %windir%system32inetsrvappcmd.exe set config “Default Web Site/yourapp” /section:httpErrors /errorMode:DetailedLocalOnly
Now, you should be getting detailed errors back – for example, the error I was getting before now looks like this (this is the Vista error page – Longhorn Server and Vista SP1 error pages will look much nicer, see this for an example):

Notice that this error contains quite a bit of useful information:
1) The heading contains the substatus code, 404.0, which is an IIS specific code that further describes the problem. The majority of common errors has a unique <status_code>.<substatus_code> combination that you can easily google for additional information.
2) The page indicates what module (IIS Web Core), and in what notification (MapRequestHandler) an error occurred. This information is critical whenever you are debugging server problems, especially on the IIS7+ world when most of them occur in one of the modules that take part in the processing of the request.
3) The page shows you some useful request information, such as the requested url and the physical path to which it resolved. Most 404 errors will be resolved right here, by seeing that the request is being made to a wrong url or resolving to a wrong physical path due to incorrect virtual directory mapping.
4) The “most likely causes” and “what you can try” sections offer the most likely explanation for the error and what you can do about it. They are dead on for the majority of common IIS7 errors.
NOTE: When you are coming to the forums with an error, we expect you to have gotten this far and that you will provide the detailed error to help us with your problem. For more information about the custom errors support in IIS7, check out http://www.iis.net/articles/view.aspx/IIS7/Managing-IIS7/Diagnostics-in-IIS7/Deciphering-Error-Messages/How-to-Use-HTTP-Detailed-Errors-in-IIS7.
3) Detour – the 503 “Service Unavailable” error
Sometimes, you will get an error that looks like this:

This error most likely either indicates a critical misconfiguration of the server that is causing IIS to fail to start a worker process/process your request, or a system overload condition that is causing requests to be rejected early, so no further error information will be available in the response. If you are getting this error, please follow my detailed guide: Where did my IIS7 server go? Troubleshooting “service unavailable” errors.
Deeper diagnostics with Failed Request Tracing (formerly known as FREB)
If the error alone is not sufficient to diagnose the condition, or more information is needed to determine what lead up to the error occurring, or, there is no error (for example, request times out), you can take advantage of the wonderful IIS7 feature called “Failed Request Tracing”.
This feature can be used to generate a detailed trace of events leading up to the failure, much like ETW, but now with more/more useful events and significantly easier to turn on and use for troubleshooting.
More importantly, you can configure Failed Request Tracing to only trace requests that encounter a specific failure condition, such as a specific response status/substatus codes, an event of specific verbosity, or a timeout.
To do this, you are going to need to install it first (if you haven’t already):
On Vista: Control Panel, Programs, Turn Windows Features on or off, check Internet Information ServicesWorld Wide Web ServicesHealth and DiagnosticsTracing.
On Windows Server 2008: Start>Run>Server Manager, Roles, Web Server(IIS), Add Role Services, check Web ServerHealth and DiagnosticsTracing
Then, to enable IIS to generate these logs, you need to do two things:
1) Enable Failed Request Tracing for the site you want to trace
In InetMgr, select your site in the left-hand tree view, then under Actions on the right click “Failed Request Tracing …”. There, select the Enable box.

2) Create a Failed Request Tracing rule with the events and failure definition of choice
In InetMgr, select the site/application/virtual directory that you’d like to trace in the tree view, click the “Failed Request Tracing Rules” icon, click the “Add…” action, and follow the wizard to create the rule.
You will be asked what content you’d like to trace (based on an extension), when to consider the request as failed (a list of response status codes, and in Longhorn Server, also event verbosity) or a timeout, and finally the events you’d like to trace. I recommend to leave all events selected by default, unless you are sure you know what you are looking for.

Now, when you make a request, if it meets the failure definition, the detailed trace will be logged as an XML file that you can inspect (or send to us for inspection).
You can by default find this file in %systemdrive%inetpublogsFailedReqLogFilesW3SVC<ID> folder.
If you double-click this file, it will open with the provided XSL stylesheet that shows the trace events. In Longhorn Server, this stylesheet has gotten a major overhaul to highlight the important information better – for more information, see this: http://blogs.iis.net/bills/archive/2006/10/19/Making-Failed-Request-Tracing-More-Approachable.aspx. You can download the new stylesheet and use it today for your Vista machine.
The Failed Request Tracing log provides verbose execution information for the request, that can be used in a number of ways to further diagnose more complex problems that may result from the operation of more than one module. For example, if a url rewriter module changes a url in the request, which later leads to the static file handler failing to find the file, the SetUrl event can provide the needed information. The log also provides such key info as the times taken by each module to execute, the outcome of each of the built-in module’s operation (often including the reason why something didn’t work), and any times when a module fails a request by setting an error response status code.
Finally, one of the main strengths of Failed Request Tracing is that you do not have to be the client to receive the error information. As an administrator, you can configure it to monitor for errors and log the forensic trace when they occur, allowing you to just leave the feature on in production. Think of it as request logs on steroids. To learn more about Failed Request Tracing, see http://www.iis.net/articles/view.aspx/IIS7/Managing-IIS7/Diagnostics-in-IIS7/Using-Failed-Request-Tracing/Troubleshooting-Failed-Requests-using-Tracing-in-I.
I will post more specific strategies on how to troubleshoot with Failed Request Tracing logs in a future post. In the meantime, you should now be a lot more prepared to deal with errors when they occur, and resolve them before you type that first forum post. And if you do make a post (which you are welcome to do), you’ll be able to provide us with the key information to help you solve your problem.
Thanks,
Mike
There are a lot of IIS errors out there.
Way too many, right?
You as a sysadmin know that for sure – internal server errors, access denied errors,
bad request errors, and application host errors. All these IIS errors sometimes drive you crazy.
Here’s a list of the most common errors around IIS errors and the proven solution to them:
- “500 Internal Server Error” or “HTTP Error 500”
- “Error 500.19” or “500.19 Internal Server Error”
- “HTTP Error 503. The Service is unavailable.”
- “Error 403” or “403 Forbidden”
- “HTTP 404 – File not found”
- “Error 401: Access Denied” or “Error 401: Unauthorized”
- “400: Bad Request” or “Bad Request: Error 400”
- “APPHOSTSVC Error 9009” or “Warning 9009 – IIS-APPHOSTSVC”
- “HTTP Error 301 – Moved Permanently”
And you’ll find the solution to get rid of ALL IIS errors – forever: Test PRTG and get started within minutes!
1. IIS error:
«500 Internal Server Error» or «HTTP Error 500»
 Quick fix
The 500 Internal Server Error is a common HTTP error code indicating that something has gone wrong on the web server. As each website can use an individual error code, the error message may also look similar to one the following messages:
- “500 Internal Server Error”
- “HTTP 500 Internal Server Error” or “HTTP 500 Internal Error” or “HTTP Error 500”
- “Temporary Error (500)” or “500 Error”
These error messages usually occur when the server is unable to specify the problem. The most common causes are incorrect permissions on your files or folders, a PHP timeout, or coding errors in .htaccess. To solve the problem, check the configuration of your site or look for further information in the error log via IIS manager.
Best Solution:
https://www.lifewire.com/500-internal-server-error-explained-2622938
2. IIS error
«Error 500.19» or «500.19 Internal Server Error»
3. IIS error
«HTTP Error 503. The service is unavailable.»
Quick fix
The IIS error 503 is a server error may occur when you try to connect to a web application. “Error 503 — The service is unavailable” usually occurs if the application pool associated with the web application you are trying to connect to fails to start. This may have been caused by an overload or ongoing maintenance.
To solve the problem quickly, follow these steps:
- View the system log in the Event Viewer to find the error. If the application pool fails to start, this error is logged in the system log.
- If you cannot find the relevant event in the system log, continue your search in the HTTPERR log file located in the following system folder: c:\windows\system32\logfiles. Search for “503” to find out why the application pool failed to start.
Best Solution:
https://windowsreport.com/http-error-503-service-unavailable/
https://support.microsoft.com/en-us/help/2619402/error-503-service-unavailable-when-you-browse-windows-sbs-websites
4. IIS error:
«Error 403» or «403 Forbidden»
Quick fix
The error 403 Forbidden usually occurs when you are trying to access a directory or page that you do not have permission to access. You IIS web server may provide more specific details on the cause by adding a suffix number after the 403, for example “403.14 Forbidden” (Directory listing denied).
The solution depends on what caused the error to occur. If you cannot find details on the cause, try the most common quick fix solutions.
Best Solution:
https://www.lifewire.com/403-forbidden-error-explained-2617989
5. IIS error:
«HTTP 404 – File not found»
Quick fix
The 404 error message occurs when the web server is unable to retrieve the requested page. The most common causes of this IIS error are that the requested file has been renamed, deleted or moved to another location.
In order to solve the issue, make sure that the file you requested exists on the ISS. Also check if it is in the right location and has the correct name. To find out where the requested file is located, you can use the IIS MMC snap-in.
Best Solution:
https://support.microsoft.com/en-gb/help/248033/how-system-administrators-can-troubleshoot-an-http-404-file-not-found
6. IIS error:
«Error 401: Access Denied» or «Error 401: Unauthorized»
Quick fix
If you receive error 401 by your IIS, you are facing authentication problems. The error occurs when the authentication to the admin or helpdesk portal fails due to a misconfiguration of authentication settings.
To fix the problem, make sure that your account has the required permissions by verifying the authentication settings in IIS Manager.
Best Solution:
https://kb.netwrix.com/1162
7. IIS error:
«400: Bad Request» or «Bad Request: Error 400»
Quick fix
IIS error 400 occurs when the server was unable to process the request sent to the website server. The most common cause of the Bad Request error 400 is an invalid URL, but it may occur due to a different cause as well.
To solve IIS error 400, make sure that the URL you have entered is correct. Typing errors or non-allowed characters in the URL are the most common cause of the Bad Request error. If the error still occurs after verifying the URL, clear your browser’s cache, DNS cache and cookies and try again.
Best Solution:
https://www.lifewire.com/how-to-fix-a-400-bad-request-error-2617988
8. IIS error:
«APPHOSTSVC Error 9009″or «Warning 9009 – IIS-APPHOSTSVC»
Quick fix
Warning 9009 is an IIS error of the Application Host. It occurs when the Application Host failed to delete the history directory. The Application Host Helper Service detects any changes in the ApplicationHost.config file and creates a backup in a subdirectory. However, the maximum number of subdirectories is 10. If this number is exceeded, the oldest one is usually deleted. If this process fails, error 9009 occurs.
To solve this problem, stop and restart the Application Host Helper Service (AppHostSyc). The AppHostSyc will then start the service and delete the subdirectory automatically. If it still fails to delete the history directory, try restarting the service manually.
Best Solution:
http://intelligentsystemsmonitoring.com/knowledgebase/internet-information-services/event-id-iis-application-host-history-configuration-185366/
9. IIS error:
«HTTP Error 301 – Moved Permanently»
Quick fix
ISS error 301 is a status code that informs the client that the location of a requested resource has permanently changed. If this server-side status comes up unexpectedly, you may want to diagnose the problem.
The first step to solve the problem is to check if there are any incorrect redirect instructions on the server configuration files or your web server software. You can also check the application logs to look for further information of the possible cause.
Best Solution:
https://airbrake.io/blog/http-errors/301-moved-permanently
Choose your solution: Bugfix or replacement
![]()
With PRTG you’ll never have to deal with
IIS errors again. Ever.
Trusted by 500,000 users and recognized
by industry analysts as a leader

“Fantastic network and infrastructure monitoring solution that is easy to deploy and easier still to use. Simply the best available.”
Read more reviews

“Software is absolutely perfect, Support is superior. Meets all needs and requirements, this is a must have solution if you are needing any form of monitoring.”
Read more reviews

“The tool excels at its primary focus of being a unified infrastructure management and network monitoring service.”
Read more reviews
Мы описывали как настраивать веб-публикацию на IIS в инструкции.
Но после настройки веб-публикации при подключении к базе может возникать ошибка “Ошибка HTTP 500.0 — Internal Server Error”.
Если модуль был установлен с 32-битного клиента, то требуется это указать в пуле приложений. Для этого мы делаем следующую настройку:
- Заходим в Панель управления → Администрирование → Диспетчер служб IIS.
- Выбираем Пулы приложения которые задействованы в веб-публикации, в нашем случае DefaultAppPool.
- Нажимаем ПКМ Дополнительные параметры.
- В строке Разрешены 32-разрядные приложения мы указываем True как на Рисунке 1.
- Нажимаем ОК.

Рисунок 1 — Дополнительные параметры пула приложений
Если не сработало, есть следующие возможные решения:
- Убедитесь, что разрешения NTFS для файла web.config верны и обеспечивают доступ к учетной записи компьютера веб-сервера. Заходим в директорию, где размещена публикация (по умолчанию — C:\inetpub\wwwroot\ИМЯ_БАЗЫ). Нажимаем ПКМ на web.config → Свойства → Безопасность. Убедитесь в том, что у группы IIS_USERS есть права на чтение, выполнение, запись и изменение файла. Если нет — нажмите кнопку Изменить, в появившемся окне Добавить → Дополнительно и найдите в списке IIS_USERS. Добавьте эту группу и назначьте соответствующие права.
- Проверьте журналы событий, чтобы посмотреть, была ли зафиксирована какая-либо дополнительная информация. Открываем Выполнить (ПКМ на кнопку меню пуск или сочетанием клавиш Win+R), вводим “eventvwr.msc”, нажимаем Enter. Возможно, журнал даст подсказку какой компонент может сбоить.
- Переустановите компонент IIS на сервере. В диспетчере серверов удалите роль Веб-сервера IIS, перезагрузите сервер, а затем установите заново через оснастку Добавить роли и компоненты.
- Установите компонент расширения .NET, если запрос сопоставлен управляемому обработчику.
В Windows Server 2012 и младше: заходим в Диспетчер серверов → Добавить роли и компоненты → Роли сервера → Веб-сервер (IIS) → Веб-сервер → Разработка приложений → Расширяемость .NET. Далее идём далее по указаниям системы.
После применения настроек, мы можем подключаться к настроенной веб-публикации без ошибок.
Нужна готовая настройка веб-доступа к 1С? Попробуйте наш сервер 1С в аренду, в услугу включены все настройки и обслуживание.