Время на прочтение
6 мин
Количество просмотров 27K
Что делать, если поймал HardFault? Как понять, каким событием он был вызван? Как определить строчку кода, которая привела к этому? Давайте разбираться.
Всем привет! Сложно найти программиста микроконтроллеров, который ни разу не сталкивался с тяжелым отказом. Очень часто он никак не обрабатывается, а просто остаётся висеть в бесконечном цикле обработчика, предусмотренном в startup файле производителя. В то же время программист пытается интуитивно найти причину отказа. На мой взгляд это не самый оптимальный путь решения проблемы.
В данной статье я хочу описать методику анализа тяжелых отказов популярных микроконтроллеров с ядром Cortex M3/M4. Хотя, пожалуй, «методика» — слишком громкое слово. Скорее, я просто разберу на примере то, как я анализирую возникновение тяжелых отказов, и покажу, что можно сделать в подобной ситуации. Я буду использовать программное обеспечение от IAR и отладочную плату STM32F4DISCOVERY, так как эти инструменты есть у многих начинающих программистов. Однако это совершенно не принципиально, данный пример можно адаптировать под любой процессор семейства и любую среду разработки.

Падение в HardFault
Перед тем, как пытаться анализировать HatdFault, нужно в него попасть. Есть много способов это сделать. Мне сразу же пришло на ум попытаться переключить процессор из состояния Thumb в состояние ARM, путем задания адреса инструкции безусловного перехода четным числом.
Небольшое отступление. Как известно, микроконтроллеры семейства Cortex M3/M4 используют набор ассемблерных инструкций Thumb-2 и всегда работают в режиме Thumb. Режим ARM не поддерживается. Если попытаться задать значение адреса безусловного перехода(BX reg) со сброшенным младшим битом, то произойдет исключение UsageFault, так как процессор будет пытаться переключить своё состояние в ARM. Подробнее об этом можно почитать в [1](пункты 2.8 THE INSTRUCTION SET; 4.3.4 Assembler Language: Call and Unconditional Branch).
Для начала, я предлагаю смоделировать безусловный переход по четному адресу на языке C/C++. Для этого я создам функцию func_hard_fault, затем попытаюсь вызвать ее по указателю, предварительно уменьшив адрес указателя на единицу. Сделать это можно следующим образом:
void func_hard_fault(void);

void main(void)
{
  void (*ptr_hard_fault_func) (void); //Объявляем указатель на функцию отказа
  ptr_hard_fault_func = reinterpret_cast<void(*)()>(reinterpret_cast<uint8_t *>(func_hard_fault) - 1); //Присваиваем ему значение со сброшенным младшим битом
  ptr_hard_fault_func(); //Вызов функции отказа

  while(1) continue;
}

void func_hard_fault(void) //Функция, вызов которой приведет к отказу
{
  while(1) continue;
}
Посмотрим с отладчиком, что же у меня получилось.
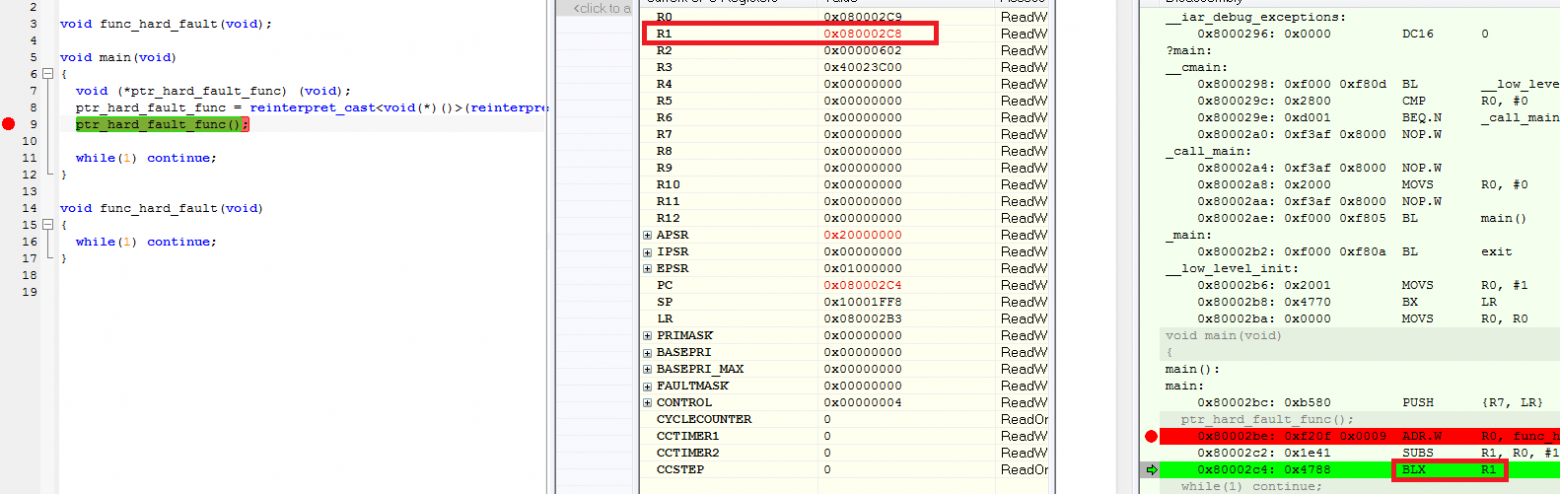
Красным я выделил текущую инструкцию перехода по адресу в РОН R1, который содержит чётный адрес перехода. Как результат:
Еще проще данную операцию можно выполнить с помощью ассемблерных вставок:
void main(void)
{
  //Переходим на свой же адрес
  asm("LDR R1, =0x0800029A"); //Псевдо-инструкция для записи значения переходf
  asm("BX r1"); //Переход по адресу R1

  while(1) continue;
}
Ура, мы попали в HardFault, миссия выполнена!
Анализ HardFault
Откуда мы попали в HardFault?
На мой взгляд, самое важное — узнать то, откуда мы попали в HardFault. Сделать это не сложно. Для начала напишем свой обработчик ситуации HardFault.
extern "C"
{
void HardFault_Handler(void)
{

}
}
Теперь поговорим о том, как выяснить, как мы здесь оказались. В процессорном ядре Cortex M3/M4 есть такая замечательная вещь, как сохранение контекста [1](пункт 9.1.1 Stacking). Если говорить простым языком, при возникновении любого исключения, содержимое регистров R0-R3, R12, LR, PC, PSR сохраняется в стеке.
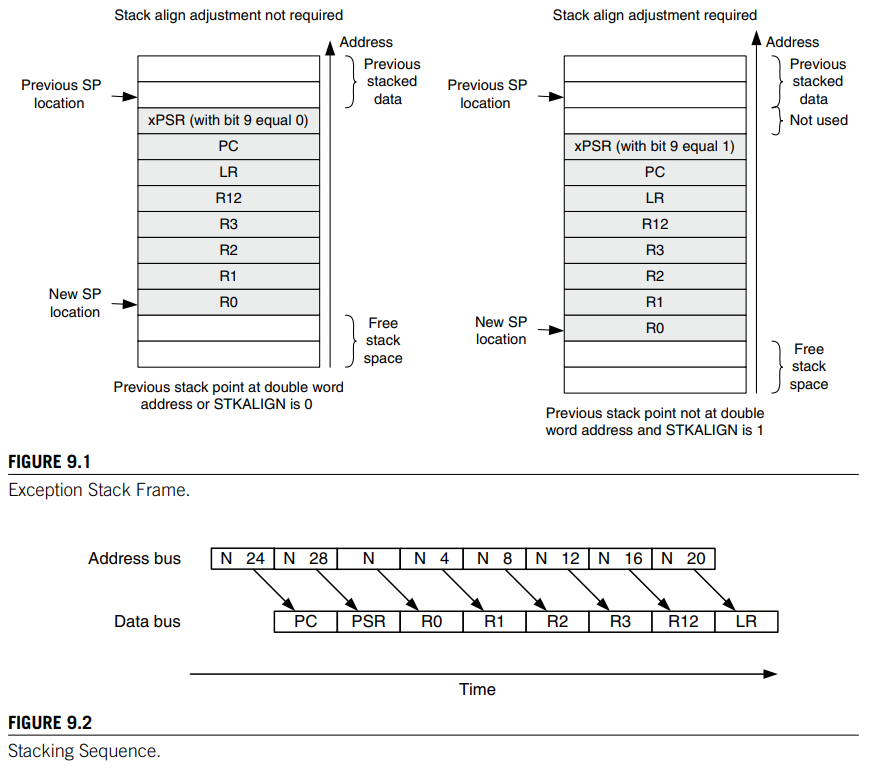
Здесь для нас самым важным будет регистр PC, который содержит информацию о текущей выполняемой инструкции. Так как значение регистра было сохранено в стек во время возникновения исключительной ситуации, то там будет содержаться адрес последней выполняемой инструкции. Остальные регистры менее важны для анализа, но нечто полезное можно выцепить и из них. LR — адрес возврата последнего перехода, R0-R3, R12 — значения, которые могут подсказать в каком направлении двигаться, PSR — просто общий регистр состояния программы.
Предлагаю выяснить значения регистров в обработчике. Для этого был написал такой код (подобный код я встречал в одном из файлов производителя):
extern "C"
{
void HardFault_Handler(void)
{
  struct
  {
    uint32_t r0;
    uint32_t r1;
    uint32_t r2;
    uint32_t r3;
    uint32_t r12;
    uint32_t lr;
    uint32_t pc;
    uint32_t psr;
  }*stack_ptr; //Указатель на текущее значение стека(SP)


  asm(
      "TST lr, #4 \n" //Тестируем 3ий бит указателя стека(побитовое И)
      "ITE EQ \n"   //Значение указателя стека имеет бит 3?
      "MRSEQ %[ptr], MSP  \n"  //Да, сохраняем основной указатель стека
      "MRSNE %[ptr], PSP  \n"  //Нет, сохраняем указатель стека процесса
      : [ptr] "=r" (stack_ptr)
      );

  while(1) continue;
}
}
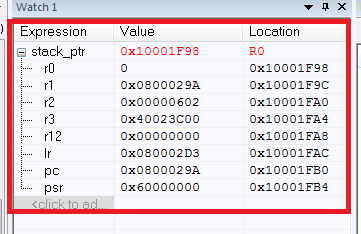
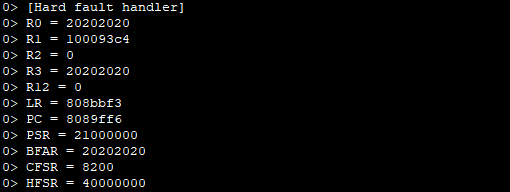
Как результат, имеем значения всех сохраняемых регистров:
Что же здесь произошло? Сначала мы завели указатель стека stack_ptr, тут все понятно. Сложности возникают с ассемблерной вставкой (если есть потребность в понимании ассемблерных инструкций для Cortex, то рекомендую [2]).
Почему мы просто не сохранили стек через MRS stack_ptr, MSP? Дело в том, что ядра Cortex M3/M4 имеют два указателя стека [1](пункт 3.1.3 Stack Pointer R13) — основной указатель стека MSP и указатель стека процесса PSP. Они используются для разных режимов работы процессора. Не буду подробно углубляться в то, для чего это сделано и как это работает, однако дам небольшое пояснение.
Для выяснения режима работы процессора(используется в данный MSP или PSP), нужно проверить третий бит регистра связи. Этот бит определяет то, какой указатель стека используется для возвращения из исключения. Если этот бит установлен, то это MSP, если нет, то PSP. В целом, большинство приложений, написанных на C/C++ используют только MSP, и эту проверку можно и не делать.
Так что же по итогу? Имея список сохраняемых регистров, мы можем без труда определить то, откуда программа упала в HardFault по регистру PC. PC указывает на адрес 0x0800029A, который и является адресом нашей «ломающей» инструкции. Не стоит также забывать о важности значений остальных регистров.
Причина возникновения HardFault
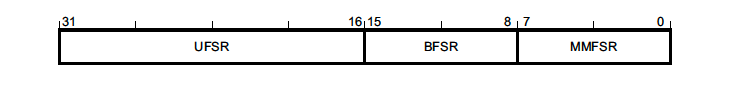
На самом деле, мы можем также выяснить причину возникновения HardFault. В этом нам помогут два регистра. Hard fault status register (HFSR) и Configurable fault status register (CFSR; UFSR+BFSR+MMFSR). Регистр CFSR состоит из трёх регистров: Usage fault status register (UFSR), Bus fault status register (BFSR), Memory management fault address register (MMFSR). Почитать про них можно, например, в [1] и [3].
Предлагаю посмотреть, что эти регистры выдают в моём случае:
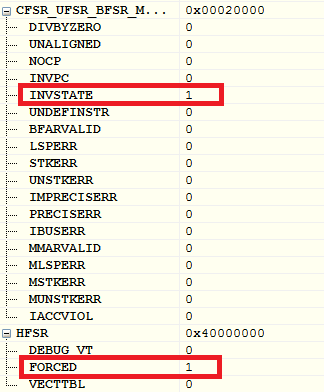
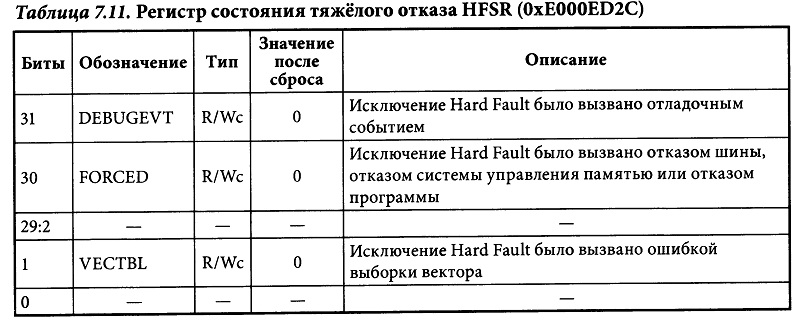
Во-первых, установлен бит HFSR FORCED. Значит произошёл отказ, который не может быть обработан. Для дальнейшей диагностики следует изучить остальные регистры статуса отказов.
Во-вторых, выставлен бит CFSR INVSTATE. Это значит, что произошёл UsageFault, так как процессор попытался выполнить инструкцию, которая незаконно использует EPSR.
Что такое EPSR? EPSR — Execution program status register. Это внутренний регистр PSR — специального регистра состояния программы(который, как мы помним, сохраняется в стеке). Двадцать четвертый бит этого регистра указывает на текущее состояние процессора (Thumb или ARM). Это как раз может определять нашу причину возникновения отказа. Давайте попробуем его считать:
volatile uint32_t EPSR = 0xFFFFFFFF;

  asm(
    "MRS %[epsr], PSP  \n"
    : [epsr] "=r" (EPSR)
      );
В результате выполнения получаем значение EPSR = 0.

Получается, что регистр показывает состояние ARM и мы нашли причину возникновения отказа? На самом деле нет. Ведь согласно [3](стр. 23), считывание этого регистра с помощью специальной команды MSR всегда возвращает нуль. Мне не очень понятно почему это работает именно так, ведь этот регистр и так только для чтения, а тут его полностью и считать нельзя(можно только некоторые биты через xPSR). Возможно это некие ограничения архитектуры.
По итогу, к сожалению, вся эта информация практически ничего не дает рядовому программисту МК. Именно поэтому я рассматриваю все данные регистры только как дополнение к анализу сохраненного контекста.
Однако, например, если отказ был вызван делением на нуль(данный отказ разрешается установкой бита DIV_0_TRP регистра CCR), то в регистре CFSR будет выставлен бит DIVBYZERO, что укажет нам на причину возникновения этого самого отказа.
Что дальше?
Что же можно сделать после того, как мы проанализировали причину возникновения отказа? Мне кажется хорошим вариантом такой порядок действий:
- Вывести в отладочную консоль(printf) значения всех анализируемых регистров. Это можно сделать только при наличии отладчика JTAG.
- Сохранить информацию об отказе во внутреннюю или внешнюю(если имеется) flash. Также можно вывести значение регистра PC на экран устройства(если имеется).
- Перезагрузить процессор NVIC_SystemReset().
Источники
- Joseph Yiu. The definitive guide to the ARM Cortex-M3.
- Cortex-M3 Devices Generic User Guide.
- STM32 Cortex-M4 MCUs and MPUs programming manual.
Ядро ARM Cortex-M реализует набор исключений отказов (fault exceptions). Каждое исключение относится к определенному условию возникновения ошибки. Если ошибка произошла, то ядро ARM Cortex-M останавливает выполнение текущей инструкции и делает ветвление на функцию обработчика исключения (exception handler). Этот механизм очень похож на тот, который используется для прерываний, где ядро ARM Cortex-M делает ветвление на обработчик прерывания (interrupt handler, ISR), когда принимает прерывание.
CMSIS определяет следующие имена для обработчиков отказов (fault handlers):
UsageFault_Handler()
BusFault_Handler()
MemMang_Handler()
HardFault_Handler()
Перечисление всех причин и обстоятельств, при которых ядро ARM Cortex-M вызывает каждый из этих обработчиков, выходит за рамки этого документа (перевод статьи [1]). См. литературу по ARM Cortex-M для ARM и разные другие источники, если нужны подробности. Ошибки типа HardFault встречаются наиболее часто, поскольку другие типы отказов, не разрешенные по отдельности, пройдут эскалацию, чтобы превратиться в hard fault.
Несмотря на многочисленные запросы поддержки RTOS, когда люди жаловались, что при использовании ядра RTOS, их приложение падает в обработчик ошибки hard fault, причина аппаратного сбоя оказывалась вовсе не в ядре. Обычно это было одно из следующего:
• Неправильное понимание приоритетов прерываний ядра ARM Cortex-M (эту оплошность допустить весьма просто!), или неправильное понимание, как использовать модель вложенности прерываний FreeRTOS (см. [2]).
• Общая пользовательская ошибка RTOS. См. статью FAQ «My Application Does Not Run – What Could Be Wrong» [3], специально написанную для помощи в подобных случаях.
• Баг в коде приложения.
Отладка ошибки Hard Fault должна начаться с проверки, что программа приложения следует руководствам [2, 3]. Если после этого ошибка hard fault все еще не исправлена, то необходимо определить состояние системы (system state) в момент времени, когда произошел сбой. Отладчики не всегда упрощают эту задачу, поэтому остальная часть этой статьи описывает техники программирования, используемые для отладки.
[Какой Exception Handler выполнился?]
В таблице векторов прерываний обычно устанавливается один и тот же обработчик для каждого источника прерывания/исключения. Обработчики по умолчанию (default handlers) декларируются как weak-символы (код заглушки), чтобы разработчик приложения мог установить свой собственный обработчик простой реализацией функции с корректным именем. Если произошло прерывание, для которого разработчик приложения не предоставил свой отдельный обработчик, то будет выполнен обработчик по умолчанию (default handler).
[weak-функции на ассемблере]
Символ weak это по сути метка с указанием на код, который может быть при необходимости переопределен простым созданием функции с таким же именем. К примеру, weak-обработчики прерываний проекта IAR для STM32, сгенерированного с помощью STM32CubeMX, для микроконтроллера STM32F407 в коде запуска startup_stm32f407xx.s ;будут выглядеть примерно так (weak-обработчики отказов выделены жирным шрифтом):
...
;;;;;;;;;;;;;;;;;;;;;;;;;;;;;;;;;;;;;;;;;;;;;;;;;;;;
;;
;; Default interrupt handlers.
;;
        THUMB
        PUBWEAK Reset_Handler
        SECTION .text:CODE:REORDER:NOROOT(2)
Reset_Handler
        LDR     R0, =SystemInit
        BLX     R0
        LDR     R0, =__iar_program_start
        BX      R0
        PUBWEAK NMI_Handler
        SECTION .text:CODE:REORDER:NOROOT(1)
NMI_Handler
        B NMI_Handler
        PUBWEAK HardFault_Handler
        SECTION .text:CODE:REORDER:NOROOT(1)
HardFault_Handler
        B HardFault_Handler
        PUBWEAK MemManage_Handler
        SECTION .text:CODE:REORDER:NOROOT(1)
MemManage_Handler
        B MemManage_Handler
        PUBWEAK BusFault_Handler
        SECTION .text:CODE:REORDER:NOROOT(1)
BusFault_Handler
        B BusFault_Handler
        PUBWEAK UsageFault_Handler
        SECTION .text:CODE:REORDER:NOROOT(1)
UsageFault_Handler
        B UsageFault_Handler
        PUBWEAK SVC_Handler
        SECTION .text:CODE:REORDER:NOROOT(1)
SVC_Handler
        B SVC_Handler
        PUBWEAK DebugMon_Handler
        SECTION .text:CODE:REORDER:NOROOT(1)
DebugMon_Handler
        B DebugMon_Handler
...
В модуле кода (это тоже автоматически сгенерированный код) заглушки обработчиков отказов выглядят следующим образом:
...
/** * @brief This function handles Hard fault interrupt. */
void HardFault_Handler(void)
{
  /* USER CODE BEGIN HardFault_IRQn 0 */
  /* USER CODE END HardFault_IRQn 0 */
  while (1)
  {
    /* USER CODE BEGIN W1_HardFault_IRQn 0 */
    /* USER CODE END W1_HardFault_IRQn 0 */
  }
}
/** * @brief This function handles Memory management fault. */
void MemManage_Handler(void)
{
  /* USER CODE BEGIN MemoryManagement_IRQn 0 */
  /* USER CODE END MemoryManagement_IRQn 0 */
  while (1)
  {
    /* USER CODE BEGIN W1_MemoryManagement_IRQn 0 */
    /* USER CODE END W1_MemoryManagement_IRQn 0 */
  }
}
/** * @brief This function handles Pre-fetch fault, memory access fault. */
void BusFault_Handler(void)
{
  /* USER CODE BEGIN BusFault_IRQn 0 */
  /* USER CODE END BusFault_IRQn 0 */
  while (1)
  {
    /* USER CODE BEGIN W1_BusFault_IRQn 0 */
    /* USER CODE END W1_BusFault_IRQn 0 */
  }
}
/** * @brief This function handles Undefined instruction or illegal state. */
void UsageFault_Handler(void)
{
  /* USER CODE BEGIN UsageFault_IRQn 0 */
  /* USER CODE END UsageFault_IRQn 0 */
  while (1)
  {
    /* USER CODE BEGIN W1_UsageFault_IRQn 0 */
    /* USER CODE END W1_UsageFault_IRQn 0 */
  }
}
...
[weak-функции на языке C]
Пример:
/**
******************************************************************************
* File Name : freertos.c
* Description : Код для приложений FreeRTOS.
******************************************************************************
*/
#include "pins.h"
#include "FreeRTOS.h"
#include "task.h"
/* Прототипы Hook-функций */
void vApplicationTickHook(void);
// Эта функция может быть переопределена в любом месте кода пользователя,
// но уже без атрибута __weak:
__weak void vApplicationTickHook( void )
{
   /* Эта функция будет вызвана на каждом прерывании тика, если в файле
FreeRTOSConfig.h параметр configUSE_TICK_HOOK установлен в 1. Сюда
может быть добавлен код пользователя, однако нужно помнить, что
tick hook вызывается из контекста прерывания, поэтому вставленный
здесь код не должен делать попытки блокирования, и должен использовать
только те API-функции FreeRTOS, которые специально разрешено
вызывать из прерываний (т. е. те, которые оканчиваются на
   ...FromISR). */
}
Обработчики по умолчанию обычно реализуются как бесконечный цикл. Если приложение заканчивает работу на таком default handler, то сначала необходимо определить, где именно произошло прерывание выполнения кода.
Следующий кусок кода демонстрирует, как добавить несколько инструкций к бесконечному циклу обработчика по умолчанию, чтобы загрузить номер выполняющегося прерывания в регистр 2 (r2) перед входом в бесконечный цикл.
Номера прерываний здесь считываются из NVIC относительно начала таблицы векторов, в которой есть записи для системных исключений (таких как hard fault), они находятся выше записей прерываний периферийных устройств. Если в r2 находится значение 3, то обработано исключение hard fault. Если r2 содержит значение, равное или больше 16, то это обрабатывается прерывание периферии, и периферийное устройство, которое вызвало прерывание, можно определить вычитанием 16 из номера прерывания.
Default_Handler:
   /* Загрузка адреса регистра управления прерываниями в r3. */
   ldr r3, NVIC_INT_CTRL_CONST
   /* Загрузка значения регистра управления прерываниями в r2 из
      адреса, находящегося в r3. */
   ldr r2, [r3, 0]
   /* Номер прерывания находится в младшем байте - очистка всех других бит. */
   uxtb r2, r2
Infinite_Loop:
   /* Теперь садимся в бесконечный цикл, номер выполненного прерывания
      находится в r2. */
   b  Infinite_Loop
   .size  Default_Handler, .-Default_Handler
.align 4
/* Адрес регистра управления прерываниями NVIC. */
NVIC_INT_CTRL_CONST: .word 0xe000ed04
[Отладка ARM Cortex-M Hard Fault]
Окно стека (stack frame) обработчика fault handler содержит состояние регистров ARM Cortex-M в момент времени, когда произошла ошибка. Код ниже показывает, как прочитать значения регистров из стека в переменные C. Когда это сделано, значения этих переменных могут быть проинспектированы в отладчике точно так же, как и другие переменные.
Сначала определяется очень короткая функция на ассемблере, чтобы определить, какой стек использовался, когда произошла ошибка. Как только это выполнено код ассемблера fault handler передает указатель на стек в C-функцию с именем prvGetRegistersFromStack().
Обработчик fault handler показан ниже в синтаксисе GCC. Обратите внимание, что функция была декларирована как naked, так что она не содержит никакого кода, генерированного компилятором (например, здесь нет кода пролога входа в функцию).
/* Реализация fault handler, которая вызывает функцию prvGetRegistersFromStack(). */
static void HardFault_Handler(void)
{
   __asm volatile
   (
      " tst lr, #4                                                n"
      " ite eq                                                    n"
      " mrseq r0, msp                                             n"
      " mrsne r0, psp                                             n"
      " ldr r1, [r0, #24]                                         n"
      " ldr r2, handler2_address_const                            n"
      " bx r2                                                     n"
      " handler2_address_const: .word prvGetRegistersFromStack    n"
   );
}
Реализация функции prvGetRegistersFromStack() показана ниже. Она копирует значения из стека в переменные C, после чего падает в цикл. Имена переменных выбраны, в соответствии с именами регистров, чтобы было проще проанализировать значения, считанные из соответствующих регистров. Другие регистры не будут изменяться с момента возникновения ошибки, и их можно просмотреть в окне отображения регистров CPU отладчика.
void prvGetRegistersFromStack( uint32_t *pulFaultStackAddress )
{
   /* Здесь используется volatile в попытке предотвратить оптимизацию
компилятора/линкера, которые любят выбрасывать переменные,
которые реально нигде не используются. Если отладчик не показывает
значение этих переменных, то сделайте их глобальными, вытащив
      их декларацию за пределы этой функции. */
   volatile uint32_t r0;
   volatile uint32_t r1;
   volatile uint32_t r2;
   volatile uint32_t r3;
   volatile uint32_t r12;
   volatile uint32_t lr; /* регистр связи (Link Register) */
   volatile uint32_t pc; /* программный счетчик (Program Counter) */
   volatile uint32_t psr;/* регистр состояния (Program Status Register) */
   r0 = pulFaultStackAddress[ 0 ];
   r1 = pulFaultStackAddress[ 1 ];
   r2 = pulFaultStackAddress[ 2 ];
   r3 = pulFaultStackAddress[ 3 ];
   r12 = pulFaultStackAddress[ 4 ];
   lr = pulFaultStackAddress[ 5 ];
   pc = pulFaultStackAddress[ 6 ];
   psr = pulFaultStackAddress[ 7 ];
/* Когда выполнение дойдет до этой точки, переменные будут
      содержать значения регистров. */
   for( ;; );
}
[Использование значений регистров]
Самый первый из интересующих регистров это программный счетчик. В показанном выше коде переменная pc как раз и содержит значение программного счетчика. Когда ошибка это точный отказ (precise fault), pc хранит адрес инструкции, которая была выполнена, когда произошла ошибка hard fault (или другой fault). Когда ошибка это неточный отказ (imprecise fault), то требуются дополнительные шаги, чтобы найти адрес инструкции, которая привела к ошибке.
Чтобы найти инструкцию по адресу которая хранится в переменной pc, сделайте одно из следующего.
1. Откройте окно кода ассемблера (точнее дизассемблированного кода) в отладчике, и вручную введите значение адреса из переменной pc, чтобы посмотреть инструкции по этому адресу.
2. Откройте окно точек останова (break point) в отладчике, и вручную определите точку останова (break point) на этом адресе (execution break) или точку останова по доступу (access break) к этому адресу. С установленной break point перезапустите приложение, чтобы увидеть строку кода, относящуюся к адресу инструкции, которая соответствует переменной pc.
Когда известна инструкция, которая была выполнена при возникновении fault, можно узнать интересующие значения в других регистрах. Например, если инструкция использовала значение R7 в качестве адреса, то нужно знать значение R7. В будущем, анализируя код ассемблера и код C, из которого был сгенерирован этот ассемблерный код, можно увидеть, что реально содержится в R7 (например, это может быть значение переменной).
[Как разобраться с неточным отказом]
Отказы (faults) платформы ARM Cortex-M могут быть точными (precise fault) или неточными (imprecise fault). Если установлен бит IMPRECISERR (бит 2) в регистре отказа шины (BusFault Status Register, или BFSR, который доступен как байт по адресу 0xE000ED29), то это сигнал неточного отказа (imprecise fault).
Обнаружить причину imprecise fault сложнее, потому что fault не обязательно будет происходить одновременно с выполнением инструкции, приведшей к отказу. Например, если идет кэшированная запись в память, то может быть задержка между инструкцией ассемблера, инициировавшей запись в память, и реальной операцией записи в память. Если такая отложенная запись в память недопустима (например, попытка записи в несуществующую физически память) то произойдет imprecise fault, и значение программного счетчика, полученного с помощью вышеуказанного примера кода, не будет соответствовать адресу инструкции, которая инициировала недопустимую операцию записи.
В примере, показанном выше, выключите буферизацию записи установкой бита DISDEFWBUF (бит 1) в регистре ACTLR (Auxiliary Control Register), что в результате превратит imprecise fault в precise fault, и это упростит отладку ценой замедления выполнения программы.
[Ссылки]
1. Debugging Hard Fault & Other Exceptions site:freertos.org.
2. Приоритеты прерываний Cortex-M и приоритеты FreeRTOS.
3. FreeRTOS: базовые техники отладки и поиска ошибок (FAQ).
4. FreeRTOS: использование стека и проверка стека на переполнение.
5. FreeRTOS: практическое применение, часть 6 (устранение проблем).
6. Проектирование стека и кучи в IAR.
7. FreeRTOS, STM32: отладка ошибок и исключений.
8. IAR C-SPY: предупреждение о переполнении стека.
Иногда при отлаживании программы можно увидеть как при зависании программы мы попадаем в HardFault_Handler. Давайте разберемся с причинами.
Если появляются ситуации, когда процессор не может правильно выполнить свою работу — то возникают отказы. Отказы можно наблюдать в обработчике прерывания отказов.
Процессор Cortex-M3 имеет следующие виды отказов:
- тяжелые отказы (Hard Fault)
- отказы системы управления памятью (MemManage Fault)
- отказы программы (Usage Fault)
- отказы шины (Bus Fault)
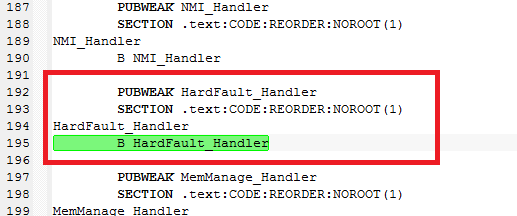
В startup файле от keil прерывания отказов:
HardFault_Handler\
                PROC
                EXPORT      HardFault_Handler          [WEAK]
                B       .
                ENDP
MemManage_Handler\
                PROC
                EXPORT      MemManage_Handler          [WEAK]
                B       .
                ENDP
BusFault_Handler\
                PROC
                EXPORT      BusFault_Handler           [WEAK]
                B       .
                ENDP
UsageFault_Handler\
                PROC
                EXPORT      UsageFault_Handler         [WEAK]
                B       .
                ENDP
Но если предварительно не разрешить прерывания для отказов, то при возникновении любого (Bus, Usage, MemManage, Hard Fault) отказа попадать будем в HardFaultHandler (по умолчанию HardFaultHandler всегда разрешен — запретить его можно в регистре FAULTMASK).
Для разрешения прерывания для других отказов:
SCB->SHCSR |= SCB_SHCSR_BUSFAULTENA;
SCB->SHCSR |= SCB_SHCSR_MEMFAULTENA;
SCB->SHCSR |= SCB_SHCSR_USGFAULTENA;
Рассмотрим причины отказов.
Hard Fault
Исключение Hard Fault может быть вызвано отказом программы, отказом шины или отказом системы управления памятью в том случае, если выполнение обработчиков указанных системных исключений невозможно. Также тяжёлый отказ может быть вызван отказом шины во время выборки вектора (чтения значения из таблицы векторов). Регистр состояния тяжёлого отказа HFSR контроллера NVIC позволяет определить, был ли вызван данный отказ выборкой вектора. Ecли нет, то обработчик исключения Hard Faultдолжен будет проверить содержимое других регистров xFSR для определения причины возникновения отказа (отказ Bus, Usage, MemManage).
Bus Fault
Отказы шины возникают при получении сигнала ошибки во время обмена по шине АНВ. Обычно это происходит в следующих случаях:
- При попытке обращения по недопустимому адресу (например, в вашем микроконтроллере RAM начинается с 0x20000000 и размером0x4000, а вы пытаетесь прочитать/записать 0x20004010 — адрес не задействован ни одной периферией микроконтроллера).
- Если устройство не готово к обмену (например, при попытке обращения к динамическому ОЗУ до инициализации контроллера динамической памяти).
- При попытке обмена с разрядностью, не поддерживаемой конечным устройством.
Точный отказ — отказ , вызванный последней завершенной операцией(например, операция чтения вызовет точный отказ, поскольку команда чтения не может быть завершена до тех пор, пока не будут получены данные).
Неточный отказ — отказы, вызванный выполнением уже завершенной операции (запись с буферизацией), которая могла произойти несколько тактов назад.
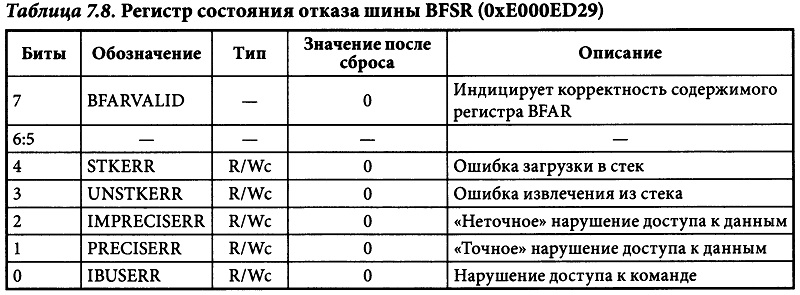
В случае точного отказа шины адрес команды, вызвавшей ошибку, может быть определён из значения, сохранённого в стеке счётчика команд. Если при этом установлен бит BFARVALID регистра BFSR, то дополнительно можно будет определить адрес памяти, обращение к которому вызвало отказ шины. Значение данного адреса содержится в регистре адреса отказа шины BFAR (&(SCB->BFAR)) контроллера NVIC. ДЛЯ неточных отказов шины подобная информация недоступна, поскольку на момент получения сообщения об ошибке процессор мoг уже выполнить несколько других команд.
MemManage Fault
Отказы системы управления памятью мoгут быть вызваны обращением к памяти, конфликтующим с настройкам модуля MPU, или же некорректным обращением (например, при попытке выполнить код из области памяти, не имеющей такой возможности), которое может генерировать отказ даже в случае отсутствия модуля MPU. Наиболее частыми отказами, связанными с модулем MPU, являются:
- обращение к областям памяти, не заданным в настройках модуля MPU;
- запись в области памяти, предназначенные только для чтения;
- обращение на пользовательском уровне к области, допускающей обращение только на привилегированном уровне.
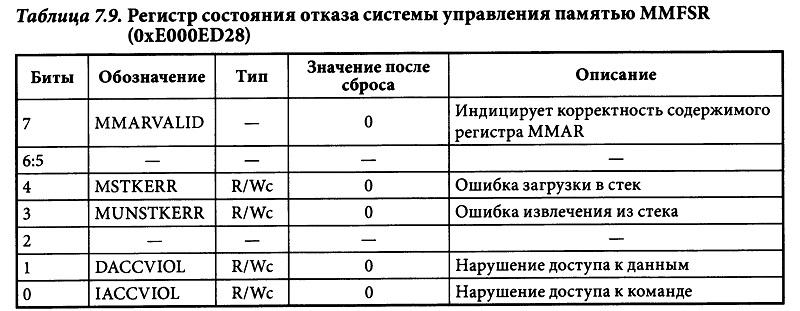
Если MMFSR регистр показывает, что отказ произошёл при нарушении прав доступа во время обращения к данным (бит DACCVIOL) или к команде (бит IACCVIOL), то адрес команды, вызвавшей ошибку, может быть определён из значения счётчика команд, сохранённого в стеке. Если при этом установлен бит MMARVALID регистра MMFSR, то из регистра адреса отказа системы управления памятью MMFAR контроллера NVIC можно будет прочитать адрес памяти, обращение к которому вызвало отказ.
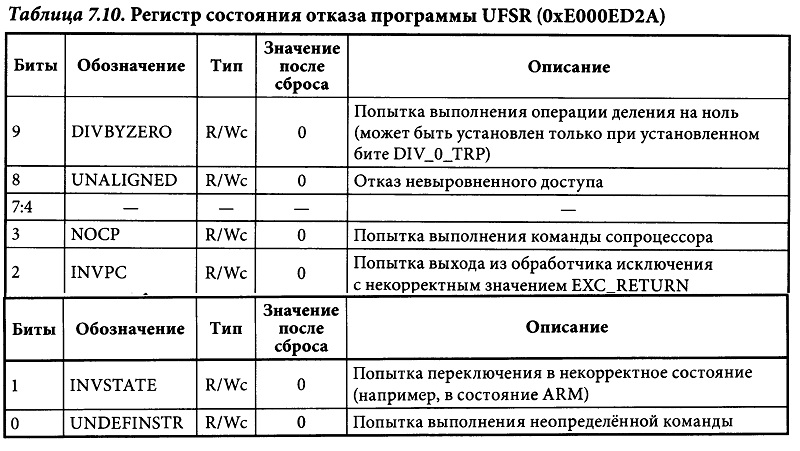
Usage Fault
Наиболее распространенной причиной возникновения отказов программы является попытка переключения процессора в режим ARM. Это может произойти при загрузке в PC нового значения со сброшенным младшим битом. Как правило это происходит при попытке перехода по команде BX или BLX по адресу, содержащемуся в регистре без предварительной установки младшего бита значения.
Note: Более подробно об отказах можно прочитать в книге Ядро «Cortex-M3 компании ARM, полное руководство» стр. 154.
Faults happen on embedded devices all the time for a variety of reasons – ranging from
something as simple as a NULL pointer dereference to something more unexpected like
running a faulty code path only when in a zero-g environment on the Tower of Terror in
Disneyland1. It’s important for any embedded engineer to understand how to debug and resolve
this class of issue quickly.
In this article, we explain how to debug faults on ARM Cortex-M based devices. In the process, we
learn about fault registers, how to automate fault analysis, and figure out ways to recover from
some faults without rebooting the MCU. We include practical examples, with a step by step walk-through on how to investigate them.
If you’d rather listen to me present this information and see some demos in action, watch this webinar recording.
Like Interrupt? Subscribe to get our latest posts straight to your mailbox.
Table of Contents
- Determining What Caused The Fault
-
Relevant Status Registers
- Configurable Fault Status Registers (CFSR) — 0xE000ED28
- HardFault Status Register (HFSR) — 0xE000ED2C
- Recovering the Call Stack
-
Automating the Analysis
- Halting & Determining Core Register State
- Fault Register Analyzers
- Postmortem Analysis
- Recovering From A Fault
-
Examples
- eXecute Never Fault
- Bad Address Read
- Coprocessor Fault
- Imprecise Fault
- Fault Entry Exception
- Recovering from a UsageFault without a SYSRESET
Determining What Caused The Fault
All MCUs in the Cortex-M series have several different pieces of state which can be analyzed when a fault takes place to trace down what went wrong.
First we will explore the dedicated fault status registers that are present on all Cortex-M MCUs except the Cortex-M0.
If you are trying to debug a Cortex-M0, you can skip ahead to the next section where we discuss how to recover the core register state and instruction being executed at the time of the exception.
NOTE: If you already know the state to inspect when a fault occurs, you may want to skip ahead to the section about how to automate the analysis.
Relevant Status Registers
Configurable Fault Status Registers (CFSR) — 0xE000ED28
This 32 bit register contains a summary of the fault(s) which took place and resulted in the exception. The register is comprised of three different status registers – UsageFault, BusFault & MemManage Fault Status Registers:
The register can be accessed via a 32 bit read at 0xE000ED28 or each register can be read individually. For example, in GDB it would look something like this:
- Entire CFSR —
print/x *(uint32_t *) 0xE000ED28 -
UsageFault Status Register (UFSR) —
print/x *(uint16_t *)0xE000ED2A -
BusFault Status Register (BFSR) —
print/x *(uint8_t *)0xE000ED29 -
MemManage Status Register (MMFSR) —
print/x *(uint8_t *)0xE000ED28
NOTE: If multiple faults have occurred, bits related to several faults may be set. Fields are only cleared by a system reset or by writing a 1 to them.
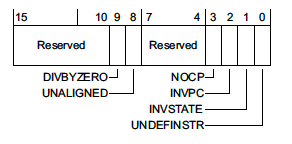
UsageFault Status Register (UFSR) — 0xE000ED2A
This register is a 2 byte register which summarizes any faults that are not related to memory access failures, such as executing invalid instructions or trying to enter invalid states.
where,
-
DIVBYZERO— Indicates a divide instruction was executed where the denominator was zero. This fault is configurable. -
UNALIGNED— Indicates an unaligned access operation occurred. Unaligned multiple word accesses, such as accessing auint64_tthat is not8-bytealigned, will always generate this fault. With the exception of Cortex-M0 MCUs, whether or not unaligned accesses below 4 bytes generate a fault is also configurable. -
NOCP— Indicates that a Cortex-M coprocessor instruction was issued but the coprocessor was
disabled or not present. One common case where this fault happens is when code is compiled to use the Floating Point extension (-mfloat-abi=hard-mfpu=fpv4-sp-d16) but the coprocessor was not enabled on boot. -
INVPC— Indicates an integrity check failure onEXC_RETURN. We’ll explore an example below.EXC_RETURNis the value branched to upon return from an exception. If this fault flag is set, it means a reservedEXC_RETURNvalue was used on exception exit. -
INVSTATE— Indicates the processor has tried to execute an instruction with an invalid
Execution Program Status Register (EPSR) value. Among other things the ESPR tracks whether or not the processor is in thumb mode state. Instructions which use “interworking addresses”2 (bx&blxorldr&ldmwhen loading apc-relative value) must setbit[0]of the instruction to 1 as this is used to updateESPR.T. If this rule is violated, aINVSTATEexception will be generated. When writing C code, the compiler will take care of this automatically, but this is a common bug which can arise when hand-writing assembly. -
UNDEFINSTR— Indicates an undefined instruction was executed. This can happen on exception exit if the stack got corrupted. A compiler may emit undefined instructions as well for code paths that should be unreachable.
Configurable UsageFault
It is worth noting that some classes of UsageFaults are configurable via the Configuration and Control Register (CCR) located at address 0xE000ED14.
- Bit 4 (
DIV_0_TRP) — Controls whether or not divide by zeros will trigger a fault. - Bit 3 (
UNALIGN_TRP) — Controls whether or not unaligned accesses will always generate a fault.
NOTE: On reset both of these optional faults are disabled. It is generally a good idea to enable
DIV_0_TRPto catch mathematical errors in your code.
BusFault Status Register (BFSR) — 0xE000ED29
This register is a 1 byte register which summarizes faults related to instruction prefetch or memory access failures.
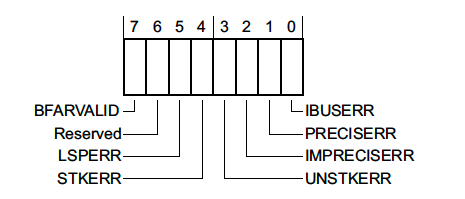
-
BFARVALID— Indicates that the Bus Fault Address Register (BFAR), a 32 bit register located at0xE000ED38, holds the address which triggered the fault. We’ll walk through an example using this info below. -
LSPERR&STKERR— Indicates that a fault occurred during lazy state preservation or during exception entry, respectively. Both are situations where the hardware is automatically saving state on the stack. One way this error may occur is if the stack in use overflows off the valid RAM address range while trying to service an exception. We’ll go over an example below. -
UNSTKERR— Indicates that a fault occurred trying to return from an exception. This typically arises if the stack was corrupted while the exception was running or the stack pointer was changed and its contents were not initialized correctly. -
IMPRECISERR— This flag is very important. It tells us whether or not the hardware was able to determine the exact location of the fault. We will explore some debug strategies when this flag is set in the next section and walk through a code exampe below. -
PRECISERR— Indicates that the instruction which was executing prior to exception entry triggered the fault.
Imprecise Bus Error Debug Tips
Imprecise errors are one of the hardest classes of faults to debug. They result asynchronously to instruction execution flow. This means the registers stacked on exception entry will not point to the code that caused the exception.
Instruction fetches and data loads should always generate synchronous faults for Cortex-M devices and be precise. Conversely, store operations can generate asynchronous faults. This is because writes will sometimes be buffered prior to being flushed to prevent pipeline stalls so the program counter will advance before the actual data store completes.
When debugging an imprecise error, you will want to inspect the code around the area reported by the exception for a store that looks suspicious. If the MCU has support for the ARM Embedded Trace Macrocell (ETM), the history of recently executed instructions can be viewed by some debuggers3.
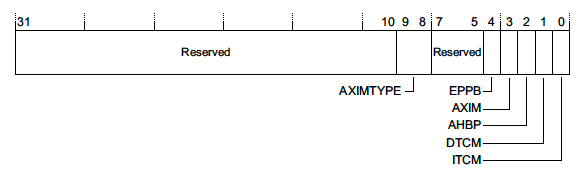
Auxiliary Control Register (ACTLR) — 0xE000E008
This register allows for some hardware optimizations or features to be disabled typically at the cost of overall performance or interrupt latency. The exact configuration options available are specific to the Cortex-M implementation being used.
For the Cortex M3 & Cortex M4 only, there is a trick to make all IMPRECISE accesses PRECISE by disabling any write buffering. This can be done by setting bit 1 (DISDEFWBUF) of the register to 1.
For the Cortex M7, there is no way to force all stores to be synchronous / precise.
Auxiliary Bus Fault Status Register (ABFSR) — 0xE000EFA8
This register only exists for Cortex-M7 devices. When an IMPRECISE error occurs it will at least give us an indication of what memory bus the fault occurred on4:
A full discussion of memory interfaces is outside the scope of this article but more details can be found in the reference manual 4.
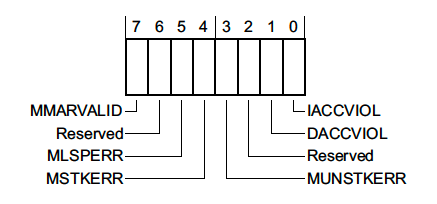
MemManage Status Register (MMFSR) — 0xE000ED28
This register reports Memory Protection Unit faults.
Typically MPU faults will only trigger if the MPU has been configured and enabled by the firmware. However, there are a few memory access errors that will always result in a MemManage fault – such as trying to execute code from the system address range (0xExxx.xxxx).
The layout of the register looks like this:
where,
-
MMARVALID— Indicates that the MemManage Fault Address Register (MMFAR), a 32 bit register located at0xE000ED34, holds the address which triggered the MemManage fault. -
MLSPERR&MSTKERR— Indicates that a MemManage fault occurred during lazy state preservation or exception entry, respectively. For example, this could happen if an MPU region is being used to detect stack overflows. -
MUNSTKERR— Indicates that a fault occurred while returning from an exception -
DACCVIOL— Indicates that a data access triggered the MemManage fault. -
IACCVIOL— Indicates that an attempt to execute an instruction triggered an MPU or Execute Never (XN) fault. We’ll explore an example below.
HardFault Status Register (HFSR) — 0xE000ED2C
This registers explains the reason a HardFault exception was triggered.
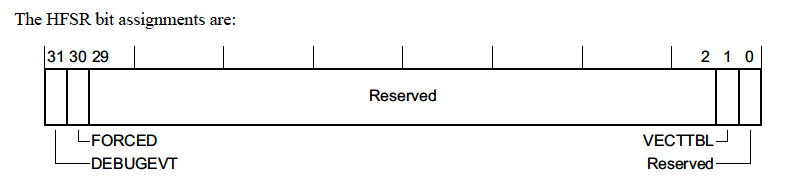
There’s not too much information in this register but we will go over the fields real quickly
-
DEBUGEVT— Indicates that a debug event (i.e executing a breakpoint instruction) occurred while the debug subsystem was not enabled -
FORCED— This means a configurable fault (i.e. the fault types we discussed in previous sections) was escalated to a HardFault, either because the configurable fault handler was not enabled or a fault occurred within the handler. -
VECTTBL— Indicates a fault occurred because of an issue reading from an address in the vector table. This is pretty atypical but could happen if there is a bad address in the vector table and an unexpected interrupt fires.
Recovering the Call Stack
To fix a fault, we will want to determine what code was running when the fault occurred. To accomplish this, we need to recover the register state at the time of exception entry.
If the fault is readily reproducible and we have a debugger attached to the board, we can manually add a breakpoint for the function which handles the exception. In GDB this will look something like
(gdb) break HardFault_Handler
Upon exception entry some registers will always be automatically saved on the stack. Depending on whether or not an FPU is in use, either a basic or extended stack frame will be pushed by hardware.
Regardless, the hardware will always push the same core set of registers to the very top of the stack which was active prior to entering the exception. ARM Cortex-M devices have two stack pointers, msp & psp. Upon exception entry, the active stack pointer is encoded in bit 2 of the EXC_RETURN value pushed to the link register. If the bit is set, the psp was active prior to exception entry, else the msp was active.
Let’s look at the state when we break in HardFault_Handler for a pathological example:
int illegal_instruction_execution(void) {
  int (*bad_instruction)(void) = (void *)0xE0000000;
  return bad_instruction();
}
(gdb) p/x $lr
$4 = 0xfffffffd

# psp was active prior to exception if bit 2 is set
# otherwise, the msp was active
(gdb) p/x $lr&(1<<2)
$5 = 0x4

# First eight values on stack will always be:
# r0, r1, r2, r3, r12, LR, pc, xPSR
(gdb) p/a *(uint32_t[8] *)$psp
$16 = {
  0x0 <g_pfnVectors>,
  0x200003c4 <ucHeap+604>,
  0x10000000,
  0xe0000000,
  0x200001b8 <ucHeap+80>,
  0x61 <illegal_instruction_execution+16>,
  0xe0000000,
  0x80000000
}
Offset 6 and 7 in the array dumped hold the LR (illegal_instruction_execution) & PC (0xe0000000) so we now can see exactly where the fault originated!
Faults from Faults!
The astute observer might wonder what happens when a new fault occurs in the code dealing with a fault.
If you have enabled configurable fault handlers (i.e MemManage, BusFault, or UsageFault), a fault generated in these handlers will trigger a HardFault.
Once in the HardFault Handler, the ARM Core is operating at a non-configurable priority level, -1. At this level or above, a fault will put the processor in an unrecoverable state where a reset is expected. This state is known as Lockup.
Typically, the processor will automatically reset upon entering lockup but this is not a requirement per the specification. For example, you may have to enable a hardware watchdog for a reset to take place. It’s worth double checking the reference manual for the MCU being used for clarification.
When a debugger is attached, lockup often has a different behavior. For example, on the NRF52840,
“Reset from CPU lockup is disabled if the device is in debug interface mode”5.
When a lockup happens, the processor will repeatedly fetch the same fixed instruction, 0xFFFFFFFE or the instruction which triggered the lockup, in a loop until a reset occurs.
Fun Fact: Whether or not some classes of MemManage or BusFaults trigger a fault from an exception
is actually configurable via the MPU_CTRL.HFNMIENA & CCR.BFHFNMIGN register fields, respectively.
Automating the Analysis
At this point we have gone over all the pieces of information which can be manually examined to determine what caused a fault. While this might be fun the first couple times, it can become a tiresome and error prone process if you wind up doing it often. In the following sections we’ll explore how we can automate this analysis!
Halting & Determining Core Register State
What if we are trying to debug an issue that is not easy to reproduce? Even if we have a debugger attached, useful state may be overwritten before we have a chance to halt the debugger and take a look.
The first thing we can do is to programmatically trigger a breakpoint when the system faults:
// NOTE: If you are using CMSIS, the registers can also be
// accessed through CoreDebug->DHCSR & CoreDebug_DHCSR_C_DEBUGEN_Msk
#define HALT_IF_DEBUGGING()                              \
  do {                                                   \
    if ((*(volatile uint32_t *)0xE000EDF0) & (1 << 0)) { \
      __asm("bkpt 1");                                   \
    }                                                    \
} while (0)
Above, we discussed how to hand unroll the register state prior to the exception taking place. Let’s explore how we can instrument the code to make this a less painful process.
First, we can easily define a C struct to represent the register stacking:
typedef struct __attribute__((packed)) ContextStateFrame {
  uint32_t r0;
  uint32_t r1;
  uint32_t r2;
  uint32_t r3;
  uint32_t r12;
  uint32_t lr;
  uint32_t return_address;
  uint32_t xpsr;
} sContextStateFrame;
We can determine the stack pointer that was active prior to the exception using a small assembly shim that applies the logic discussed above and passes the active stack pointer as an argument into my_fault_handler_c:
#define HARDFAULT_HANDLING_ASM(_x)               \
  __asm volatile(                                \
      "tst lr, #4 \n"                            \
      "ite eq \n"                                \
      "mrseq r0, msp \n"                         \
      "mrsne r0, psp \n"                         \
      "b my_fault_handler_c \n"                  \
                                                 )
Finally, we can put together my_fault_handler_c that looks something like:
// Disable optimizations for this function so "frame" argument
// does not get optimized away
__attribute__((optimize("O0")))
void my_fault_handler_c(sContextStateFrame *frame) {
  // If and only if a debugger is attached, execute a breakpoint
  // instruction so we can take a look at what triggered the fault
  HALT_IF_DEBUGGING();

  // Logic for dealing with the exception. Typically:
  //  - log the fault which occurred for postmortem analysis
  //  - If the fault is recoverable,
  //    - clear errors and return back to Thread Mode
  //  - else
  //    - reboot system
}
Now when a fault occurs and a debugger is attached, we will automatically hit a breakpoint and be able to look at the register state!
Re-examining our illegal_instruction_execution example we have:
0x00000244 in my_fault_handler_c (frame=0x200005d8 <ucHeap+1136>) at ./cortex-m-fault-debug/startup.c:94
94	  HALT_IF_DEBUGGING();
(gdb) p/a *frame
$18 = {
  r0 = 0x0 <g_pfnVectors>,
  r1 = 0x200003c4 <ucHeap+604>,
  r2 = 0x10000000,
  r3 = 0xe0000000,
  r12 = 0x200001b8 <ucHeap+80>,
  lr = 0x61 <illegal_instruction_execution+16>,
  return_address = 0xe0000000,
  xpsr = 0x80000000
}
Furthermore, we now have a variable we can read stack info from and a C function we can easily extend for postportem analysis!
Fault Register Analyzers
Instrumenting the code
Many Real Time Operating Systems (RTOS) targetting Cortex-M devices will add options to dump
verbose fault register information to the console upon crash. Some examples include Arm Mbed OS6
and Zephyr7. For example, with Zephyr, the illegal_instruction_execution() crash looks like:
***** MPU FAULT *****
  Instruction Access Violation
***** Hardware exception *****
Current thread ID = 0x20000074
Faulting instruction address = 0xe0000000
Fatal fault in thread 0x20000074! Aborting.
This approach has a couple notable limitations:
- It bloats the code & data size of the binary image and consequently often gets turned off.
- It can increase the stack size requirements for the fault handler (due to printf calls)
- It requires a firmware update to improve or fix issues with the analyzers
- It requires a console session be active to see what fault occurred. Furthermore, this can be flaky if the system is in a crashed state.
Debugger Plugins
Many embedded IDEs expose a system view that can be used to look at registers. The registers will often be decoded into human readable descriptions. These implementations typically leverage the CMSIS System View Description (SVD) format8, a standardized XML file format for describing the memory mapped registers in an ARM MCU. Most silicon vendors expose this information on their own website, ARM’s website9, or provide the files upon request.
You can even load these files in GDB using PyCortexMDebug10, a GDB python script .
To use the utility, all you need to do is update your .gdbinit to use PyPi packages from your environment (instructions here) and then run:
$ git clone git@github.com:bnahill/PyCortexMDebug.git
# Check out Python 2 compatible code
$ git checkout 77af54e
$ cd PyCortexMDebug
$ python setup.py install
When you next start gdb, you can source the svd_gdb.py script and use it to start inspecting registers. Here’s some output for the svd plugin we will use in the examples below:
(gdb) source cmdebug/svd_gdb.py
(gdb) svd_load cortex-m4-scb.svd
(gdb) svd
Available Peripherals:
    ...
	SCB:        System control block
    ...
(gdb) svd SCB
Registers in SCB:
    ...
	CFSR_UFSR_BFSR_MMFSR:      524288  Configurable fault status register
    ...
(gdb) svd SCB CFSR_UFSR_BFSR_MMFSR
Fields in SCB CFSR_UFSR_BFSR_MMFSR:
	IACCVIOL:     0  Instruction access violation flag
	DACCVIOL:     0  Data access violation flag
	MUNSTKERR:    0  Memory manager fault on unstacking for a return from exception
	MSTKERR:      0  Memory manager fault on stacking for exception entry.
	MLSPERR:      0
	MMARVALID:    0  Memory Management Fault Address Register (MMAR) valid flag
	IBUSERR:      1  Instruction bus error
	PRECISERR:    0  Precise data bus error
	IMPRECISERR:  0  Imprecise data bus error
	UNSTKERR:     0  Bus fault on unstacking for a return from exception
	STKERR:       0  Bus fault on stacking for exception entry
	LSPERR:       0  Bus fault on floating-point lazy state preservation
	BFARVALID:    0  Bus Fault Address Register (BFAR) valid flag
	UNDEFINSTR:   0  Undefined instruction usage fault
	INVSTATE:     1  Invalid state usage fault
	INVPC:        0  Invalid PC load usage fault
	NOCP:         0  No coprocessor usage fault.
	UNALIGNED:    0  Unaligned access usage fault
	DIVBYZERO:    0  Divide by zero usage fault
Postmortem Analysis
The previous two approaches are only helpful if we have a debug or physical connection to the device. Once the product has shipped and is out in the field these strategies will not help to triage what went wrong on devices.
One approach is to simply try and reproduce the issue on site. This is a guessing game (are you
actually reproducing the same issue the customer hit?), can be a huge time sink and in some cases is not even particularly feasible1.
Another strategy is to log the fault register and stack values to persistent storage and periocially collect or push the error logs. On the server side, the register values can be decoded and addresses can be symbolicated to try to root cause the crash.
Alternatively, an end-to-end firmware error analysis system, such as
Memfault,
can be used to automatically collect, transport, deduplicate and surface the faults and crashes happening in the field. Here is some example output from Memfault for the bad memory read example we will walk through below:
Recovering From A Fault
DISCLAIMER: Typically when a fault occurs, the best thing to do is reset the MCU since it’s hard to be certain what parts of the MCU were corrupted as part of the fault (embedded MCUs don’t offer a MMU like you would find on a bigger processors).
Occasionally, you may want to recover the system from a fault without rebooting it. For example, maybe you have one RTOS task isolated by the MPU that just needs to be restarted.
Let’s quickly explore how we could implement a recovery mechanism that puts a RTOS task which experience a UsageFault into an idle loop and reboots the system otherwise.
We will use the
Application Interrupt and Reset Control Register to reset the device if the fault is unrecoverable. We can easily extend my_fault_handler_c from above:
void my_fault_handler_c(sContextStateFrame *frame) {
[...]
  volatile uint32_t *cfsr = (volatile uint32_t *)0xE000ED28;
  const uint32_t usage_fault_mask = 0xffff0000;
  const bool non_usage_fault_occurred =
      (*cfsr & ~usage_fault_mask) != 0;
  // the bottom 8 bits of the xpsr hold the exception number of the
  // executing exception or 0 if the processor is in Thread mode
  const bool faulted_from_exception = ((frame->xpsr & 0xFF) != 0);

  if (faulted_from_exception || non_usage_fault_occurred) {
    // For any fault within an ISR or non-usage faults
    // let's reboot the system
    volatile uint32_t *aircr = (volatile uint32_t *)0xE000ED0C;
    *aircr = (0x05FA << 16) | 0x1 << 2;
    while (1) { } // should be unreachable
  }
[...]
}
Now, the interesting part, how do we clean up our state and return to normal code from the HardFault handler?!
There’s a few things we will need to do:
- Clear any logged faults from the
CFSRby writing 1 to each bit which is set. - Change the function we return to so we idle the task. In the example case it’s
recover_from_task_fault. - Scribble a known pattern over the
lr. The function we are returning to will need to take special action (i.e like deleting the task or entering awhile(1)loop). It can’t just exit and branch to where we were before so we want to fault if this is attempted. - Reset the
xpsr. Among other things the xpsr tracks the state of previous comparison instructions which were run and whether or not we are in the middle of a “If-Then” instruction block. The only bit that needs to remain set is the “T” field (bit 24) indicating the processor is in thumb mode11.
This winds up looking like:
  // Clear any logged faults from the CFSR
  *cfsr |= *cfsr;
  // the instruction we will return to when we exit from the exception
  frame->return_address = (uint32_t)recover_from_task_fault;
  // the function we are returning to should never branch
  // so set lr to a pattern that would fault if it did
  frame->lr = 0xdeadbeef;
  // reset the psr state and only leave the
  // "thumb instruction interworking" bit set
  frame->xpsr = (1 << 24);
You may recall from the
RTOS Context Switching post
that fault handlers can work just like regular C functions so after these changes we will exit from
my_fault_handler_c and start executing whatever is in recover_from_task_fault function. We will walk through an example of this below.
Examples
In the sections below we will walk through the analysis of a couple faults.
For this setup we will use:
- a nRF52840-DK12 (ARM Cortex-M4F) as our development board
- SEGGER JLinkGDBServer13 as our GDB Server.
- GCC 8.3.1 / GNU Arm Embedded Toolchain as our compiler14
- GNU make as our build system
All the code can be found on the Interrupt Github page with more details in the README in the directory linked.
Setup
Start a GDB Server:
JLinkGDBServer -if swd -device nRF52840_xxAA
Follow the instructions above to setup support for reading SVD files from GDB, build, and flash the example app:
$ make
[...]
Linking library
Generated build/nrf52.elf
$ arm-none-eabi-gdb-py --eval-command="target remote localhost:2331" --ex="mon reset" --ex="load" --ex="mon reset" --se=build/nrf52.elf
$ source PyCortexMDebug/cmdebug/svd_gdb.py
$ (gdb) svd_load cortex-m4-scb.svd
Loading SVD file cortex-m4-scb.svd...
(gdb)
The app has eight different crashes you can configure by changing FAULT_EXAMPLE_CONFIG at compile time or by editing the value at runtime:
(gdb) break main
(gdb) continue
(gdb) set g_crash_config=1
(gdb) continue
eXecute Never Fault
Code
int illegal_instruction_execution(void) {
  int (*bad_instruction)(void) = (void *)0xE0000000;
  return bad_instruction();
}
Analysis
(gdb) break main
(gdb) continue
Breakpoint 1, main () at ./cortex-m-fault-debug/main.c:180
180	  xQueue = xQueueCreate(mainQUEUE_LENGTH, sizeof(unsigned long));
(gdb) set g_crash_config=0
(gdb) c
Continuing.

Program received signal SIGTRAP, Trace/breakpoint trap.
0x00000218 in my_fault_handler_c (frame=0x200005e8 <ucHeap+1152>) at ./cortex-m-fault-debug/startup.c:91
91	  HALT_IF_DEBUGGING();
(gdb) bt
#0  0x00000218 in my_fault_handler_c (frame=0x200005e8 <ucHeap+1152>) at ./cortex-m-fault-debug/startup.c:91
#1  <signal handler called>
#2  0x00001468 in prvPortStartFirstTask () at ./cortex-m-fault-debug/freertos_kernel/portable/GCC/ARM_CM4F/port.c:267
#3  0x000016e6 in xPortStartScheduler () at ./cortex-m-fault-debug/freertos_kernel/portable/GCC/ARM_CM4F/port.c:379
#4  0x1058e476 in ?? ()
We can check the CFSR to see if there is any information about the fault which occurred.
(gdb) p/x *(uint32_t*)0xE000ED28
$3 = 0x1
(gdb) svd SCB CFSR_UFSR_BFSR_MMFSR
Fields in SCB CFSR_UFSR_BFSR_MMFSR:
	IACCVIOL:     1  Instruction access violation flag
[...]
That’s interesting! We hit a Memory Management instruction access violation fault even though we haven’t enabled any MPU regions. From the CFSR, we know that the stacked frame is valid so we can take a look at that to see what it reveals:
(gdb) p/a *frame
$1 = {
  r0 = 0x0 <g_pfnVectors>,
  r1 = 0x200003c4 <ucHeap+604>,
  r2 = 0x10000000,
  r3 = 0xe0000000,
  r12 = 0x200001b8 <ucHeap+80>,
  lr = 0x195 <prvQueuePingTask+52>,
  return_address = 0xe0000000,
  xpsr = 0x80000000
}
We can clearly see that the executing instruction was 0xe0000000 and that the calling function was prvQueuePingTask.
From the ARMv7-M reference manual15 we find:
The MPU is restricted in how it can change the default memory map attributes associated with System space, that is, for addresses 0xE0000000 and higher. System space is always marked as XN, Execute Never.
So the fault registers didn’t lie to us, and it does make sense that we hit a memory management fault!
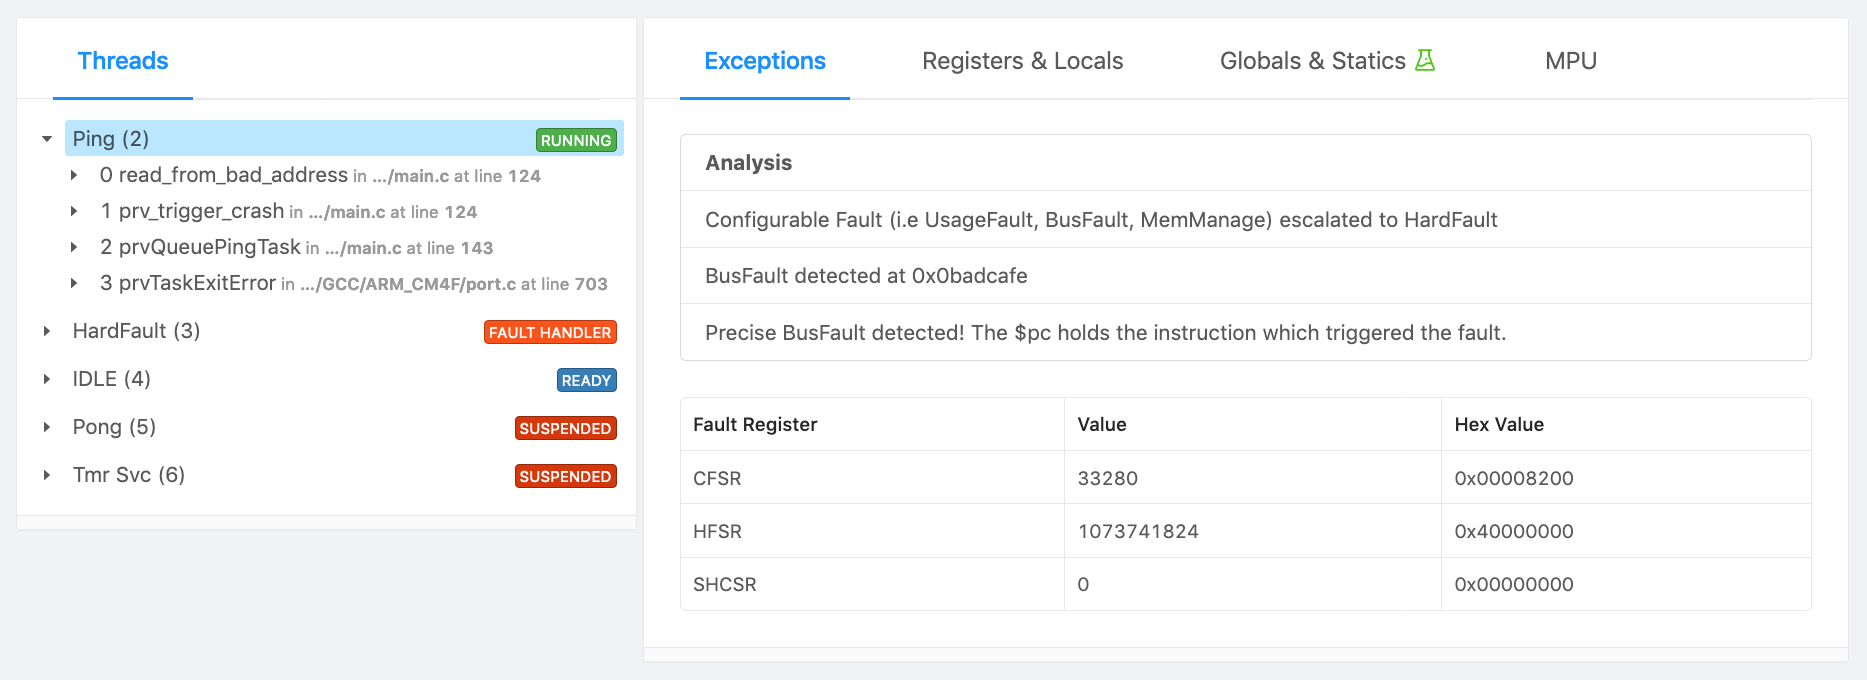
Bad Address Read
Code
uint32_t read_from_bad_address(void) {
  return *(volatile uint32_t *)0xbadcafe;
}
Analysis
(gdb) break main
(gdb) continue
Breakpoint 1, main () at ./cortex-m-fault-debug/main.c:189
189	  xQueue = xQueueCreate(mainQUEUE_LENGTH, sizeof(unsigned long));
(gdb) set g_crash_config=1
(gdb) c
Continuing.

Program received signal SIGTRAP, Trace/breakpoint trap.
0x00000218 in my_fault_handler_c (frame=0x200005e8 <ucHeap+1152>) at ./cortex-m-fault-debug/startup.c:91
91	  HALT_IF_DEBUGGING();
Again, let’s take a look at the CFSR and see if it tells us anything useful.
(gdb) p/x *(uint32_t*)0xE000ED28
$13 = 0x8200
(gdb) svd SCB CFSR_UFSR_BFSR_MMFSR
Fields in SCB CFSR_UFSR_BFSR_MMFSR:
[...]
    PRECISERR:    1  Precise data bus error
[...]
    BFARVALID:    1  Bus Fault Address Register (BFAR) valid flag
Great, we have a precise bus fault which means the return address in the stack frame holds the instruction which triggered the fault and that we can read BFAR to determine what memory access triggered the fault!
(gdb) svd/x SCB BFAR
Fields in SCB BFAR:
	BFAR:  0x0BADCAFE  Bus fault address

(gdb) p/a *frame
$16 = {
  r0 = 0x1 <g_pfnVectors+1>,
  r1 = 0x200003c4 <ucHeap+604>,
  r2 = 0x10000000,
  r3 = 0xbadcafe,
  r12 = 0x200001b8 <ucHeap+80>,
  lr = 0x195 <prvQueuePingTask+52>,
  return_address = 0x13a <trigger_crash+22>,
  xpsr = 0x81000000
}

(gdb) info line *0x13a
Line 123 of "./cortex-m-fault-debug/main.c" starts at address 0x138 <trigger_crash+20> and ends at 0x13e <trigger_crash+26>.

(gdb) list *0x13a
0x13a is in trigger_crash (./cortex-m-fault-debug/main.c:123).
118	  switch (crash_id) {
119	    case 0:
120	      illegal_instruction_execution();
121	      break;
122	    case 1:
===> FAULT HERE
123	      read_from_bad_address();
124	      break;
125	    case 2:
126	      access_disabled_coprocessor();
127	      break;
Great, so we have pinpointed the exact code which triggered the issue and can now fix it!
Coprocessor Fault
Code
void access_disabled_coprocessor(void) {
  // FreeRTOS will automatically enable the FPU co-processor.
  // Let's disable it for the purposes of this example
  __asm volatile(
      "ldr r0, =0xE000ED88 \n"
      "mov r1, #0 \n"
      "str r1, [r0]	\n"
      "dsb \n"
      "vmov r0, s0 \n"
      );
}
Analysis
(gdb) break main
(gdb) continue
Breakpoint 4, main () at ./cortex-m-fault-debug/main.c:180
180	  xQueue = xQueueCreate(mainQUEUE_LENGTH, sizeof(unsigned long));
(gdb) set g_crash_config=2
(gdb) c
Continuing.

Program received signal SIGTRAP, Trace/breakpoint trap.
0x00000218 in my_fault_handler_c (frame=0x20002d80) at ./cortex-m-fault-debug/startup.c:91
91	  HALT_IF_DEBUGGING();
We can inspect CFSR to get a clue about the crash which took place
(gdb) p/x *(uint32_t*)0xE000ED28
$13 = 0x8200
(gdb) svd SCB CFSR_UFSR_BFSR_MMFSR
Fields in SCB CFSR_UFSR_BFSR_MMFSR:
[...]
	NOCP:         1  No coprocessor usage fault.
[...]
We see it was a coprocessor UsageFault which tells us we either issued an instruction to a non-existent or disabled Cortex-M coprocessor. We know the frame contents are valid so we can inspect that to figure out where the fault originated:
(gdb) p/a *frame
$27 = {
  r0 = 0xe000ed88,
  r1 = 0x0 <g_pfnVectors>,
  r2 = 0x10000000,
  r3 = 0x0 <g_pfnVectors>,
  r12 = 0x200001b8 <ucHeap+80>,
  lr = 0x199 <prvQueuePingTask+52>,
  return_address = 0x114 <access_disabled_coprocessor+12>,
  xpsr = 0x81000000
}

(gdb) disassemble 0x114
Dump of assembler code for function access_disabled_coprocessor:
   0x00000108 <+0>:	ldr	r0, [pc, #16]	; (0x11c)
   0x0000010a <+2>:	mov.w	r1, #0
   0x0000010e <+6>:	str	r1, [r0, #0]
   0x00000110 <+8>:	dsb	sy
===> FAULT HERE on a Floating Point instruction
   0x00000114 <+12>:	vmov	r0, s0
   0x00000118 <+16>:	bx	lr
vmov is a floating point instruction so we now know what coprocessor the NOCP was caused by. The FPU is enabled using bits 20-23 of the CPACR register located at 0xE000ED88. A value of 0 indicates the extension is disabled. Let’s check it:
(gdb) p/x (*(uint32_t*)0xE000ED88 >> 20) & 0xf
$29 = 0x0
We can clearly see the FP Extension is disabled. We will have to enable the FPU to fix our bug.
Imprecise Fault
Code
void bad_addr_double_word_write(void) {
  volatile uint64_t *buf = (volatile uint64_t *)0x30000000;
  *buf = 0x1122334455667788;
}
Analysis
(gdb) break main
(gdb) continue
Breakpoint 4, main () at ./cortex-m-fault-debug/main.c:182
182	  xQueue = xQueueCreate(mainQUEUE_LENGTH, sizeof(unsigned long));
(gdb) set g_crash_config=3
(gdb) c
Continuing.

Program received signal SIGTRAP, Trace/breakpoint trap.
0x0000021c in my_fault_handler_c (frame=0x200005e8 <ucHeap+1152>) at ./cortex-m-fault-debug/startup.c:91
91	  HALT_IF_DEBUGGING();
Let’s inspect CFSR:
(gdb) p/x *(uint32_t*)0xE000ED28
$31 = 0x400
(gdb) svd SCB CFSR_UFSR_BFSR_MMFSR
Fields in SCB CFSR_UFSR_BFSR_MMFSR:
[...]
	IMPRECISERR:  1  Imprecise data bus error
[...]
Yikes, the error is imprecise. This means the stack frame will point to the general area where the fault occurred but not the exact instruction!
(gdb) p/a *frame
$32 = {
  r0 = 0x55667788,
  r1 = 0x11223344,
  r2 = 0x10000000,
  r3 = 0x30000000,
  r12 = 0x200001b8 <ucHeap+80>,
  lr = 0x199 <prvQueuePingTask+52>,
  return_address = 0x198 <prvQueuePingTask+52>,
  xpsr = 0x81000000
}
(gdb) list *0x198
0x198 is in prvQueuePingTask (./cortex-m-fault-debug/main.c:162).
157
158	  while (1) {
159	    vTaskDelayUntil(&xNextWakeTime, mainQUEUE_SEND_FREQUENCY_MS);
160	    xQueueSend(xQueue, &ulValueToSend, 0U);
161
==> Crash somewhere around here
162	    trigger_crash(g_crash_config);
163	  }
164	}
165
166	static void prvQueuePongTask(void *pvParameters) {
Analysis after making the Imprecise Error Precise
If the crash was not readily reproducible we would have to inspect the code around this region and hypothesize what looks suspicious. However, recall that there is a trick we can use for the Cortex-M4 to make all memory stores precise. Let’s enable that and re-examine:
(gdb) mon reset
Resetting target
(gdb) c
Continuing.

Breakpoint 4, main () at ./cortex-m-fault-debug/main.c:182
182	  xQueue = xQueueCreate(mainQUEUE_LENGTH, sizeof(unsigned long));
(gdb) set g_crash_config=3

==> Make all memory stores precise at the cost of performance
==> by setting DISDEFWBUF in the Cortex M3/M4 ACTLR reg
(gdb) set *(uint32_t*)0xE000E008=(*(uint32_t*)0xE000E008 | 1<<1)

(gdb) c
Continuing.

Program received signal SIGTRAP, Trace/breakpoint trap.
0x0000021c in my_fault_handler_c (frame=0x200005e8 <ucHeap+1152>) at ./cortex-m-fault-debug/startup.c:91
91	  HALT_IF_DEBUGGING();
(gdb) p/a *frame
$33 = {
  r0 = 0x55667788,
  r1 = 0x11223344,
  r2 = 0x10000000,
  r3 = 0x30000000,
  r12 = 0x200001b8 <ucHeap+80>,
  lr = 0x199 <prvQueuePingTask+52>,
  return_address = 0xfa <bad_addr_double_word_write+10>,
  xpsr = 0x81000000
}
(gdb) list *0xfa
0xfa is in bad_addr_double_word_write (./cortex-m-fault-debug/main.c:92).
90	void bad_addr_double_word_write(void) {
91	  volatile uint64_t *buf = (volatile uint64_t *)0x30000000;
==> FAULT HERE
92	  *buf = 0x1122334455667788;
93	}
(gdb)
Awesome, that saved us some time … we were able to determine the exact line that caused the crash!
Fault Entry Exception
Code
void stkerr_from_psp(void) {
  extern uint32_t _start_of_ram[];
  uint8_t dummy_variable;
  const size_t distance_to_ram_bottom =
      (uint32_t)&dummy_variable - (uint32_t)_start_of_ram;
  volatile uint8_t big_buf[distance_to_ram_bottom - 8];
  for (size_t i = 0; i < sizeof(big_buf); i++) {
    big_buf[i] = i;
  }

  trigger_irq();
}
Analysis
(gdb) break main
(gdb) continue
Breakpoint 4, main () at ./cortex-m-fault-debug/main.c:182
182	  xQueue = xQueueCreate(mainQUEUE_LENGTH, sizeof(unsigned long));
(gdb) set g_crash_config=4
(gdb) c
Continuing.

Program received signal SIGTRAP, Trace/breakpoint trap.
0x0000021c in my_fault_handler_c (frame=0x1fffffe0) at ./cortex-m-fault-debug/startup.c:91
91	  HALT_IF_DEBUGGING();
Let’s take a look at CFSR again to get a clue about what happened:
(gdb) p/x *(uint32_t*)0xE000ED28
$39 = 0x1000
(gdb) svd SCB CFSR_UFSR_BFSR_MMFSR
Fields in SCB CFSR_UFSR_BFSR_MMFSR:
[...]
	STKERR:       1  Bus fault on stacking for exception entry
Debug Tips when dealing with a STKERR
There are two really important things to note when a stacking exception occurs:
- The stack pointer will always reflect the correct adjusted position as if the hardware successfully stacked the registers. This means you can find the stack pointer prior to exception entry by adding the adjustment value.
- Depending on what access triggers the exception, the stacked frame may be partially valid. For example, the very last store of the hardware stacking could trigger the fault and all the other stores could be valid. However, the order the hardware pushes register state on the stack is implementation specific. So when inspecting the frame assume the values being looked at may be invalid!
Taking this knowledge into account, let’s examine the stack frame:
(gdb) p frame
$40 = (sContextStateFrame *) 0x1fffffe0
Interestingly, if we look up the memory map of the NRF5216, we will find that RAM starts at 0x20000000. Our stack pointer location, 0x1fffffe0 is right below that in an undefined memory region. This must be why we faulted! We see that the stack pointer is 32 bytes below RAM, which matches the size of sContextStateFrame. This unfortunately means none of the values stacked will be valid since all stores were issued to a non-existent address space!
We can manually walk up the stack to get some clues:
(gdb) x/a 0x20000000
0x20000000 <uxCriticalNesting>:	0x3020100
(gdb)
0x20000004 <g_crash_config>:	0x7060504
(gdb)
0x20000008 <xQueue>:	0xb0a0908
(gdb)
0x2000000c <s_buffer>:	0xf0e0d0c
(gdb)
0x20000010 <s_buffer+4>:	0x13121110
(gdb)
0x20000014 <s_buffer+8>:	0x17161514
(gdb)
0x20000018 <pxCurrentTCB>:	0x1b1a1918
(gdb)
0x2000001c <pxDelayedTaskList>:	0x1f1e1d1c
(gdb)
0x20000020 <pxOverflowDelayedTaskList>:	0x23222120
It looks like the RAM has a pattern of sequentially increasing values and that the RAM addresses map to different variables in our code (i.e pxCurrentTCB). This suggests we overflowed the stack we were using and started to clobber RAM in the system until we ran off the end of RAM!
TIP: To catch this type of failure sooner consider using an MPU Region
Since the crash is reproducible, let’s leverage a watchpoint and see if we can capture the stack corruption in action! Let’s add a watchpoint for any access near the bottom of RAM, 0x2000000c:
(gdb) mon reset
(gdb) continue
Breakpoint 4, main () at ./cortex-m-fault-debug/main.c:182
182	  xQueue = xQueueCreate(mainQUEUE_LENGTH, sizeof(unsigned long));
(gdb) set g_crash_config=4
(gdb) watch *(uint32_t*)0x2000000c
Hardware watchpoint 9: *(uint32_t*)0x2000000c
TIP: Sometimes it will take a couple tries to choose the right RAM range to watch. It’s possible an area of the stack never gets written to and the watchpoint never fires or that the memory address being watched gets updated many many times before the actual failure. In this example, I intentionally opted not to watch 0x20000000 because that is the address of a FreeRTOS variable,
uxCriticalNestingwhich is updated a lot.
Let’s continue and see what happens:
(gdb) continue
Hardware watchpoint 9: *(uint32_t*)0x2000000c

Old value = 0
New value = 12
0x000000c0 in stkerr_from_psp () at ./cortex-m-fault-debug/main.c:68
68	    big_buf[i] = i;
(gdb) bt
#0  0x000000c0 in stkerr_from_psp () at ./cortex-m-fault-debug/main.c:68
#1  0x00000198 in prvQueuePingTask (pvParameters=<optimized out>) at ./cortex-m-fault-debug/main.c:162
#2  0x00001488 in ?? () at ./cortex-m-fault-debug/freertos_kernel/portable/GCC/ARM_CM4F/port.c:703
Backtrace stopped: previous frame identical to this frame (corrupt stack?)
(gdb) list *0xc0
0xc0 is in stkerr_from_psp (./cortex-m-fault-debug/main.c:68).
63	  extern uint32_t _start_of_ram[];
64	  uint8_t dummy_variable;
65	  const size_t distance_to_ram_bottom = (uint32_t)&dummy_variable - (uint32_t)_start_of_ram;
66	  volatile uint8_t big_buf[distance_to_ram_bottom - 8];
67	  for (size_t i = 0; i < sizeof(big_buf); i++) {
68	    big_buf[i] = i;
69	  }
70
71	  trigger_irq();
72	}
Great, we’ve found a variable located on the stack big_buf being updated. It must be this function call path which is leading to a stack overflow. We can now inspect the call chain and remove big stack allocations!
Recovering from a UsageFault without a SYSRESET
In this example we’ll just step through the code we developed above and confirm we don’t reset when a UsageFault occurs.
Code
void unaligned_double_word_read(void) {
  extern void *g_unaligned_buffer;
  uint64_t *buf = g_unaligned_buffer;
  *buf = 0x1122334455667788;
}
Analysis
(gdb) break main
(gdb) continue
Breakpoint 4, main () at ./cortex-m-fault-debug/main.c:188
188	  xQueue = xQueueCreate(mainQUEUE_LENGTH, sizeof(unsigned long));
(gdb) set g_crash_config=5
(gdb) c
Continuing.

Program received signal SIGTRAP, Trace/breakpoint trap.
0x00000228 in my_fault_handler_c (frame=0x200005e8 <ucHeap+1152>) at ./cortex-m-fault-debug/startup.c:94
94	  HALT_IF_DEBUGGING();
We have entered the breakpoint in the fault handler. We can step over it and confirm we fall through to the recover_from_task_fault function.
(gdb) break recover_from_task_fault
Breakpoint 12 at 0x1a8: file ./cortex-m-fault-debug/main.c, line 181.
(gdb) n
108	  volatile uint32_t *cfsr = (volatile uint32_t *)0xE000ED28;
(gdb) c
Continuing.

Breakpoint 12, recover_from_task_fault () at ./cortex-m-fault-debug/main.c:181
181	void recover_from_task_fault(void) {

(gdb) list *recover_from_task_fault
0x1a8 is in recover_from_task_fault (./cortex-m-fault-debug/main.c:181).
181	void recover_from_task_fault(void) {
182	  while (1) {
183	    vTaskDelay(1);
184	  }
185	}
If we continue from here we will see the system happily keeps running because the thread which was calling the problematic trigger_crash function is now parked in a while loop. The the while loop could be extended in the future to delete and/or restart the FreeRTOS task if we wanted as well.
Closing
I hope this post gave you a useful overview of how to debug a HardFault on a Cortex-M MCU and that maybe you even learned something new!
Are there tricks you like to use that I didn’t mention or other topics about faults you’d like to learn more about?
Let us know in the discussion area below!
Interested in learning more about debugging HardFaults? Watch this webinar recording..
See anything you’d like to change? Submit a pull request or open an issue at GitHub
References

Chris Coleman is a founder and CTO at Memfault. Prior to founding Memfault, Chris worked on the embedded software teams at Sun, Pebble, and Fitbit.
В первую очередь откройте шестнадцатеричным редактором готовый бинарный файл и посмотрите, действительно ли в начале программы расположена таблица прерываний. В ней первое слово должно быть равно 0x20000000 + размер оперативной памяти — это указатель стека. Дальнейшие слова — указатели прерываний, и скорее всего, большинство из них должны указывать на один и тот же адрес — адрес метки DefaultHandler. Он должен иметь вид приблизительно 0x0800…. Если всё в порядке, идём дальше.
[далее — догадки] В скрипте линкера присутствует переменная vector_table, которой нигде не присваивается значение. Скорее всего, она используется в стартовом ассемблерном коде программы для копирования таблицы прерываний в оперативную память, но так как этой переменной не присвоено значение, копирование происходит непонятно куда. Скорее всего, подразумевалось следующее:
.text : {
    vector_table = .
    *(.vectors) /* Vector table */
    *(.text*)   /* Program code */
    . = ALIGN(4);
    *(.rodata*) /* Read-only data */
    . = ALIGN(4);
} >rom
Чтобы определить точно, нужно смотреть ассемблерные листинги. Поскольку вы располагаете отладчиком, вы можете их протрассировать и найти место, где (возможно) происходит копирование.
Если причина не в этом, можно также проверить таблицу прерываний, действительно ли она подходит вашему контроллеру.